U.S. Department of Transportation
Federal Highway Administration
1200 New Jersey Avenue, SE
Washington, DC 20590
202-366-4000
Federal Highway Administration Research and Technology
Coordinating, Developing, and Delivering Highway Transportation Innovations
 |
| This report is an archived publication and may contain dated technical, contact, and link information |
|
Publication Number: FHWA-RD-98-166
Date: July 1999 |
Guidebook on Methods to Estimate Non-Motorized Travel: Supporting Documentation2.8 Regional Travel Models
Descriptive Criteria: What is It? Categories: Purpose: Regional travel models use existing and future land use conditions and transportation network characteristics, in conjunction with models of human behavior and other travel characteristics, to predict future travel patterns. Regional travel models can be used to predict the impacts of improvements to the bicycle and pedestrian environment on levels of utilitarian (non-recreational) bicycle and pedestrian travel, as well as on motorized vehicle trips, vehicle-miles of travel (VMT), and emissions. The basis for regional travel models is the division of the urban area into zones, which usually correspond to census tracts, and the definition of a network of transportation facilities connecting the zones. The inputs are proposed or projected future transportation systems and forecast population and employment by zone. A four-step process is used: 1. Total trips that start and end in each zone are predicted. 2. These trips are distributed between pairs of zones. 3. The trips are allocated among the available travel modes (usually auto and transit). 4. The trips are assigned to specific facilities included in the highway and transit transportation networks. The data for predicting travel behavior are primarily based on surveys of households to track a sample of travel patterns. Trips are generally predicted separately by trip purpose (i.e., work, shopping, other) and then aggregated into total trips on the network. The primary emphasis in modeling is on peak-hour travel to determine the number of vehicles using each transportation facility at the time when demand is greatest. Regional travel models and their associated data collection efforts have traditionally been oriented toward predicting automobile and to a lesser extent transit trips, and have generally not included non-motorized travel modes. Even if non-motorized modes were to be included as alternatives, existing data on non-motorized travel and network characteristics are often insufficient or of poor quality, and the models have a zonal structure and level of network detail that is too coarse for analyzing short trips. Recreational and non-peak-period travel, which can be important components of non-motorized facility use, are also poorly developed areas of travel modeling. A number of efforts have been made recently to overcome these limitations and incorporate non-motorized travel into recent travel models. In some metropolitan areas of the United States, Canada, and Europe, household travel surveys have been redesigned to include bicycling and walking trips, and models have been modified to incorporate bicycle and/or pedestrian modes as alternatives and describe the characteristics of the bicycle or pedestrian network. Inclusion of non-motorized modes has the potential not only to predict non-motorized trip choice as a result of future changes, but also to predict changes in automobile and transit travel as a result of these changes and improve the overall accuracy of the models. In addition to the full inclusion of non-motorized modes in regional travel models, quick-fix methods can be used to approximate the potential vehicle trip reduction effects of transportation and land use strategies, by manually adjusting trip generation rates, auto ownership levels, or mode choice factors. Such sketch planning methods can be useful when model shortcomings and time and resource constraints limit the opportunity for more complete model development or refinement. Finally, regional travel demand models can provide information, such as trip lengths and distributions by origin/destination and purpose for all modes, that is useful for other non-motorized travel planning activities or forecasting methods. Structure: Most regional travel models that incorporate non-motorized travel do so through the mode choice step. Bicycling and walking are included as options along with auto and transit in logit models of mode choice(2). Bicycle and walk modes may be treated separately or may be combined as one option (non-motorized) because of insufficient data to treat the modes separately. Also, some models distinguish between auto and walk access to transit, but do not include walking as a separate mode choice for an entire trip. All of the models predicting non-motorized mode choice include some combination of travel time, distance, and cost variables to predict mode choice. Some also include other variables that describe the quality of the non-motorized transportation facilities or network for bicycling or walking. Non-motorized network characteristics are incorporated through one of the following two methods: 1. Zone-level factors describing the quality of the area's environment for walking and/or bicycling. These may include population and employment density as well as a pedestrian or bicycle environment factor which describes the relative attractiveness of the area for walking or bicycling based on physical characteristics of the area (presence of sidewalks, pedestrian street crossings, hills, etc.). 2. Network-level variables describing the presence and/or quality of bicycling or walking facilities. The non-motorized network can use the existing model's road network as its basis. Each link can then be coded with bicycle or pedestrian-specific variables (i.e., whether there is a bike path). Additional bicycle or pedestrian-specific links (such as a non-motorized trail) can also be added to the network. As an alternative or supplement to consideration of mode choice, models can be modified to predict the choice of routes by non-motorized travelers as a function of route characteristics. This can only be done if the model includes a network of non-motorized facilities, as described above. The characteristics of the facilities can then be used to predict the routes followed by bicyclists or pedestrians between each pair of zones, once the total number of bicycle or pedestrian trips between each pair of zones has been determined by the mode choice model. Some models have specifically been developed to predict route choice as a function of the bicycle network, where total bicycle trips are based on assumptions exogenous to the model (see entries for "Bicycle Travel Models," Methods 2.9 and 2.10). Other specific approaches to incorporating the bicycle and pedestrian modes into regional travel models are described under "Real World Examples" below. In addition to directly incorporating non-motorized travel into regional travel models, travel model data or output (in the form of zone-to-zone trip tables for all modes, including non-motorized) can be adjusted to estimate non-motorized trips and a corresponding reduction in motorized trips between each pair of zones. Specific examples are given in Chesapeake Bay Foundation (1995) and Clark (1997) and are also described under "Real World Examples" below. Calibration/Validation Approach: Mode choice models are developed using standard statistical procedures for calibrating and validating these models. Selection of the final mode choice model may include extensive testing of a variety of variables and model forms. Model validation is performed by comparing predicted trips for various strata (geographic area, household income, etc.) with the actual number of trips from the household travel survey. Inputs/Data Needs: Travel modeling efforts require extensive data, including:
To incorporate non-motorized travel into regional travel models, additional data are required on non-motorized travel characteristics and on the non-motorized transportation network. In particular: 1. The household travel survey(s) used to develop the model must include data on bicycle and pedestrian trips. These modes have frequently been neglected in standard travel surveys although incorporation is becoming more common. Experience suggests that surveys must be worded carefully to obtain complete information, particularly with respect to short-walk trips which are frequently not reported. In addition, a larger sample size and/or specialized sampling techniques may be required to obtain a sufficient sample size for non-motorized trips, particularly if bicycles and pedestrians are to be modeled as separate modes rather than as a single mode. 2. Data on the bicycle and/or pedestrian network are required if the model is to be sensitive to the effects of network improvements. In particular, local field data collection may be required either to construct environment factors or to add bicycle or pedestrian characteristics or links to the road network. 3. If mode or route choice is to be modeled based on facility characteristics, relative preferences for each type of facility must be developed and related to travel time/distance. This can be done either through special survey efforts or by borrowing or transferring results from studies performed in other areas. Potential Data Sources: In addition to the data sources already compiled for standard travel modeling efforts, the following data sources might be useful for developing bicycle or pedestrian descriptors at the zonal level:
Computational Requirements: The travel modeling process is computationally intensive but can be performed using desktop microcomputers with appropriate software. User Skill/Knowledge: A familiarity with travel demand modeling techniques is required. Assumptions: To date, only a few factors influencing the choice to bike or walk have been incorporated in regional travel models. Trip distance or time is the primary consideration, with trip purpose, personal characteristics, or general environment factors considered in a few cases. One general assumption behind the mode choice component of traditional travel models is that mode choice can be predicted primarily as a function of only travel time and travel cost. In the case of both pedestrian and bicycle travel, however, this has been demonstrated not to be the case, and a variety of environmental and personal factors are perhaps of much greater significance. Exploration of these factors, and how they can best be incorporated into the modeling framework, is necessary before travel models will yield significant useful information on the effects of bicycle and pedestrian design actions. Some practical problems with including non-motorized travel in current models include insufficient data on trips by these modes, insufficient basis for predicting non-motorized travel decisions, lack of information on non-motorized network characteristics, a zonal structure/level of detail which is too coarse for analyzing short trips, and inability to model recreational trips. Therefore, the results produced by these models are only rough approximations and their performance for predicting future levels of non-motorized trip making as a result of improvements or policy changes has not yet been validated.
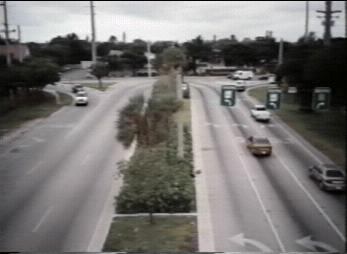
BEFORE
AFTER 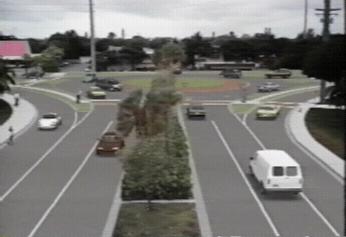
Facility Design Factors: The most common method of incorporating facility design factors to date has been through the use of a Pedestrian Environment Factor (PEF), which is a composite index of a number of factors which are viewed as influencing the attractiveness of an area for walking. One modeling effort (the PROMO pivot-point model for the Washington, DC region) has expanded the PEF to include bicycling factors. The Portland PEF has been applied for modeling in Portland, OR, Sacramento, CA, and adapted for use in the Washington, DC region by adding a bicycle component. A pedestrian-bicycle environment factor (PBEF) has also been developed in Montgomery County, MD. Portland's PEF includes four elements: (1) sidewalk availability; (2) ease of street crossing; (3) connectivity of street/sidewalk system; and (4) terrain. Montgomery County's PBEF includes five elements: (1) extent of sidewalks; (2) land use mix; (3) building setbacks; (4) transit-stop conditions; and (5) bicycle infrastructure. For a description of how these elements are combined into an overall factor, see entry for "Environment Factors," Method 2.17. The travel model for the Edmonton area classifies each link of the network by type of bicycle facility: bike path, bike lane, or mixed traffic. The relative attractiveness of each facility type is used to weight the total travel time between two zones. This general approach could be applied using other facility design factors, given the following: (1) information on the facility design factor for each link in the network; and (2) information on the relative tradeoffs made by cyclists between these facility design factors and travel time. Output Types: The output of the travel modeling process is the number of bicycle and pedestrian trips originating in each traffic analysis zone (total or by trip purpose), and the distribution of these trips between pairs of zones. For the base year (existing conditions), the model is calibrated so that these trips match as closely as possible the actual generation and distribution of trips as reported in the household travel survey. The expected number of trips in some future year can then be predicted based on projected changes in population; employment; land use; demographic characteristics; and the roadway, transit, and bicycle networks. Real-World Examples: The following information is based on Stein (1996), informal communication with modelers, and other sources as noted. Approaches to incorporating non-motorized travel in existing travel models are summarized in table 2.1. Edmonton, Canada. The Edmonton Transport Analysis Model recently developed for the Edmonton, Canada region (Hunt, Brownlee, and Doblanko, 1998) includes both walk and bicycle as separate modes and also includes bicycle network characteristics in determining mode choice. Links in the network model can be coded in three ways: bicycle path, bicycle lane, or mixed traffic. A coefficient in the mode choice model is estimated for bicycle equivalent travel time,which is actual travel time adjusted by a factor representing the relative onerousness of bicycling on each facility type. Time-equivalent penalties by facility type are derived from a stated-preference survey of bicyclists (Hunt and Abraham, 1997), showing that for the average cyclist, one minute of bicycling in mixed traffic is as onerous as 2.8 minutes on bike paths or 4.1 minutes on bike lanes. The model has a number of other notable features, with trip generation, destination, time of day, and mode choice all based on logit models that were estimated using observations of individual travel behavior and applied at an aggregate (zonal) levels for 25 user groups and trip purposes. Composite impedances and accessibility measures feed backwards through each step, including to trip generation. Therefore, improvements to the bicycle network (i.e., addition of lanes or paths) can potentially affect total trip distribution and generation as well as mode choice. The model also estimates the composite utility of travel and therefore can be used to estimate the overall welfare benefits of an improvement to the bicycle network.
Table 2.1 Inclusion of Non-Motorized Modes in Regional Travel Models
Portland, OR. Metro, the MPO for Portland, OR, included the non-motorized mode (walking/bicycling) as an option in the mode choice models for each trip purpose. Mode choice is predicted in two steps: first, motorized vs. non-motorized, and second, auto vs. transit for motorized trips. The motorized vs. non-motorized mode choice is a function of travel distance, ratio of cars to workers in the household, total employment within one mile of zone (a density measure), and a pedestrian environment factor (PEF). (Rossi, Lawton, and Kim, 1993). Sacramento, CA. The Sacramento Area Council of Governments (SACOG) included pedestrian and bicycle modes separately in multinomial mode choice models for each trip purpose (attempts to develop a nested logit model were unsuccessful). A modified version of Portland's PEF is included in the transit, bicycle, and pedestrian mode choices; the PEF in the model is the product of the origin zone and destination zone PEFs. A dummy variable is included for zones in the city of Davis, where university students and staff make large numbers of bicycle and walk trips (Stein, 1996; Metropolitan Transportation Commission, 1997). Montgomery County, MD. The Maryland-National Capital Park and Planning Commission (M-NCPPC) developed a nested logit mode choice model for home-to-work trips which includes walk/bike access to transit as a submode to the transit mode. (Walk/bike is not estimated as a separate mode.) The model includes an index of pedestrian and bicycle friendliness; this is included at both the auto vs. transit and walk vs. auto access-to-transit levels of the model. (Chesapeake Bay Foundation, Environmental Defense Fund, et al., 1996). San Francisco, CA. The Metropolitan Transportation Commission (MTC), the MPO for the San Francisco Bay Area, includes both walk and bicycle modes in their latest set of mode choice models. Bicycle and walk utilities are based on travel time, employment density (for work trip models), and dummy variables for the Stanford, Palo Alto, and Berkeley zones. Travel times are calculated using highway network distances and an assumed speed of 19.3 km/h for bicycles and 4.8 km/h for pedestrians. The MTC models are noteworthy for the variety of trip purposes modeled. Separate trip generation, distribution, and mode choice models are developed for home-based work, home-based shop, home-based school (grade school, high school, and college), home-based social/recreation, and non-home-based trips. Some models have separate time coefficients for bicycle and walk. The MTC also attempted to include population density and area type (CBD, urban, suburban, etc.) in the mode choice models but these variables were not significant in predicting non-motorized mode choice. The MTC did not include the equivalent of a pedestrian and bicycle "environment factor." (Metropolitan Transportation Commission, 1995-1997). Los Angeles, CA. The Southern California Association of Governments (SCAG), the MPO for the Los Angeles region, includes non-motorized travel (bicycle/walk) as a separate mode and also distinguishes walk vs. auto access to transit, for both local and express transit. Non-motorized utilities are based on composite time/cost, autos per capita, household income, population density, CBD of work, a variation on straight-line distance, and dummy variables for LA and Orange Counties. Albany, NY. The Capital District Transportation Committee (CDTC) is incorporating bikes and pedestrians into its regional travel model effort using a two-pronged approach: 1. Incorporating bikes and peds into the mode choice component of the travel model. They have investigated other areas' efforts and plan to develop and collect a pedestrian and bicycle environment factor. 2. Developing separate networks for bikes and peds. These are based on the existing modeled road network, but with "preference-based speed coding." The bike network is coded with speeds between 0 to 16.1 km/h (0 for expressways, 16.1 for Class 1 bikeways and local streets; other links are based on a judgment of the attractiveness for bicycling). Pedestrian links may be coded as improved (4.8 km/h); unimproved but walkable (1.61 km/h); or "off." The speed factors are verified by showing model results for traffic assignment to a bicycle and pedestrian task force and asking them to evaluate the reasonableness of the assigned patterns. These networks have already been developed and used for the purposes of prioritizing 34 bicycle and pedestrian projects in the most recent Transportation Improvement Program (TIP). Bicycle and pedestrian projects have both been evaluated separately from other projects and compared only among themselves because the types of benefits are very different than standard road and transit projects. Projects have been evaluated based on both modeled trip diversion from the mode choice model and on trip potential, in which the pedestrian network is loaded with all trips less than 3.2 km and the bicycle network is loaded with all trips less than 8.0 km. The total modeled response to a proposed project (measured in person-km of travel) is compared to its annualized cost to develop a cost-effectiveness measure which can be used for comparing bicycle and pedestrian projects with each other. For presentation of results to the planning committee, CDTC ranks each project as "high," "medium," or "low" with respect to three factors: market potential, cost-effectiveness, and safety. Each project is given a one-page write-up summarizing the results of the model runs and other project- related information. CDTC plans in 1998 to integrate its bicycle and pedestrian network models with its traffic model so that there is feedback from the bicycle and pedestrian networks into the mode choice component of the traffic model. Berkeley, CA. Ridgway (1995) suggests an approach to incorporating bicycle travel in a travel model developed for the city of Berkeley, CA by Fehr and Peers Associates of Lafayette, CA. The approach includes three of the four elements of standard travel modeling: trip generation, trip distribution, and route assignment. The primary purpose of the model would be for use in prioritizing improvements based on projected levels of demand. Development of the model at the city level rather than the regional level allows a finer level of detail which is better suited for bicycle modeling purposes than the level of detail available in regional models. Trip generation is based on total person-trip tables from the existing travel demand model, factored by bicycle mode splits by census tract based on regression analysis of tract-level characteristics. (Difficulties were encountered in developing a model that could predict bicycle mode splits at the tract level; see entry for "Aggregate Behavior Studies," Method 2.2.) Trip distribution would be conducted using a traditional gravity model, with the impedance factor based on travel distance and calibrated according to work-trip distributions from the 1990 census. Trip assignment would be based on travel distances on a traffic network modified for bicycling purposes. Development of a bicycle preferential rating system for links based on traffic volumes, facility types, and adjacent parking types is suggested but not described. Ridgway is currently developing and applying a similar approach for modeling bicycle travel in San Jose, CA. In addition to directly incorporating non-motorized travel into regional travel models, travel model data or output (in the form of zone-to-zone trip tables for all modes, including non-motorized) can be adjusted to estimate non-motorized trips and a corresponding reduction in motorized trips between each pair of zones. Two approaches were identified: 1. Washington, DC area Proximity Mode Choice Model (PROMO): The PROMO model (Chesapeake Bay Foundation, 1995) is a sketch-planning model that predicts changes from the complete regional models for the Washington region to account for the effects of pedestrian and transit-oriented development. Starting with base-case travel behavior and conditions, walk mode share is adjusted for zones with transit-oriented development, under alternative scenarios, based on changes in employment density, a pedestrian environment factor (adopted from Portland's study), and transit service characteristics. Behavioral relationships are adopted from the Portland and Montgomery Co. models for home-based work trips and from modelers' experience for other trip purposes. PROMO is most readily used to adjust the number of vehicle trips generated at the zone level. PROMO has also been applied in New Jersey to evaluate pedestrian, bicycle, and land use improvements along the Route 1 corridor. The mode split impacts of a variety of improvements are analyzed, including pedestrian crossings (crosswalks, signal timing, and islands); sidewalk continuity and connectivity; and bicycle network connectivity and facilities. These are incorporated by adjusting the pedestrian environment factor for each zone. 2. Modification of trip tables in Bend and Pendleton, Oregon Clark (1997) describes a process to adjust vehicle trip tables in a travel demand model to account for future increases in bicycle and pedestrian trips. Existing trips are stratified by length and purpose, and adjustment factors which represent a potential percent increase in bicycle and pedestrian trips as a result of future improvements are applied to reduce the number of vehicle trips between each origin-destination (O-D) pair. The adjustment factors vary by trip purpose (home-based work, home-based other, and non-home-based); length (less than 0.8 km, 0.8 to 4.0 km, and 4.1 to 8.1 km); and mode (pedestrian and bicycling) and are based on local judgment. Contacts/Source: 1,000 Friends of Oregon: http://www.teleport.com/~friends/Lutraq2/Docs.htm (Portland, OR). David Clark: Kittelson Associates (Portland, OR). John Hunt: University of Calgary, Department of Civil Engineering (Calgary, Alberta). Carolyn Konheim: Konheim and Ketcham (Brooklyn, NY). Chuck Purvis: Metropolitan Transportation Commission (Oakland, CA). Michael Replogle: Environmental Defense Fund (Washington, DC). Matthew Ridgway: Fehr and Peers Associates (Lafayette, CA). Tom Rossi: Cambridge Systematics (Cambridge, MA). Bill Stein: Metropolitan Service District (Portland, OR). Publications: 1,000 Friends of Oregon. Making the Land Use Transportation Air Quality Connection; 1991-1997. Includes multiple volumes describing modeling efforts in Portland to incorporate pedestrians and bicyclists. Available on the web at http://www.teleport.com/~friends/Lutraq2/Docs.htm. Cambridge Systematics, Inc. Short-Term Travel Model Improvements, Travel Model Improvement Program. U.S. Department of Transportation; DOT -T-95-05, pp. 2-1 to 2-7, October 1994. (1994a). Chesapeake Bay Foundation, Environmental Defense Fund, et al. A Network of Livable Communities: Evaluating Travel Behavior Effects of Alternative Transportation and Community Designs for the National Capital Region. Washington, DC, May 1996. Clark, David E., Estimating Future Bicycle and Pedestrian Trips From A Travel Demand Forecasting Model, Institute of Transportation Engineers, 67th Annual Meeting, 1997. Hunt, J.D., A.T. Brownlee, and L.P. Doblanko. Design and Calibration of the Edmonton Transport Analysis Model. Presented at the 1998 Transportation Research Board Annual Meeting, Paper #981076, January 1998. Hunt, J.D. and J.E. Abraham. Influences on Bicycle Use. Submitted for presentation at the 1998 Transportation Research Board Annual Meeting, July 1997. Konheim, Carolyn S., and M. Shahid Iqbal. Route 1 Corridor Collaborative Study (presentation). Konheim and Ketcham, Brooklyn, New York, 1998. Metropolitan Transportation Commission. San Francisco Bay Area 1990 Travel Model Development Project: Compilation of Technical Memoranda (Volumes II-VI). Oakland, CA, 1995-1997. Replogle, Michael. Inside the Black Box: An Insider's Guide to Transportation Models. Pro Bike Pro Walk 96, Bicycle Federation of America/Pedestrian Federation of America, pp. 276-280, September 1996. Replogle, Michael. Integrating Pedestrian and Bicycle Factors into Regional Transportation Planning Models: Summary of the State-of-the-Art and Suggested Steps Forward. Environmental Defense Fund, pp. 1-21, July 1995. Ridgway, Matthew D. Projecting Bicycle Demand: An Application of Travel Demand Modeling Techniques to Bicycles. 1995 Compendium of Technical Papers, Institute of Transportation Engineers 65th Annual Meeting, pp. 755-785, 1995. Rossi, Thomas. T. Keith Lawton and Kyung Hwa Kim. Revision of Travel Demand Models to Enable Analysis of Atypical Land Use Patterns. Cambridge Systematics, Inc. and Metropolitan Service District, May 1993. Stein, William R. Pedestrian and Bicycle Modeling in North America's Urban Areas: A Survey of Emerging Methodologies and MPO Practices. Thesis: Master of City Planning and Master of Science, Georgia Institute of Technology, pp. 1-28, March 1996. Stein, William R. Summary of Bicycle Modeling Efforts at Portland Metro. Metro Travel Forecasting Section, Portland, OR, November 1996. Evaluative Criteria: How Does It Work? Performance: Incorporation of non-motorized travel has led to improvements in some regional travel models in terms of predicting auto vs. non-auto mode split. Portland Metro has found that inclusion of the PEF and non-motorized modes improves the fit of the model, reducing the tendency to over-predict auto trips in pedestrian-friendly areas. The PROMO model was found to be useful for evaluating the mode share effects of improving the pedestrian and bicycle environment. However, the PEF as applied in Sacramento was not statistically significant (MTC, 1997). Inclusion of dummy variables representing bicycle-friendly areas in California models has also improved model fit and could be used to indicate the mode choice impacts of improving non-motorized networks and policies. Use of Existing Resources: Non-motorized modes can be incorporated in existing travel model efforts, but require additional work to develop mode choice models. Additional data collection resources are also required if environment factors are to be developed. Travel Demand Model Integration: Yes. Applicability to Diverse Conditions: Model coefficients for bicycle and walk modes developed in one area can potentially be transferred to modeling efforts in other areas. The PROMO model in Washington, DC, for example, used coefficients taken from the Portland mode choice models. However, the validity of transferring these coefficients has not yet been established. Usage in Decision-Making: The Portland Metro and PROMO models have been used to evaluate the effects of future transportation, land use, and urban design alternatives on travel patterns, including walk/bike and transit mode shares and regional VMT. Ability to Incorporate Changes: Evaluating the effects of different policies or facility design factors requires re-running various elements of the travel demand model. Ease-of-Use: A familiarity with travel demand modeling techniques is required.
FHWA-RD-98-166 |

