U.S. Department of Transportation
Federal Highway Administration
1200 New Jersey Avenue, SE
Washington, DC 20590
202-366-4000
Federal Highway Administration Research and Technology
Coordinating, Developing, and Delivering Highway Transportation Innovations
 |
| This report is an archived publication and may contain dated technical, contact, and link information |
|
Publication Number: FHWA-RD-99-078
Date: 1999 |
Injuries to Pedestrians and Bicyclists: An Analysis Based on Hospital Emergency Department DataCHAPTER 3. BICYCLIST INJURY EVENTS
A primary objective of the project was to determine the frequency and characteristics of bicyclist injury events not involving a motor vehicle and/or those occurring in non-roadway locations. Although typically not reported in State motor vehicle crash files, the review of the literature showed that these events are quite common and can result in serious injuries to bicyclists. The information presented in this chapter draws primarily from the data collected prospectively at the eight participating hospital emergency departments, using the survey form contained in appendix A. Table 7 shows that, overall:
Table 7. Distribution of bicyclist injury cases treated in hospital emergency departments by location and type of event.
1 Percentage of row total.
The sections below highlight additional information about non-roadway, non-motor vehicle events resulting in injuries to bicyclists. The following four categories of bicycle injury events are examined:
The tables provide information on variable-level distributions within each of these four injury event categories (i.e., column percentages). In some cases figures are included to supplement information contained in the tables. The figures generally examine the distribution of bicycle injury event types within levels of a particular variable (i.e, what would be row percentages in the tables). Figures are also used when the variable contains one primary level of interest (percentage wearing a helmet, percentage involving alcohol, etc.). All tables and figures are based on variable distributions with missing values excluded. Of the 1,066 bicycle event cases documented in table 7,152 or 14 percent occurred in an unknown location, leaving 914 cases available for analysis. Tables with totals of less than 914 reflect missing information for the particular variable examined. For example, table 8 on bicyclist age is based on a total of 901 cases, because there were 13 cases that also had missing age information. The remainder of this chapter is divided into sections that examine the characteristics of the bicyclists (age, gender, etc.), the locations and times of their crashes, and the injuries that resulted.
Bicyclist CharacteristicsTable 8 provides information on the ages of bicyclists involved in each of the four major categories of bicycle injury events. Young children are overrepresented in bicycle-only events, especially those occurring in non-roadway locations: 39 percent of all non-roadway bicycle-only events involved children under 10 years of age, compared to less than 10 percent for bicycle-motor vehicle events occurring on the roadway. In contrast, bicycle collisions with motor vehicles were especially likely to involve adult riders: approximately 45 percent of bicyclists struck by motor vehicles were adults ages 25 or above. Table 8. Age distribution of bicyclists by type of injury event.
1 Percentage of column total. 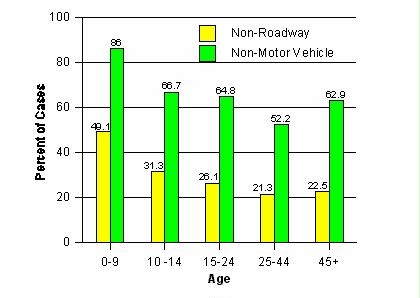
Figure 3. Percentage of bicyclists injured in non-roadway locations or in events not involving a motor vehicle, by age of bicyclist. Examining the data within age categories (figure 3), nearly half of the children under age 10 and a third of the children ages 10-14 were injured in non-roadway locations. The overwhelming majority of these events did not involve a motor vehicle. For adult bicyclists, the percentages of non-roadway and non-motor vehicle events were lower. Information on bicyclist gender is presented in table 9 and in figure 4. Males comprised about 82 percent of the bicyclists involved in collisions with motor vehicles and 72 percent of those involved in bicycle-only events. These percentages are not affected by the location of the injury event with respect to the roadway. Figure 4 shows that just over a third (35 percent) of the bicycle injury events for females, and just under a third (30 percent) for males, occurred in non-roadway locations. Females were also more likely than males to be injured in bicycle-only events (75 percent compared to 64 percent). Table 9. Gender distribution of bicyclists by type of injury event.
1 Percentage of column total. 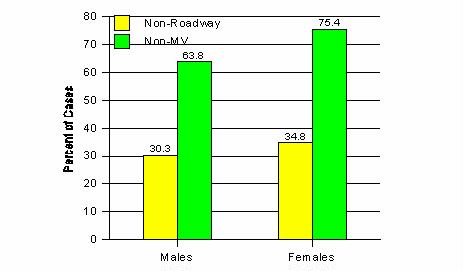
Figure 4. Percentage of bicyclists injured in non-roadway locations or in events not involving a motor vehicle, by gender of bicyclist. Table 10 contains information on the race of the injured bicyclists. Bicyclists of White or Caucasian background comprised just over half of those injured in bicycle-motor vehicle collisions occurring on the roadway, but nearly three-fourths of both collision and bicycle-only events occurring in non-roadway locations. Nearly a third (30 percent) of the bicyclists injured in motor vehicle collisions occurring on the roadway were Black, and an additional 15 percent were Hispanic. Although it is not possible without adequate exposure data to draw conclusions about overrepresentation of minority populations in specific categories of bicycle-motor vehicle events, it is clear from these data that Black and Hispanic bicyclists are at a higher risk for bicycle-motor vehicle collisions occurring on the roadway, compared to the other types of bicycle injury events. Related to this, figure 5 shows that only a little over half (54 percent) of the injuries to non-White bicyclists did not involve a motor vehicle, compared to 73 percent for White bicyclists. Similarly, non-Whites were less likely to be injured in non-roadway events than were Whites, 22 percent versus 36 percent. Table 10. Race distribution of bicyclists by type of injury event.
1 Percentage of column total. Figure 6 presents information on helmet usage by the injured bicyclists. Actual use rates may be higher, since approximately 20 percent of the cases were reported as unknown and these were not subtracted from the totals. Interestingly, the figure shows that helmet use was highest (35 percent) for bicyclists involved in non-collision, non-roadway events. To some extent, the differences in helmet-wearing rates shown in the figure reflect higher percentages of children involved in non-roadway events, coupled with their generally higher helmet-wearing rates. Still, usage was higher for bicyclists injured in non-roadway locations for children as well as for adults: 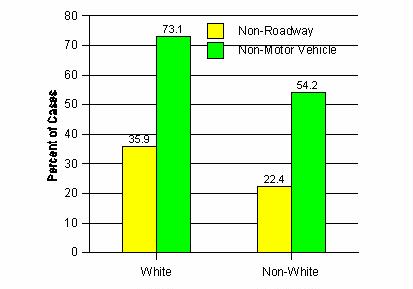
Figure 5. Percentage of bicyclists injured in non-roadway locations or in events not involving a motor vehicle, by race of bicyclist.
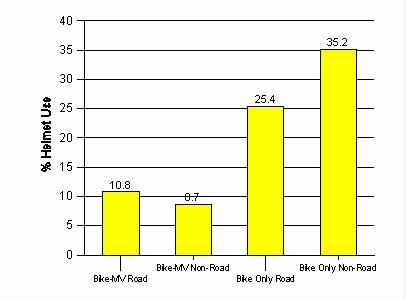
Figure 6. Percentage of bicyclists wearing a helmet by type of bicyclist injury event.
Finally, figure 7 shows that bicyclists involved in either collision or non-collision events occurring on the roadway were more likely to have positive test results for alcohol or to be presumed impaired by alcohol. The overall reported frequency of alcohol use was approximately 10 percent for bicyclists struck on the roadway and 3 percent for bicyclists struck in non-roadway locations. Actual levels are likely to be higher, since these percentages are calculated with a substantial number of unknown cases included in the totals. More detailed information on alcohol use for bicyclists as well as pedestrians is presented in chapter 5. 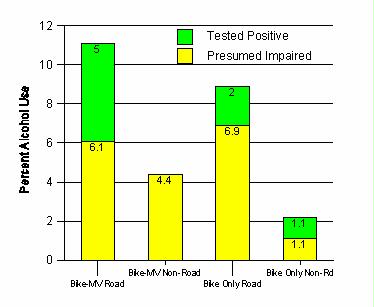
Figure 7. Percentage of bicyclists reported using alcohol by type of bicycle injury event.
Detailed Location and Event CharacteristicsIn table 7, it was shown that 8 percent of the bicycle-motor vehicle events and 43 percent of the bicycle-only events occurred in non-roadway locations. Table 11 identifies the specific locations where these non-roadway events occurred. Fifteen of the 23 non-roadway bicycle-motor vehicle collisions, or 65 percent, occurred on sidewalks. These typically involved a motor vehicle pulling out of or into a driveway or parking area and crossing over a sidewalk. Most of the remaining non-roadway bicycle-motor vehicle collisions occurred in commercial or other types of parking lots (26 percent). Table 11. Detailed location of bicycle collisions and falls occurring in non-roadway locations.
1 Percentage of column total. For the much larger number of non-roadway events that did not involve a motor vehicle, half occurred on sidewalks and 22 percent on off-road trails. The remainder occurred in private or public driveways (9 percent); parks, playgrounds, or other places of recreation (7 percent); and parking lots (6 percent). In addition to the event types shown in the table, there were 28 incidences of bicycle-bicycle collisions and 21 pedestrian-bicycle collisions. Two-thirds of the bicycle-bicycle collisions occurred on the roadway, and most of the remaining collisions occurred on trails or sidewalks. In contrast, only 40 percent of the pedestrian-bicycle collisions occurred on the roadway, with the remaining 60 percent on sidewalks. The specific locations of non-roadway bicycle injury events varied for different ages of riders. For the 23 events where a motor vehicle was involved, sidewalk locations predominated for both males and females and for riders under age 15. For riders ages 15 and above, parking lot and trail sites were as frequent as sidewalks. For bicyclists injured in non-roadway bicycle-only events, table 12 shows that sidewalks again predominated for the youngest two age groups. However, half of all non-roadway bicycle-only events that involved riders ages 15 and above occurred on off-road trails or in park locations. Table 12. Detailed location distribution of non-roadway bicycle-only crashes, by age categories.
1 Percentage of column total. Certainly, young children are much more likely than adults to ride their bicycles on sidewalks, and adults, in turn, may be more likely to ride in parking lots or on off-road trails. Without adequate exposure data, it is again not possible to draw conclusions from the available emergency department data regarding the specific risks associated with bicycling in the various off-road locations identified. Information on the time of day when the various injury events occurred can be found in table 13. The most frequently cited 4-hour time period is 2-6 p.m., followed by 6-10 p.m. More than two-thirds of the bicycle injury events occurred during these hours. There are only slight variations among the different categories of bicycle injury events. Roadway events are more likely to occur late at night, after 10 p.m., than are non-roadway events. This finding may simply reflect higher nighttime riding exposure on lighted roadways than on unlit paths or trails, as well as fewer children riding at nighttime. And even though only about 6 percent of bicycle collisions and falls occur late at night, this figure itself may represent an increased risk associated with nighttime riding. The few bicycle-motor vehicle collisions occurring in non-roadway locations were overrepresented in the morning and midday time periods, from 6 a.m.-2 p.m. Table 13. Time-of-day distribution by type of injury event.
1 Percentage of column total.
Injury CharacteristicsTable 14 presents information on the disposition of the bicycle injury cases reported by the eight participating hospital emergency departments. Overall, 84 percent of the bicyclists were treated and released and 13 percent were hospitalized. This latter percentage is higher than reported elsewhere for emergency department samples of injured bicyclists (see, for example, Baker et al., 1993). Table 14. Emergency department disposition of bicyclists by type of injury event.
1 Percentage of column total. Corresponding figure 8 shows that, among those bicyclists treated and released at the eight hospital emergency departments participating in the study, 71 percent were injured in bicycle- only events. Even among those hospitalized, 42 percent were injured in bicycle-only events, and thus would be unlikely to be reported on State motor vehicle crash files. 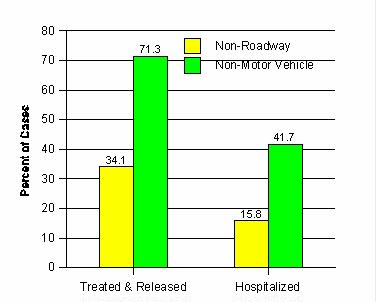
Figure 8. Percentage of non-roadway or non-motor vehicle cases among injured bicyclists who were treated and released and among those hospitalized. Two codes were used to describe the injuries sustained by the bicyclists treated at the participating hospital emergency departments. One identified the location of the injury (head, face or neck, chest, etc.) and the other the type of injury (laceration, contusion, fracture, etc.). (See second page of data collection form in Appendix A.) Up to five injuries were coded for each case. The data were examined both in terms of the percentage of bicyclists with a given injury type or location, and the percentage of all injuries of a particular type and/or location. For example, 28 percent of all bicyclists suffered one or more injuries to the head, but only 14 percent of all the injuries suffered by all the bicyclists were to the head. Altogether, the 1,066 bicyclists included in the database sustained 1,692 injuries. Table 15 shows the percentage of bicyclists with one or more injuries in each of the eight body locations identified on the data collection form. Overall, the most frequently injured body locations were the upper and lower limbs (46 percent and 37 percent of all bicyclists, respectively), face or neck (28 percent), and head (22 percent). Bicyclists injured in collisions with motor vehicles were twice as likely to receive lower limb injuries than were those injured in bicycle-only events, and bicyclists struck on the roadway were especially susceptible to injuries to the head and trunk area (including chest, back, and abdomen/pelvis/lower back). These injury patterns probably resulted from the higher speeds of the motorist and bicyclist. The location patterns of injuries resulting from bicycle-only events are virtually the same regardless of whether the event occurred on or off the roadway. Table 15. Percentage of bicyclists with one or more injuries in specified locations.
Similar information for the types of injuries is contained in table 16. Nearly a third of the bicyclists suffered lacerations or contusions, and 29 percent had one or more broken bones. Differences were again greater between motor vehicle versus non-motor vehicle events than between roadway and non-roadway events. Injuries resulting from collisions with motor vehicles were more likely to involve contusions, sprains or strains, and intracranial and other internal injuries compared with bicycle-only events; they were also less likely to involve lacerations or other open wounds. The likelihood of sustaining a fracture, however, was between 25 and 30 percent for all four populations of bicyclists, regardless of where or how they were injured.
Table 16. Percentage of bicyclists with one or more injuries of specified types.
The final table in this section (table 17) combines information on injury location and type to highlight the most frequently cited injuries for each category of bicyclist. The percentages shown are based on the percentage of all injuries experienced by bicyclists in the event type group, rather than the percentage of bicyclists in the group experiencing a particular injury. Thus, although table 15 showed that 55 percent of bicyclists struck by motor vehicles on the roadway suffered a lower limb injury, table 17 reports that only 29 percent of all injuries to this group of bicyclists were lower limb injuries. Within this category of lower limb injuries, 32 percent were contusions, 22 percent fractures, 20 percent superficial injuries, etc. The column labeled "% All" presents the percentage of all injuries of a specific location and type combination. In a cross-tabulation of injury location by injury type, it is the "cell frequency." It also reflects the probability of the particular location and type combination. For example, if 29 percent of all injuries are to the lower limbs, and 32 percent of these are fractures, then the probability of a fractured lower limb is .29 × .32 = .0928, or 9 percent.
Table 17. Most frequent injuries for each type of bicycle event, categorized by injury location and type.
1 Percentage of all injuries occurring to bicyclists in that injury type group. Table 17 shows that the most common injuries for bicyclists struck by motor vehicles were lower limb contusions and fractures. In contrast, the most common injuries to bicyclists injured in bicycle-only events were upper limb fractures followed by lacerations to the face and neck areas. Bicyclists struck by motor vehicles and those injured in bicycle-only events in the roadway were about equally likely to receive a head injury, including intracranial injuries and concussions (sometimes coded as "head-other"). However, a large proportion of head injuries were the less serious contusions and lacerations. Head and face/neck injuries are not included for the bicycle-motor vehicle, non-roadway category because of the small number of cases and injuries. A final outcome that is not shown in the table, but can be calculated from the cross-tabulations used to generate it, is the average number of injuries per bicyclist (based on the maximum of five injuries coded per case). These results were:
As expected, bicyclists injured in collisions with motor vehicles experienced more injuries, on average, than those injured in non-collision events, and roadway events generally resulted in more injuries than non-roadway events.
Summary of ResultsResults for the bicyclist injury events can be summarized as follows: Overall
Bicyclist Characteristics
Event Characteristics
Injury Characteristics
FHWA-RD-99-078 |
|||||||||||||||||||||||||||||||||||||||||||||||||||||||||||||||||||||||||||||||||||||||||||||||||||||||||||||||||||||||||||||||||||||||||||||||||||||||||||||||||||||||||||||||||||||||||||||||||||||||||||||||||||||||||||||||||||||||||||||||||||||||||||||||||||||||||||||||||||||||||||||||||||||||||||||||||||||||||||||||||||||||||||||||||||||||||||||||||||||||||||||||||||||||||||||||||||||||||||||||||||||||||||||||||||||||||||||||||||||||||||||||||||||||||||||||||||||||||||||||||||||||||||||

