U.S. Department of Transportation
Federal Highway Administration
1200 New Jersey Avenue, SE
Washington, DC 20590
202-366-4000
Federal Highway Administration Research and Technology
Coordinating, Developing, and Delivering Highway Transportation Innovations
 |
| This report is an archived publication and may contain dated technical, contact, and link information |
|
Publication Number: FHWA-RD-99-078
Date: 1999 |
Injuries to Pedestrians and Bicyclists: An Analysis Based on Hospital Emergency Department DataCHAPTER 4. PEDESTRIAN INJURY EVENTS
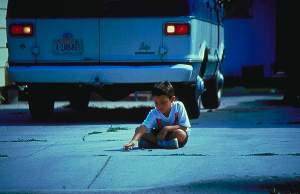
This chapter parallels chapter 3, but focuses on the pedestrian. Information is again derived primarily from cases identified by the eight participating hospital emergency departments, using the data collection form found in appendix A. For the purposes of this study, a pedestrian was defined as a person struck by (or who struck) a motor vehicle, regardless of where the event occurred, or a person injured while walking or otherwise traveling on a public roadway, in a "public vehicular area" (parking lot, public driveway, etc.), or on a transportation-related facility, such as a sidewalk or off-road path generally not open to vehicular traffic. (See case definitions listed in figure 2). The intent was to include pedestrian-only events or falls that were transportation related (e.g., tripping on sidewalks or falling over curbs), while excluding those unrelated to personal transport. Table 18 presents an overall breakdown of the identified cases. Altogether there were a total of 1,443 pedestrians identified, including:
Information on the location of the injury event with respect to the roadway was available for 1,345 cases, or 93 percent of the total. Of these,
As expected, the large majority (88 percent) of pedestrian-motor vehicle collisions occurred on the roadway; however, nearly four out of every five pedestrian-only events occurred on sidewalks, in parking lots, or in other non-roadway locations. The distribution of cases among the various cells of table 18 is affected not only by the reporting definitions adopted for the study, but also by the particular geographic locations where the data were collected. In particular, the three participating hospitals in the Buffalo, New York area reported a high percentage of pedestrian-only events occurring as a result of icy weather and slippery roadway conditions during the winter months of 1995-96. During this time, there were a total of 220 icy weather-related pedestrian incidents, representing over a fourth of all pedestrian Table 18. Distribution of pedestrian injury cases treated in hospital emergency departments by location and type of event.
1 Percentage of row total. incidents reported by the Buffalo area hospitals during the 1-year study period. Only two of these cases involved motor vehicles, and the vast majority, 82 percent, occurred in non-roadway locations. Subtracting these cases from the numbers reported in table 18 would alter the percentages slightly: instead of 36 percent of the cases involving a motor vehicle, 43 percent would involve a motor vehicle, and instead of 47 percent occurring on the roadway, 51 percent would be shown as roadway-related. Given that many U.S. cities experience at least some periods of adverse weather conditions during the winter months, we have opted to retain the "icy weather" cases in the tables presented in this chapter. However, the data were also examined with the icy weather cases omitted, and where significant differences emerged (primarily in the pedestrian-only, non-roadway events), these have been noted in the text. As in chapter 3, the tables present column percentages that highlight the distribution of variables within four major categories of pedestrian injury events:
Thus, the tables provide information on, for example, the age distribution of pedestrians struck by motor vehicles on the roadway, which can be compared to the age distributions for the other pedestrian event types. Where a figure is included along with a table, it is generally to highlight the distribution of pedestrian injury event types within levels of a variable (i.e., row percents). An example would be the percentage of pedestrian injury events to children ages 0-4 occurring in non-roadway locations. All tables and figures are based on the total available cases with missing values excluded from the percentages.
Pedestrian CharacteristicsTable 19 provides information on the ages of pedestrians treated at the participating hospital emergency departments. Overall, nearly a third (30 percent) were children under the age of 15. Children in this age group made up an even larger share of those struck by motor vehicles--39 percent of those struck on the roadway, and 37 percent of those struck in a non-roadway location. Children under 5 years of age were especially overrepresented in non-roadway motor vehicle collisions. Older adults, in contrast, were overrepresented in pedestrian-only events occurring in non-roadway locations: 38 percent of these events involved adults in the 45-64 or 65+ age groups. For the 45- to 64-year-olds, more than 40 percent of their non-roadway falls occurred in icy weather conditions. With these cases subtracted from the table, the 45-64 age group would no longer be overrepresented in non-roadway pedestrian-only events. The oldest pedestrians, age 65+, would remain overrepresented in non-roadway pedestrian-only events even with the icy weather incidents removed. Table 19. Age distribution of pedestrians by type of injury event.
1 Percentage of column total. Figure 9 highlights information on the significance of non-roadway and non-motor vehicle events for pedestrians in each of the seven identified age groups. In general, non-roadway and non-motor vehicle events increased in importance with age. Whereas less than half of the injuries to pedestrians under 10 years of age occurred in a non-roadway location and/or did not involve a motor vehicle, these event types characterized approximately three-fourths of the incidents for adults in the 45-64 and 65+ age groups. With icy weather cases omitted, the same general trends held, although actual percentages of non-roadway and non-motor vehicle events were lower, especially in the upper age groups. 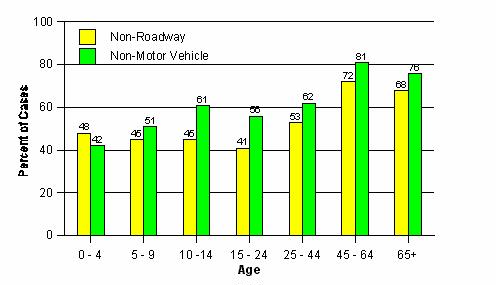
Figure 9. Percentage of pedestrians injured in non-roadway locations in events not involving a motor vehicle, by age of pedestrian. Gender information is presented in table 20. Overall, as pedestrians, males and females were about equally likely to be injured. However, collisions involving motor vehicles and pedestrian-only events occurring on the roadway were more likely to involve males, whereas pedestrian-only events occurring in non-roadway locations were more likely to involve females. Nearly two-thirds of the pedestrians struck by motor vehicles in the roadway were male. Figure 10, depicting the data within gender categories, shows that females were more likely to be involved in both non-roadway and non-motor vehicle events than were males. Approximately two-thirds of females were injured in non-roadway and/or non-motor vehicle events, compared to only about half of the males. Although the percentage of non-roadway and pedestrian-only events were reduced when icy weather condition cases were omitted from the tables, the observed patterns with respect to gender remained essentially the same. Table 20. Gender distribution of pedestrians by type of injury event.
1 Percentage of column total. 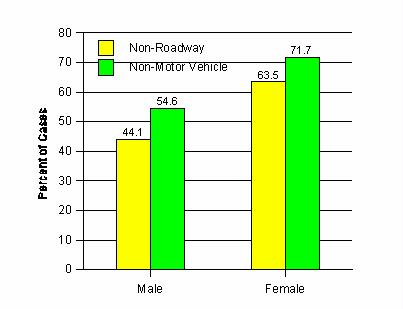
Figure 10. Percentage of pedestrians injured in non-roadway locations or in events not involving a motor vehicle, by gender of pedestrian. Table 21, with information on race, shows that as was the case with bicyclists, minority populations were overrepresented in pedestrian-motor vehicle collisions occurring on the roadway. Blacks and Hispanics together comprised more than half (51 percent) of these victims. Whites, on the other hand, comprised only 45 percent of those struck by motor vehicles on the roadway; however, they represented three-fourths of those injured in pedestrian-only events. Figure 11 confirms these results, showing that Whites were more than one-and-a-half times as likely to be injured in non-roadway and non-motor vehicle events as non-Whites. Table 21. Race distribution of pedestrians by type of injury event.
1 Percentage of column total. 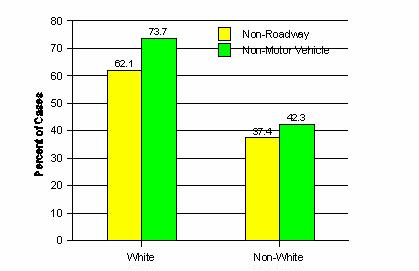
Figure 11. Percentage of pedestrians injured in non-roadway locations or in events not involving a motor vehicle, by race of pedestrian. Information on alcohol use is shown graphically in figure 12. Overall, approximately 10 percent of the injured pedestrians treated in the hospital emergency departments either tested positive for alcohol or were not tested but presumed to be impaired. For pedestrians injured in motor vehicle collisions occurring on the roadway, this percentage increased to nearly 15 percent. These percentages probably underestimate the level of alcohol use in adults, since children and those with unknown use are included in the totals. More detailed information on the role of alcohol in pedestrian injury events, including additional breakdowns by age and gender, are contained in chapter 5. 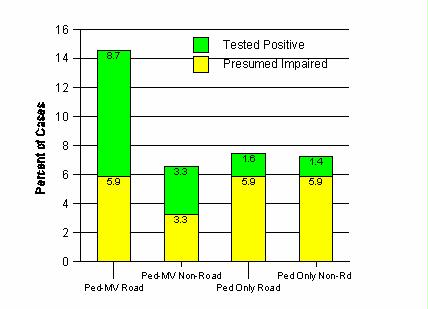
Figure 12. Percentage of pedestrians reported using alcohol by type of pedestrian injury event. Finally, not all of the reported pedestrian events involved persons engaged in such typical pedestrian activities as crossing a roadway or walking on a sidewalk. Some involved the use of special equipment such as in-line skates, skateboards, or wheelchairs. This was especially true of the pedestrian-only events. Table 22 shows that, of the 188 pedestrian-only events reported as occurring on the roadway, one-fourth involved a pedestrian using in-line skates, and an additional 5 percent involved persons on skateboards. For those injured in falls in non-roadway locations, the corresponding percentages were 12 percent for in-line skates and 3 percent for skateboards. Persons in wheelchairs were involved in less than 1 percent of the events overall, and there was only one case cited that involved a pedestrian pushing a baby stroller. Incidents involving a bicycle (either a regular adult bicycle, child's bicycle, or adult tricycle) primarily resulted from a pedestrian being struck while walking alongside his or her own bicycle, or from the pedestrian tripping and falling while pushing or walking/running alongside a child on a bike. Table 22. Pedestrian use of special equipment by event type.
1 Percentage of column total.
Event CharacteristicsTable 23 provides information about the detailed location where non-roadway pedestrian events occurred. More than half (55 percent) of the non-roadway pedestrian-motor vehicle collisions occurred in parking lots (commercial, residential, or other); most of the remaining events occurred either in private driveways/yards (22 percent) or on sidewalks (12 percent). In general, adults age 15 and above were more likely to be struck in parking lots, while children under the age of 15 were more likely to be struck in driveways (table 24). For the much greater number of non-roadway pedestrian-only events, sidewalk locations predominated (58 percent), followed by the various categories of parking lots (25 percent) (table 23). Table 25, with information by age groups, shows that sidewalk locations were particularly common for children under 15 years of age and for senior adults age 65+. For persons ages 15-64, sidewalk locations still predominated, but parking lot locations increased in importance. Nearly half of these parking lot events occurred under icy weather conditions, compared to one out of five for the sidewalk events. Table 23. Detailed location of pedestrian collisions and falls occurring in non-roadway locations.
1Percentage of column total. Time-of-day information is contained in table 26. As was the case with bicycles, the greatest percentage of cases occurred in the 2-6 p.m. and 6-10 p.m. time periods, with a smaller peak from 10 a.m.-2 p.m. For pedestrian-motor vehicle collisions occurring on the roadway, more than a third occurred between 2 and 6 p.m. and an additional 29 percent between 6 and 10 p.m. Compared to roadway events, non-roadway events were more likely to occur earlier in the day, from 10 a.m.-2 p.m. Pedestrian-only events were somewhat overrepresented in the early morning hours, from 6-10 a.m. Otherwise, there were only small differences in time-of-day distributions among the various injury event categories. Although only about 8 percent of pedestrian-motor vehicle collisions occurred late at night, from 10 p.m.-2 a.m., this percentage probably represents an overrepresentation compared to their exposure. Without adequate exposure data, however, no definitive conclusions can be drawn regarding actual risk levels. Table 24. Detailed location distribution of non-roadway pedestrian- motor vehicle crashes, by age categories.
1 Percentage of column total.
Table 25. Detailed location distribution of non-roadway pedestrian-only crashes, by age categories.
1 Percentage of column total.
Table 26. Time-of-day distribution by type of pedestrian injury event.
1 Percentage of column total.
Injury CharacteristicsTable 27 contains information on the disposition of the pedestrians treated at the participating hospital emergency departments. Fifteen of the 1,336 pedestrians, or just over 1 percent, were killed. All of these cases involved pedestrians who were struck by a motor vehicle, and all but one occurred on the roadway. Since emergency departments usually do not capture cases where someone dies at the scene of a crash, this percentage does not reflect the true mortality associated with pedestrian injury events. In addition to those killed, nearly one out of five injured pedestrians (19 percent) were admitted to the hospital for further treatment or observation. Not surprisingly, however, this percentage was much higher for pedestrians struck by motor vehicles: nearly 40 percent of pedestrians struck on the roadway were hospitalized, as well as 30 percent of those struck on a sidewalk, in a parking lot, or at another non-roadway location. Figure 13, however, shows that of all pedestrians treated and released from the participating hospital emergency departments, nearly three-fourths (73 percent) were injured in pedestrian-only events and more than 60 percent in non-roadway events. Even among those hospitalized, nearly a fourth were injured in non-motor vehicle or non-roadway events. Table 27. Emergency department disposition of pedestrians by type of injury event.
1 Percentage of column total. Tables 28 and 29 present information on the locations and types of injuries sustained by the pedestrians receiving emergency department treatment. As described in the previous chapter on bicyclists, up to five injuries were coded for each patient, each identified by a location code (head, chest, upper limb, etc.) and a type code (laceration, contusion, fracture, etc.). Tables 28 and 29 report on the number and percentage of pedestrians having one or more injury locations or types. Since patients could have multiple injuries, the column percents total more than 100 percent. Table 28, with information on injury locations, shows that half (50 percent) of the emergency department patients were treated for lower limb injuries and one-third (33 percent) for upper limb injuries. Lower limb injuries were more common for pedestrians struck by motor vehicles, while upper limb injuries were more common for those injured in pedestrian-only events or falls. Pedestrians struck by a motor vehicle on the roadway also experienced higher rates of injuries to the head, face and neck, and abdomen/pelvis/lower back area. Except for lower percentages of head and face/neck injuries, pedestrians struck by motor vehicles in non-roadway locations experienced injury location frequencies similar to their counterparts who had been struck on the roadway. Likewise, injury patterns were similar for persons injured in pedestrian-only events on the roadway and persons injured in pedestrian-only events in non-roadway locations. Table 28. Percentage of pedestrians with one or more injuries in specified locations.
Table 29. Percentage of pedestrians with one or more injuries of specified types.
More pedestrians suffered fractures (37 percent) than any other single injury type (table 29). Following fractures in order of frequency were contusions (33 percent of pedestrians), sprains or strains (20 percent), and lacerations or other open wounds (18 percent). Pedestrians injured in motor vehicle collisions on the roadway had the highest rate of fractures as well as intracranial (head) injuries. Fractures were also the most frequent outcome, however, for pedestrians injured in pedestrian-only events, followed closely by sprains and strains. As was the case for injury location, motor vehicle involvement appears to play a stronger role in determining the types of injuries that result than does the location of the event with respect to the roadway. In other words, injuries that result from pedestrian-motor vehicle events that occur on the roadway are more similar to injuries that result from pedestrian-motor vehicle events that occur in a non-roadway location than they are to pedestrian-only events, and vice versa. Finally, table 30 highlights the most frequently cited injuries for each category of injured pedestrian. As in its counterpart table in chapter 3, the percentages in the table are based on the percentage of all injuries experienced, rather than the percentage of pedestrians experiencing a particular injury. As an example, in table 28, 34 percent of all pedestrians struck by a vehicle on the roadway were shown to have incurred an injury to the head; however, in table 30, we see that only 19 percent of all injuries to these same pedestrians were to the head. The "% All" column again shows the percentage of all injuries of a specific location and type combination. (See parallel section in chapter 3 for a more detailed explanation.) Table 30 shows that, by far, the most common injury types were fractures, contusions, and sprains/strains of the lower leg. Upper limb fractures were also very common for pedestrian-only events (in the Buffalo area, many of these were "slips on ice"). Injuries to the head included a mix of intracranial injuries, contusions, lacerations, and "other" injuries (which could include milder concussions). In general, head and face/neck injuries for pedestrians injured in pedestrian-only events were limited to lacerations, contusions, and more superficial injuries, whereas those occurring to pedestrians struck on the roadway also included fractures (e.g., skull or neck vertebra fractures) and intracranial injuries. From the cross-tabulations produced to generate table 30, the following average numbers of injuries per event type were calculated:
The results show the expected higher number of injuries for pedestrians struck by motor vehicles, especially those struck on the roadway. Table 30. Most frequent injuries for each type of pedestrian event, categorized by injury location and type.
1Percent of all injuries occurring to pedestrians in that injury-type group.
Summary of ResultsResults for the pedestrian injury events can be summarized as follows: Overall
Pedestrian Characteristics
Event Characteristics
Injury Characteristics
FHWA-RD-99-078 |
||||||||||||||||||||||||||||||||||||||||||||||||||||||||||||||||||||||||||||||||||||||||||||||||||||||||||||||||||||||||||||||||||||||||||||||||||||||||||||||||||||||||||||||||||||||||||||||||||||||||||||||||||||||||||||||||||||||||||||||||||||||||||||||||||||||||||||||||||||||||||||||||||||||||||||||||||||||||||||||||||||||||||||||||||||||||||||||||||||||||||||||||||||||||||||||||||||||||||||||||||||||||||||||||||||||||||||||||||||||||||||||||||||||||||||||||||||||||||||||||||||||||||||||||||||||||||||||||||||||||||||||||||||||||||||||||||||||||||||||||||||||||||||||||||||||||||||||||||||||||||||||||||||||||||||||||||||||||||||||||

