U.S. Department of Transportation
Federal Highway Administration
1200 New Jersey Avenue, SE
Washington, DC 20590
202-366-4000
Federal Highway Administration Research and Technology
Coordinating, Developing, and Delivering Highway Transportation Innovations
|
Research & Technology Transporter This newsletter is an archived publication and may contain dated technical, contact, and link information. |
|
| Publication Number: N/A Date: December 2002 |
Publication Date: December 2002
|
Traffic engineers and planners typically use traditional traffic analysis tools, either simulation or planning models, to assess the effectiveness of transportation projects and make decisions on implementation. Most current planning tools rely on static input data. These tools are incapable of addressing both operational and planning issues together in a dynamic transportation environment, particularly in the intelligent transportation systems (ITS) context.
Traffic analysis planning tools that use only static data instead of addressing the dynamic nature of the traffic phenomena soon will be a thing of the past, thanks to new software developed for the Federal Highway Administration (FHWA). DYNASMART-P is the next step in the evolution of traffic-modeling software, using dynamic input data to model the evolution of traffic flow in a system. The results are more accurate than those from previous models, enabling planners and engineers to make more informed decisions about an area's transportation needs and implementation of technologies to enhance mobility and safety.
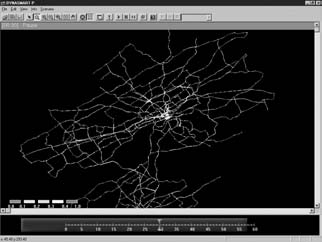 |
| DYNASMART-P can model complex traffic networks, such as the one shown in this screen capture. |
Developed under FHWA's Dynamic Traffic Assignment research project, DYNASMART-P is one of the two prototypes developed for transportation planners responsible for ITS strategies, traffic engineers interested in dynamic control strategies, and researchers exploring advanced traffic flow theory and emerging traffic surveillance technologies. Similar tools are available privately, but most of those are prohibitively expensive.
DYNASMART-P uses dynamic network assignment models and traffic simulation models to represent network and traffic flows. The input data vary with the network being analyzed but could include travel demand (origin-destination) data, traffic control and management data, and network geometry information. The software can analyze networks of varying complexity, from a linear freeway network to an integrated network with high-occupancy vehicle (HOV) and high-occupancy toll (HOT) lanes, ramp metering, and transit services.
The program produces an output report containing a wide range of measures of performance such as traffic volumes, densities, speeds, and travel times and delays. The program also generates vehicle trajectory files and animated graphics displays, enabling users to conduct detailed analyses and to view the simulation results.
Potential applications of DYNASMART-P include:
To ensure that DYNASMART-P meets user needs, FHWA currently is beta testing the software and is looking for agencies interested in participating. After the testing is complete, FHWA will refine the program and release it to the public.
Henry Lieu 202-493-3273 henry.lieu@fhwa.dot.gov
In 1998, the Nation's transportation system handled an estimated 15 billion tons of cargo, valued at $9 trillion. Highway systems alone moved 71 percent of this total tonnage. By 2020, trucks are expected to transport 75 percent more cargo than they do today-a total of more than 19 billion tons. The smooth flow of freight in the United States and across U.S. borders is vital to the Nation's economy.
To help facilitate this flow and reduce roadway congestion, the Federal Highway Administration (FHWA) developed the Freight Analysis Framework (FAF)-a policy analysis tool to help State and local governments and the private sector better manage and plan for growing freight movement across the country. Released in October 2002 by FHWA, the Federal Railroad Administration, Federal Maritime Administration, Bureau of Transportation Statistics, and the U.S. Department of Transportation's Office of Intermodalism, FAF presents estimated truck movements over the Nation's roadways, as well as shipments by rail, water, and air.
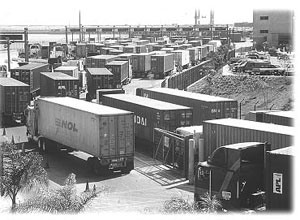 |
| These trucks waiting in line at a freight terminal are typical of the congestion that is only expected to worsen in coming years. |
FAF is a comprehensive database that examines current and future geographic relationships between freight movement and infrastructure capacity for both domestic and international trade flows. FAF's mapping and other graphic capabilities can convey areas of freight congestion by mode, commodity, and capacity for the years 1998, 2010, and 2020. FAF also includes economic forecasts for 2010 and 2020, which can be used to evaluate the effect of expected freight volumes on the transportation network.
FAF also is designed to help decisionmakers determine which transportation corridors are or will become more heavily congested, to help local governments choose the appropriate congestion mitigation strategies, including developing targeted multistate or regional approaches to improving freight operations.
"You can't do good planning and make good decisions unless you have good facts," says Suzanne Gad, administrator for the Office of Urban and Corridor Planning at the Ohio Department of Transportation. "The Freight Analysis Framework has enabled us to select projects and set priorities based on the most cutting-edge information on current and future freight movement in America."
For more information, visit the Office of Freight Management and Operations at http://www.ops.fhwa.dot.gov/freight/freight_analysis/faf/index.htm.
Bruce Lambert
More than 20 percent of fatal crashes take place at intersections, and in 2001 alone, approximately 1.5 million injuries occurred. There are a number of improvements to consider when planning intersection safety. One option is to build turn lanes; however, does this actually make intersections safer and is it quantifiable?
A new Federal Highway Administration (FHWA) TechBrief, "Safety Effectiveness of Intersection Left- and Right-Turn Lanes," presents the results of research on the safety effectiveness of providing left- and right-turn lanes for at-grade intersections.
To perform the study, researchers selected three types of sites-improved or treatment sites, comparison sites, and reference sites-to study in eight States. The improved or treatment sites are intersections where a left- or right-turn lane was added and for which intersection geometric, traffic volume, and traffic crash data were available for time frames before and after the improvement. For 260 of the 280 improved intersections, the researchers selected a matching comparison site that was not improved during the study period. In addition, they selected 40 reference sites, which were both unimproved and not matched to any particular improved site.
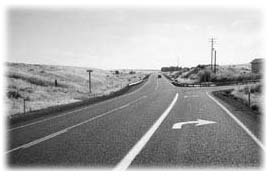 |
| A right-turn lane was installed at the unsignalized intersection shown above. Source: Midwest Research Institute |
The researchers collected traffic volume data for both the major- and minor-road legs and evaluated traffic records for all crashes that occurred within 76 meters (250 feet) of each intersection that were related to the presence of the intersection. Based on this work, the TechBrief presents results for installing left-turn lanes on the major-road approaches to rural intersections and for installing right-turn lanes on the major-road approaches to rural and urban intersections. To calculate benefit-cost ratios and cost-effectiveness thresholds for intersection improvements, researchers conducted economic evaluations of the installation of left-turn lanes at various types of intersections.
| Intersection Type | Intersection Traffic Control | Number of Major-Road Approaches Where Left-Turn Lanes are Installed | |
|---|---|---|---|
| One Approach % Reduction | Both Approach % Reduction | ||
| Three-Leg Intersections | Stop Sign | 33 | |
| Traffic signal | 7 | ||
| Four-Leg Intersections | Stop Sign | 27 | 47 |
| Traffic signal | 10 | 19 | |
The table above shows the expected percentage reduction in total crashes for installation of left-turn lanes on major-road approaches to urban intersections.
Source: FHWA TechBrief FHWA-RD-02-103
The full research report is available at www.fhwa.dot.gov/publications/research/safety/02089/index.cfm .
Michael Griffith
Finite element analysis (FEA) is a cost-effective tool for developing new and improved roadside safety hardware. Until recently, it was difficult to locate the data necessary for developing certain FEA models, such as the force characteristics of truck suspension systems. The private sector had conducted its own tests, but the results generally were unavailable to researchers outside individual companies.
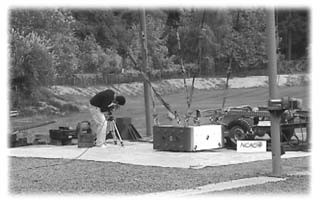
To satisfy the need for such data, the Federal Highway Administration (FHWA) recently completed a series of pendulum tests at the Federal Outdoor Impact Laboratory (FOIL). The tests, which simulate the effect of a pickup truck colliding with roadside hardware, will enable FHWA to improve the FEA models under development at the National Crash Analysis Center.
The test article was the steel frame of a C-1500 pickup truck with the wheels, suspension, and steering gear left in place. The researchers placed it in a specially designed fixture so that it could be mounted in three different orientations. They used a pendulum nose consisting of a rectangular steel plate mounted on a 2,000-kilogram (4,400-pound) concrete block to study crash impacts on the tires and suspension. During the tests, the researchers used a cable and electric winch to pull the pendulum nose back into a tower. Upon release, the pendulum nose swung down in an arc and hit one of the pickup's front or rear tires.
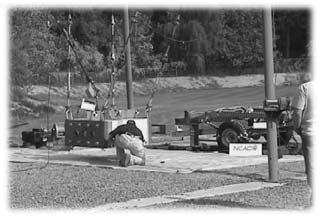
In the suspension tests, the researchers recorded the articulation and deformation of the front suspension using three high-speed video cameras. In a second set of suspension tests, the pendulum nose first hit the bottom and then the side of a rear wheel. They also conducted static pull tests on the steering system components.
Although the vehicle suspension tests were a first for FHWA, the agency anticipates conducting similar studies in the future. With the tests now complete, the researchers will analyze the data and then incorporate it into the FEA models of the C-1500 and C-2500 pickup trucks. The results will be available through the National Crash Analysis Center Web site at www.ncac.gwu.edu within the next year.
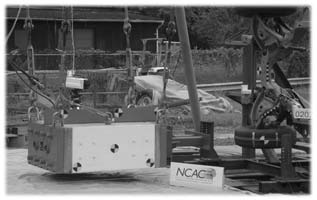 |
| The pendulum is shown in its fixed location prior to being swung towards the pickup truck. |
 |
| A researcher makes adjustments to a high-speed video camera before conducting a side impact test of a pickup truck wheel assembly. |
 |
| A researcher mounts photographic equipment on the side of the pendulum nose. |
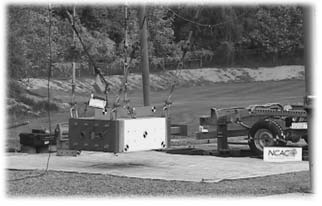 |
| The pendulum nose swings toward the side of the pickup truck wheel. |
Charles McDevitt
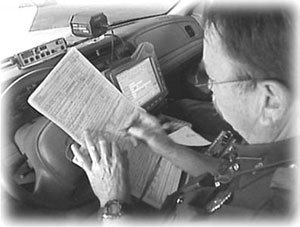
Crashes cause approximately 3 million injuries and claim about 42,000 lives each year. Each incident offers a learning opportunity-the chance to collect data that researchers can use to understand why crashes occur and prevent them in the future. Law enforcement officers often arrive first at the scene and are responsible for capturing the crash-related data that are so essential for advancing safety research. Providing necessary attention to the crash victims can distract officers from fulfilling this vital role once the immediate emergency is over.
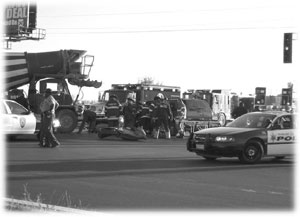 |
| Law enforcement officials, often the first to arrive at a crash scene, are shown responding to a motorcycle incident. |
To provide officers additional training on their role as data collectors, the Federal Highway Administration (FHWA) sponsored the production of a new video, "Safety Starts with Crash Data." The video has a comprehensive 15-minute segment that is useful during formal training on crash investigations and an 8-minute summary for use at roll calls and during basic and unit training. The video emphasizes the role of law enforcement officers in improving highway safety through thorough crash scene investigations and submission of accurate, complete, and timely crash reports.
"The role of law enforcement officers is paramount to addressing safety issues," says Richard Stuart, highway safety specialist at the National Highway Traffic Safety Administration (NHTSA). "The public benefits directly from the accurate and efficient reporting and sharing of crash data, since [the information] can point us to issues that need to be addressed at particular sites and help identify trends and patterns in crashes."
 |
| A police officer fills out a crash report, a task essential to the researchers that examine crash data. |
In May 2002, staff from FHWA's Office of Safety and Southern Resource Center partnered with the International Association of Chiefs of Police, the National Sheriffs' Association, NHTSA, and the Federal Motor Carrier Safety Administration (FMCSA) to develop the video.
The video made its official debut in Florida at the 2002 International Forum on Traffic Records and Highway Information Systems, sponsored in part by FHWA, NHTSA, FMCSA, the National Safety Council, and the Bureau of Transportation Statistics. During fall 2002, FHWA distributed the video to more than 10,000 law enforcement agencies.
For more information, contact:
David Smith 202-366-6614 david.smith@fhwa.dot.gov
Why did the chicken (bear, butterfly, or any other animal) cross the road? The answer, most likely, is because it had no other way to get to the other side. As urban sprawl continues to expand, the transportation systems built to serve the new growth can affect existing wildlife populations, their natural habitats, and migration patterns.
Recently, the Federal Highway Administration (FHWA), in cooperation with the American Association of State Highway and Transportation Officials and the National Cooperative Highway Research Program, visited Europe on an international technology scan to learn how agencies across the Atlantic address wildlife-transportation issues. The interdisciplinary delegation of Federal, State, and conservation group representatives visited France, Germany, the Netherlands, Slovenia, and Switzerland, all of which have been successful at reducing the impacts of transportation on wildlife species and their habitats by using innovative approaches.
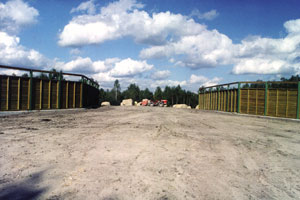 |
| Board fences are used at this habitat overpass to reduce road noise and lights. Rocks are placed at the ends to prevent vehicular use. The deck of the overpass will be backfilled and planted with vegetation to match adjacent natural habitat. |
The Netherlands has a nationwide habitat connectivity plan. Scientists in Switzerland have completed geographic information system-based identification of wildlife habitats and corridors. In France, researchers found that wildlife signage, reflectors, and vehicle-mounted whistles are ineffective, so fencing, culverts, underpasses and overpasses, and viaducts are used instead. In addition to these innovations, all of the countries use green bridges or similar viaduct systems to enable animals to cross over or under roadways. France was the first country to construct green bridges, although Germany now has the most facilities of this kind. Fencing around transportation projects also is common.
After the scan, the team developed recommendations for improving connectivity in the United States:
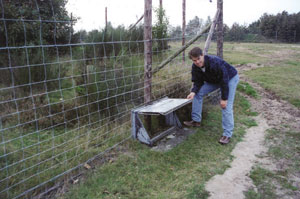 |
| If small mammals become trapped on the highway right-of-way, they can use a one-way door and exit to safety through this fence near a Dutch overpass. |
The strategies observed during the European scan provide effective, alternative means for ensuring that people and animals can get where they want to go and do so safely. Scan tours like this one are beneficial because they introduce U.S. officials to the strategies that other countries use to solve transportation problems and often lead to significant transportation advancements in the United States. For additional information about this scan, see the recently released report, "Wildlife Habitat Connectivity Across European Highways." The report is available online at http://international.fhwa.dot.gov/Pdfs/wildlife_web.pdf.
Fred Bank 202-366-5004 fred.bank@fhwa.dot.gov
Kentucky and Perm, a region of Russia located 800 miles east of Moscow, face very similar transportation issues, such as increasing traffic demands and highway maintenance needs, operating with limited transportation funding, and supporting comparable population sizes. Recognizing an opportunity to learn from one another, transportation officials from Kentucky and Perm have developed a unique working relationship over the past 2 years, which led to an invitation for the officials from Kentucky to visit their counterparts in Perm. In May 2002, a delegation of transportation officials from the Kentucky Transportation Cabinet traveled to Russia to share information and exchange transportation technologies.
During the trip, the U.S. delegation visited various construction projects, including a tunneling project, an eight-bridge construction site, a precast concrete facility, and a construction site where a bridge is being built across the Kama River.
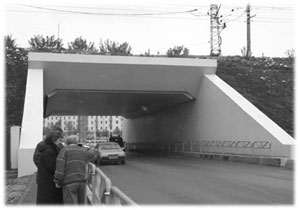 |
| One of the most innovative projects seen in Perm is a car tunnel, seen here, that passes beneath a rail line. |
"The most exciting project we saw was a tunnel for vehicle traffic that is being constructed through a railroad embankment," says Kevin Sandefur, transportation engineering specialist with the Kentucky Transportation Cabinet. "The project design and tunneling methods ensure that train traffic is not disrupted during construction and vehicular traffic will not be disrupted once the project is complete."
Other findings and lessons learned during the visit include:
The U.S. delegates noted that our Nation could use some of the innovative techniques and methods seen in Perm, particularly those at the railroad-roadway tunneling project, to improve bridge and roadway construction in the United States. The trip represented a chance to gain a better understanding of the construction methods and design features used in each country and further strengthen the relationship between Kentucky and Perm.
Tracy Busch
Pedestrian and bicyclist fatalities account for approximately 15 percent of all roadway-related fatalities each year. To raise awareness of the importance of accommodating nonmotorized traffic in roadway design, the Federal Highway Administration's (FHWA) National Highway Institute (NHI) added two new courses to its catalog, Bicycle Facility Design (#142046A) and Pedestrian Facility Design (#142045A). Both courses are directly linked to transportation accessibility, safety, and design issues.
In the Bicycle Facility Design course, participants learn to identify common roadway and traffic conditions that affect bicyclists, describe the characteristics of roadways with shared-use paths, and recognize opportunities to accommodate bicyclists during the planning, design, construction, and operational phases of a project.
NHI developed the Pedestrian Facility Design course to provide information and application opportunities for designers of pedestrian facilities. Upon completing the course, attendees will be able to identify potential conflicts between pedestrians and other traffic and propose design options that improve access and safety.
For more information, contact NHI Training Program Manager Mila Plosky at 703-235-0527 or mila.plosky@fhwa.dot.gov. For scheduling information, call 703-235-0528 or e-mail nhi.scheduler@fhwa.dot.gov.
Leslie Wright leslie.wright@fhwa.dot.gov

