U.S. Department of Transportation
Federal Highway Administration
1200 New Jersey Avenue, SE
Washington, DC 20590
202-366-4000
Visualization
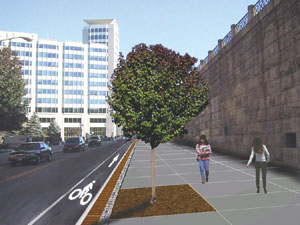
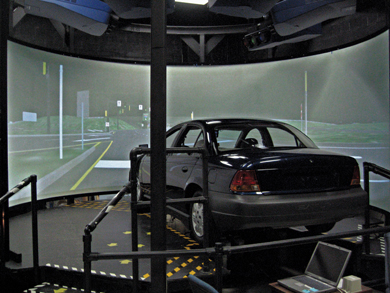
New technologies involving visualization have changed the communication process and the tools that are available to transportation professionals to transmit and display information. The old adage, "a picture is worth a thousand words," conveys how transportation professionals can use visual imagery to provide information instantly or make it clear and understandable to the public or to decision makers. Visualization can be used for proposed policies, plans, designs, improvement programs, research, training, and innovation delivery.
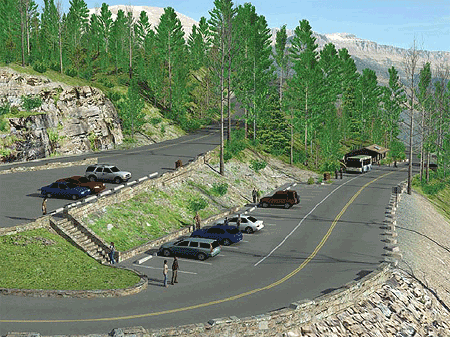
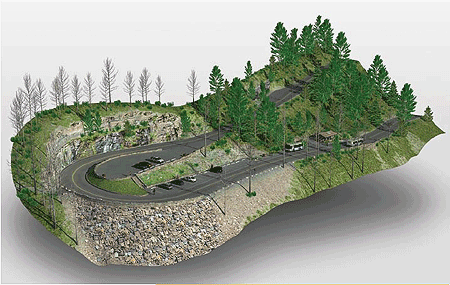
Examples of visualization techniques include sketches, drawings, artist renderings, physical models and maps, simulated photos, videos, computer-modeled images, interactive geographic information systems (GIS), GIS-based scenario planning tools, photo manipulations, and computer simulations.
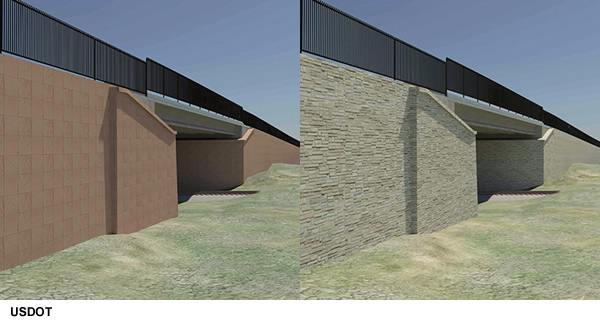
The applications in transportation research, design, construction, and maintenance are seemingly endless. For example, visualization is used to incorporate field measurements, design standards, optional features, conditional scenarios, and other considerations to create three-dimensional imaging that illustrates how roadway and bridge designs look once completed. Additionally, computer modeling and statistical analyses are used to test different roadway safety countermeasures or to build computer simulation models, which can be used by researchers to demonstrate visually various roadway design solutions. Additionally, impacts to the environment, costs, and aesthetics can be conveyed and studied to facilitate better decisionmaking throughout the transportation process.
The Federal Highway Administration (FHWA) Visualization Working Group (VWG) was created to investigate applications and opportunities for the use of visualization techniques in highway project development, delivery, and analysis. The VWG’s efforts were bolstered by specific language in The Safe, Accountable, Flexible, Efficient Transportation Equity Act: A Legacy for Users (SAFTEA-LU) and further solidified in the recent Moving Ahead for Progress in the 21st Century Act (MAP-21). Specifically, MAP-21 calls for an increased use of innovative project delivery methods, including three-dimensional (3D) modeling techniques, as well as the use of visualization techniques to support project approval and oversight. Some areas of emphasis include 3D modeling, techniques to promote effective public participation, enhanced project details, increased safety, accelerated construction, and reduced congestion. Visualization applications will play an integral role in supporting these initiatives. As a result, the FHWA’s VWG will continue to provide leadership and advocate for visualization and innovative data analysis and to promote initiatives to advance the practice and application of these rapidly maturing and powerful tools in the transportation industry.
