U.S. Department of Transportation
Federal Highway Administration
1200 New Jersey Avenue, SE
Washington, DC 20590
202-366-4000
California Division

OBJECTIVE: Trade studies compare the relative merits of alternative approaches, and so ensure that the most cost-effective system is developed. They maintain traceability of design decisions back to fundamental requirements. Trade studies do this by comparing alternatives at various levels for the system being developed. They may be applied to concept, design, implementation, verification, support, and other areas. They provide a documented, analytical rationale for choices made in system development. |
DESCRIPTION: Trade studies can be used in various phases and at different depths throughout the project to select from alternatives or to understand the impact of a decision. The inputs vary depending on what is being analyzed. For example, in concept exploration, the alternatives will be concepts. While, in the design phase, they will be design alternatives. The stakeholders are essential here to define and rate the criteria and to validate the results. The analysis may be done qualitatively, or by a model or simulation. |
CONTEXT OF PROCESS:
TRADE STUDIES PROCESS |
Inputs: These inputs will be used only as available. Project Goals and Objectives drive the selection of alternatives for concepts. User needs and Concept of Operations drive the selection of alternatives for requirements. Requirements and High Level Design drive the selection of alternatives for design elements. |
Control: SEMP and Project Plan constrain what may be developed, and define budget and schedule. |
Enablers: Stakeholder involvement provides the key metrics and may suggest alternatives. Risk assessment evaluates each alternative relative to risk, balanced against effectiveness. Technical reviews present the results and gather inputs and feedback. |
Outputs: Selection of the best of the alternatives, whether for concept, requirements, design, or implementation, provides a choice based on solid analysis. Rationale is the documentation of the alternatives compared, the criteria for selection, the analysis methodology, and the conclusions. |
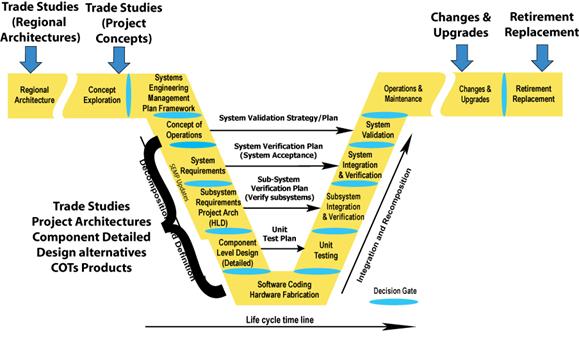
Process Activities: Define the decisions to be made First, define the question the trade study is to answer. This may be the selection of the most cost-effective concept or design. It may be to narrow down choices for more detailed evaluation. It may be to demonstrate that the choice made is the best one. Define criteria Experienced specialists will draw from the available inputs to identify the key evaluation criteria for the decision under consideration. These are measures of effectiveness, metrics that compare how well alternatives meet the needs and requirements. Examples are capacity [vehicles per hour], response time, throughput, and expandability. Define weightings Generally, there are multiple criteria, and so these same experts will assign each of them a relative weighting for relative importance. Identify alternatives Trade study starts with alternative concepts or designs that are to be evaluated. Be sure that all reasonable alternatives are on the table. Evaluate performance Generally, the emphasis is on performance criteria such as speed or effectiveness. For each alternative, the criteria may be evaluated quantitatively or qualitatively, and by such methods as simulation, performance data gathered from similar systems, surveys, and engineering judgment. These disparate evaluations are merged using the weighting factors to give a measure of overall effectiveness for each choice. Assess cost, risk, and schedule Estimate the cost of each alternative: the development cost and the life cycle cost, which includes operation and maintenance. Use the techniques of risk assessment [see Chapter 3.9.4] to compare the alternatives relative to technical or project risk. Determine the impact of each alternative on the schedule. Eliminate those that introduce too much risk of missing deadlines. Analyze alternatives Sensitivity analysis may also be used, especially with simulation, to see the effect of changes in sub-system parameters on overall system performance. The sensitivity analysis and the evaluations may suggest other, better alternatives. Select and document the preferred candidate Plotting each alternative's [concept or design] overall effectiveness, based on the combined weighted metrics, against cost, or the other factors, is useful for evaluating the relative merits of each. It supports stakeholders in making a good decision. Document the decision and the rationale behind it, to provide traceability back to the higher-level requirements. This document is also a repository of alternatives, in case a change is needed down the road. |
Where do trade studies take place in the project timeline? |
Is there a policy or standard that talks about Trade Studies?
FHWA Final Rule requires the analysis of system configurations to meet requirements.
Which activities are critical for the system’s owner to do?
How do I fit these activities to my project? [Tailoring]
The level of each activity should be appropriately scaled to the size of the project and the importance of the issue being traded off. For example, a small project will use qualitative measures and compare a small number of alternatives, and sensitivity analysis. For example, an upgrade to a signal system will trade off features based on stakeholder priorities. A large project may use simulation to analyze key issues and perform sensitivity analysis.
What should I track in this process step to reduce project risks, and get what is expected? [Metrics]
On the technical side:
These metrics check whether the set of alternatives is possibly driving a risky solution
On the Project management side:
Checklist: Are all the bases covered?
Has a broad and reasonable selection of alternatives been examined?
Does the rationale for the trade study conclusions flow out of the needs and requirements?
Is the sensitivity of system effectiveness to changes in key parameters well understood?
Is the selection rationale documented?
Are there any other recommendations that can help?
Trade studies should make maximum use of any previous work, but if nothing applicable is available, it will need to include more technical analysis. Often the two methods are combined by using analysis to predict system performance based on that of other systems. For example, well-documented improvements in traffic flow experienced when another agency implemented ramp metering could be combined with local data to predict the potential impact of a local ramp metering system.
Simulation and modeling are tools which provide an objective, quantitative comparison of the merits of the alternatives. They may, for example, predict the effectiveness of each alternative in an operational scenario. These can range from a simple spreadsheet to a full traffic simulation.
A closer look at combining metrics There are usually multiple metrics for evaluating the system based on the various needs that the system is to meet. Generally, they are a mix of positive metrics [more is better such as highway capacity] and negative metrics [less is better such as response time]. They also include both quantitative [e.g., predicted vehicle hours of delay] and qualitative values e.g., [relative rating from 1 to 10]. The units can vary as follows:
It requires care to combine these into some measure of overall system technical measure, without giving undue weight to one or the other. Chapter 3.9.5 gives a method for doing this.
Making qualitative measures quantitative Often time and available information do not allow a direct quantitative assessment. For example, the design of a regional Advanced Transportation Information System [ATIS] focuses on the key information needs of a large number of agencies in the region. There was very little time to do this prioritization, but there were dozens of documents that the agencies had produced discussing their needs. The approach used was to draw out, from documents, any needs cited. Some agencies listed their "top ten" information needs in rank order. These were assigned 1 to 10 points, depending on their place in the list, 10 being best. If a need was cited without ranking it relative to other needs, it was given a medium rating of 5 points. The total points for any need were then given a metric indicating how many agencies needed the particular information, and how strongly they felt about it.
If workshops are held to collect stakeholders’ preferences, here is a simple way to get their inputs on alternatives. First, discuss the alternatives and their pros and cons. Then, list them on a flipchart and give each participant a few colored adhesive dots. Be sure each participant gets the same number of dots, about 10 – 20% of the number of alternatives. Allow each participant to place their dots next to the choices that they favor, even placing multiple dots against a choice that they particularly like. The number of dots is a metric for stakeholder preference. This type of metric could be used to compare alternatives directly or to determine relative weights for multiple metrics.
Sensitivity analysis Simulation, or other analytical tools, can be used to vary design parameters over their potential values and predict the effect on performance. The "knee of the curve" shows where more stringent design requirements give little system improvement.
In the example chart, the knee of the curve occurs around 15 to 20 for the design parameter [horizontal axis]. There is very little performance improvement [vertical axis] from a more stringent design. Sensitivity analysis can also be done in multiple dimensions to determine, for example, whether money should be spent on improving communications or detectors.
Estimating costs for alternatives There is an art to predicting the cost of a new system. A life cycle cost analyst can do it by extrapolating from existing systems. Qualitative assessments are often sufficient. Examples are high/medium/low, in cost or difficulty to implement. Plotting effectiveness versus cost would support the decision.