| Conditions and Performance
Chapter Listing
Conditions and
Performance Home Page
Introduction
Summary
Road
Conditions
Bridge
Conditions
Transit
System Conditions
|
Bridge Deficiencies
The more common indicator used to evaluate the condition of our Nation's
bridges is the number of deficient bridges. There are two types of deficient
bridges: structurally deficient and functionally obsolete.
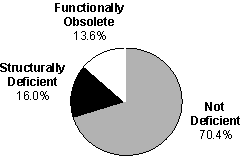
Exhibit 3-20 shows that in 1998 29.6 percent of our Nation's bridges
were deficient. Of these deficient bridges, 16.0 percent of bridges were
structurally deficient while 13.6 percent were functionally obsolete.
| Exhibit 3-20 |
| Deficiencies, All
Bridges, 1998 |
 |
| Q How are
"structurally deficient" and "functionally obsolete"
bridges defined? |
| A Bridges are structurally
deficient if they have been restricted to light vehicles, require immediate
rehabilitation to remain open, or are closed. Bridges are functionally obsolete
if they have deck geometry, load carrying capacity, clearance or approach
roadway alignment that no longer meet the criteria for the system of which the
bridge is a part. |
| Q Are all deficient bridges
unsafe to cross? |
| A No. A deficient bridge is
not necessarily unsafe or one that requires special posting for speed or weight
limitations. It does require significant maintenance, rehabilitation, or
sometimes replacement. Some of these bridges are posted and may require trucks
over a certain weight to take a longer route. For further information on the
status of bridges, please refer to The Status of the Nation's Highway
Bridges: Highway Bridge Replacement and Rehabilitation Program and National
Bridge Inventory, Report to Congress dated May 1997. |
| Q How do recent deficient
bridge data compare with the FHWA Strategic Plan target for deficient bridges
in 2008? |
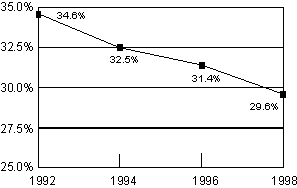
| A The Federal Highway
Administration 1998 Strategic Plan stated that by 2008, less than
25 percent of our bridges should be classified as deficient. As Exhibit
3-21 illustrates, the percent of deficient bridges has been declining in recent
years, from 34.6 percent in 1992 to 29.6 percent in 1998. The Strategic
Plan also established a target for bridges on the NHS which is discussed in
further detail in Appendix B. |
| Exhibit 3-21 |
| Percentage of Deficient Bridges,
1992-1998 |
 |
|