U.S. Department of Transportation
Federal Highway Administration
1200 New Jersey Avenue, SE
Washington, DC 20590
202-366-4000
| Conditions and Performance Report Chapter 3—System Conditions |
| Conditions and Performance Chapter Listing Conditions and Performance Home Page
|
|
| Exhibit 3-31 |
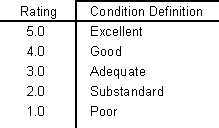
| Bus Fleet Condition
Ratings Description |
 |
| Source: Transit Economic
Requirements Model (TERM). |
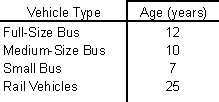
| Exhibit 3-32 |
| FTA Minimum-Useful Life Guidelines |
 |
The ratings shown here differ from those found in the 1997 Report in two
significant ways:
—Estimated conditions are uniformly lower than reported in prior reports
—Average conditions for each asset type do not change as significantly over time
Both of these features are primarily due to the updated relationship between bus vehicle condition and age determined by the National Bus Condition Assessment (Appendix I). The lower ratings result from the more rapid decline in asset condition that is exhibited by the new curves, and the more stable time series reflects in part the long period of slow decay.
The estimated average condition of the urban bus fleet in 1997 is 3.1, or adequate. This represents a slight improvement over the level of 3.0, which was attained in each of the previous 9 years. Conditions for large, articulated buses have declined over the previous decade, from 3.1 to 2.7, while conditions of vans have increased from 3.2 to 3.5.
Exhibit 3-33. Urban Transit Bus Fleet Count, Age and Condition, 1987-1997
This improvement in conditions reflects the slight change in average vehicle age over the decade from 7.5 years to 6.6 years. Decreases in the average ages of vans and small and mid-sized buses have been partially offset by the significant aging of the articulated bus fleet, where the average age has increased from 4.9 to 11.8 years, and over 60 percent of these vehicles can be considered overage.
Note that the corresponding decay has not been nearly as dramatic, however, due to the relatively flat decay curve in the range from 5 to 12 years.
| Q Why was the average bus condition level for 1995 and prior years revised downward? |
| A The revision reflects the improvement in the modeling of bus conditions that resulted from the 1999 National Bus Condition Assessment. See Appendix I for a description of this change in modeling procedure. |
The average age of full-size buses, by far the most numerous bus type, is the same as it was in 1987 (8.2 years), but has decreased since 1994. Accordingly, the average condition of this predominant type remains at 3.0.