U.S. Department of Transportation
Federal Highway Administration
1200 New Jersey Avenue, SE
Washington, DC 20590
202-366-4000
Federal Highway Administration Research and Technology
Coordinating, Developing, and Delivering Highway Transportation Innovations
| REPORT |
| This report is an archived publication and may contain dated technical, contact, and link information |
|
| Publication Number: FHWA-HRT-12-068 Date: December 2012 |
Publication Number: FHWA-HRT-12-068 Date: December 2012 |
This appendix provides findings from traditional profile analyses applied to the LTPP SPS-2 site in Arizona. These tools helped study roughness, roughness distribution, and roughness progression of each section, including concentrated roughness-linked pavement distress. The analyses included viewing filtered elevation profile plots, roughness profiles, and power spectral density (PSD) plots. Sayers provides tutorial demonstrations of these methods.(15, 16) Karamihas and Senn applied them to other SPS sites in Arizona. (See references 3–7.)
This appendix discusses observations pertinent to IRI but only on those sections where the analyses yielded noteworthy observations. Section 0213 exhibited several features of interest and is used to provide detailed examples of phenomena that appeared on other sections.
A simple way to learn about the type of roughness that exists within a profile is to view the trace. However, key details of the profile are often not as obvious in a raw profile trace as they may be after the profile is filtered. Figure 47 shows the right-side profile of section 0213 from visit 03 (27-Jan-1997). Several features are evident from this plot, but they are much more obvious when plotted with filters.
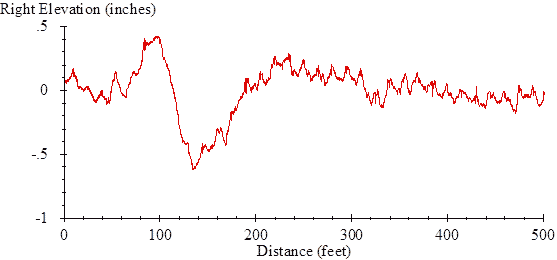 |
| Figure 47. Graph. Raw Profile from Visit 03 of Right Side of Section 0213. |
Figure 48 through figure 50 show the profile from figure 47 after application of various moving average filters. Each of the filters helps examine a distinct feature of the roughness on section 0213.
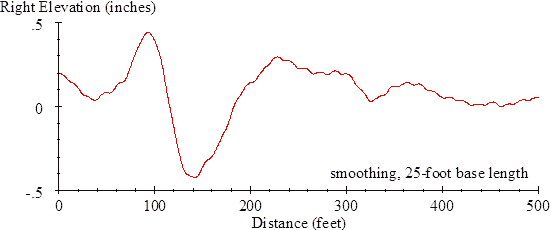 |
| Figure 48. Graph. Profile with Smoothing from Visit 03 of Right Side of Section 0213. |
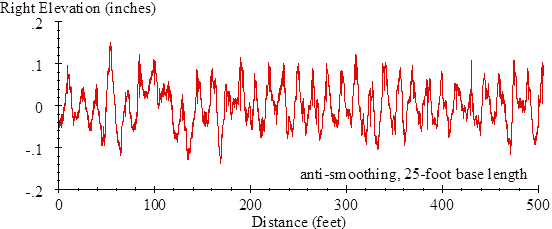 |
| Figure 49. Graph. Profile with Anti-Smoothing from Visit 03 of Right Side of Section 0213. |
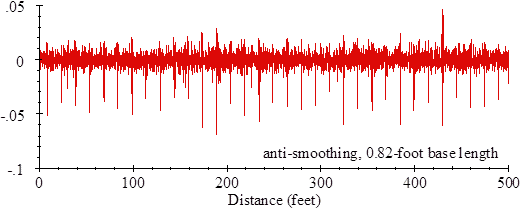 |
| Figure 50. Graph. Profile with Additional Anti-Smoothing from Visit 03 of Right Side of Section 0213. |
Figure 48 shows the profile after application of a smoothing filter with a base length of 25 ft. The filter greatly reduces the contribution of deviations that occur over 25 ft and shorter but preserves the trend. This plot shows a long bump followed by a long dip within the profile. This feature appears on both the left and right profiles throughout the monitoring history of section 0213, and it consistently contributes to the overall IRI of the section. Together, the bump and dip make up a feature so long that the native filters applied to the profile during measurement affect their shape, although the native filters preserve the roughness that most affects IRI. For example, the largest change in this plot occurred between visit 08 (8-Nov-2001) and 09 (30-Oct-2002), when the high-pass filter applied by the profiler had changed.(17)
Figure 49 shows the profile after application of an anti-smoothing filter with a base length of 25 ft. This filter greatly reduces the contribution of deviations that occur over 25 ft and longer, which eliminates the trend and makes the upward curl in the 15-ft-long slabs more obvious.1 In this plot, local peaks appear 15 ft apart, beginning about 9 ft from the start of the section and ending about 489 ft from the start of the section. These peaks represent the joints that surround the 32 slabs. Even though the vertical scale is much smaller in figure 49 than in figure 48, the contribution to IRI is much larger. For example, IRI of the trace in figure 49 is 104.7 inches/mi, and IRI of the trace in figure 48 is 26.6 inches/mi. Although the trace in figure 48 covers a larger vertical scale, the rapid reversals in the trace in figure 49 create greater roughness.
Figure 50 shows the profile after application of an anti-smoothing filter with a base length of 0.82 ft. Again, eliminating the longer wavelength content reduces the vertical range of the plot. This filter eliminates nearly all the content that affects IRI but retains the narrow dips that appear at the joints.
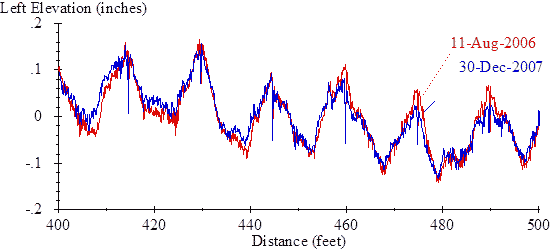
Inspection of filtered elevation profiles showed that upward slab curl existed throughout the monitoring history of section 0213 and that the level of curl was not consistent. Figure 51 shows part of the left-side profile traces from visits 12 (13-Aug-2006) and 13 (30-Dec-2007). The figure shows a distinct set of upwardly curled slabs. The figure also shows that the extent of curling at each slab is greater in visit 12 than in visit 13. The level of curl that appears on a pavement section is determined by a combination of diurnal, seasonal, and long-term effects. However, a change in temperature gradient may explain the difference in the profiles, since visit 12 took place before sunrise and visit 13 took place after sunrise.
 |
| Figure 51. Graph. Changes in Curl on Section 0213. |
Over the 100 ft displayed in figure 51, IRI for visit 12 (13-Aug-2006) was 132.0 inches/mi, and IRI for visit 13 (30-Dec-2007) was 106.0 inches/mi. Over the entire section, the difference in IRI was 25.6 inches/mi, which demonstrates the influence a visually modest change in the curling within a profile can have on the roughness of a pavement section (see figure 10 and figure 11).
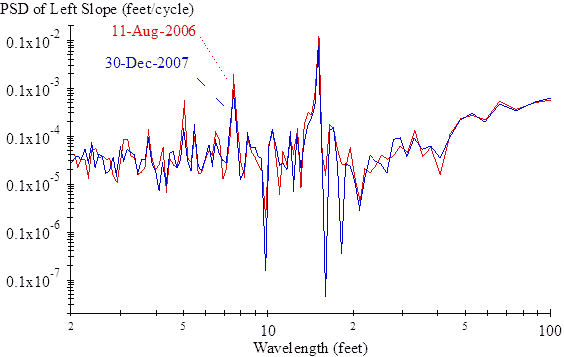
A PSD plot provides an alternative way of comparing the severity of slab curl within a profile. Figure 52 shows a PSD plot for the two profiles in figure 51. The plot is modified to show PSD of profile slope, rather than elevation, and it uses wavelength as the ordinate axis, instead of wave number (the reciprocal of wavelength). The plot displays spectral density in 24 bands per octave (i.e., 24 values for each increase in wavelength by a factor of 2, with uniform spacing along a logarithmic scale). The PSD plots for both visits include peaks at wavelengths of 15, 7.5, and 5 ft. The peak at 15 ft corresponds to the slab length. Additional peaks appear at 7.5 and 5 ft because the slabs do not curl into a sinusoidal profile. Instead, they curl into a shape that breaks down into an infinite series of sine waves that are as long as the slab, half as long, a third as long, and so on.
 |
| Figure 52. Graph. Slope Spectral Density of Section 0213. |
Figure 52 displays the spectral content of the profile in a convenient manner in that values on the ordinate axis map directly to the characteristic length of known pavement features, such as joint spacing. The figure also shows that the influence of curling on variations in profile slope stands out over other profile features. However, the non-standard method of display in figure 52 distorts the relative contribution of each waveband to the overall profile.
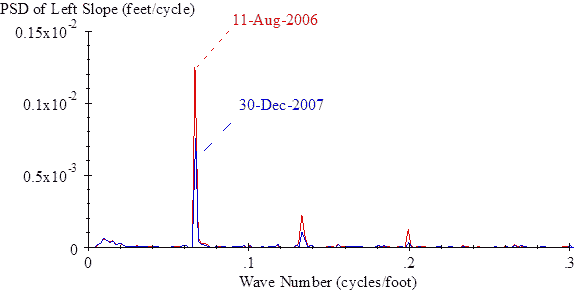
Figure 53 provides a more standard display of PSD. The figure displays both axes on a linear scale and provides spectral density versus wave number. When the plots are displayed in this manner, the area under the curve for any range of wave numbers is proportional to the contribution the range makes to the overall mean square. Over the range that affects IRI, shown in figure 53, slab curl dominates the roughness of the section in both visits. Figure 53 also provides a more representative view of the difference between visit 12 (11-Aug-2006) and visit 13 (30-Dec-2007). At a wave number of 0.066 cycles/ft, which corresponds to a wavelength of 15 ft, the plot for visit 12 has a value of 0.00125 ft/cycle and the plot for visit 13 has a value of 0.00076 ft/cycle. In terms of root mean square, this waveband therefore accounts for 28 percent more roughness in visit 12 than in visit 13.
 |
| Figure 53. Graph. Slope Spectral Density of Section 0213 with Linear Scaling. |
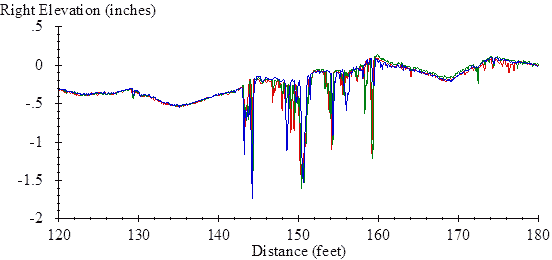
Section 0213 developed distress in the later part of the monitoring history. Starting in visit 12 (11-Aug-2006), narrow dips and groups of densely spaced narrow dips appeared in the right-side profiles. The right-side profiles from visit 12 included narrow dips at 35–47, 143–160, 243–246, 255, and 317–330 ft from the start of the section. These areas correspond to locations where the distress survey showed longitudinal cracking starting in 2004. Starting in 2008, longitudinal cracks appeared either in or near the right wheel path over the first two-thirds of the section. The cracks grew in width from 2008 onward, and some include missing material replaced by asphalt by 2011. Typically, the dips within the profile appear where the cracks wander into the center of the wheel path.
Figure 54 shows three repeat profiles from the right side of section 0213. The area from 143 to 160 ft includes several deep dips. The most severe features in this area appear with the same shape in all three measurements. However, some details of the profiles in this area are not perfectly repeated because they are caused by longitudinal cracks.
 |
| Figure 54. Graph. Right Elevation Profile for Three Repeats from Visit 12 of Section 0213. |
A roughness profile provides a way to quantify the severity of isolated disturbances in a profile, such as the dips shown in figure 54. A roughness profile provides a continuous report of road roughness using a given segment length.(18) Instead of summarizing the roughness by providing IRI for an entire pavement section, the roughness profile shows the details of how IRI varies with distance along the section. It does this by displaying IRI of every possible segment of a given base length along the pavement, using a sliding window. Figure 55 shows the roughness profile using a 25-ft base length for the profiles shown in figure 54. With a 25-ft base length, isolated roughness is easy to identify and the area with the narrow dips stands out as much rougher than the surrounding area. The peak value in this area was about 600–700 inches/mi. Since this 25-ft-long area accounts for one-twentieth of the section length, this area contributes 30–35 inches/mi to the overall IRI of the section for these repeat measurements.
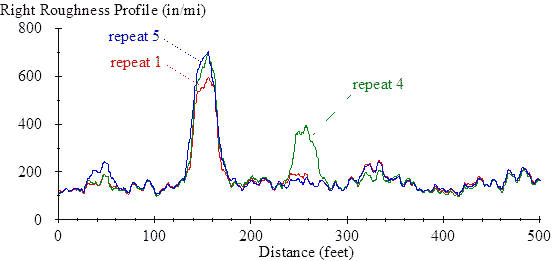 |
| Figure 55. Graph. Right Roughness Profile for Three Repeats from Visit 12 of Section 0213. |
One of the repeat measurements shown in figure 55 also includes an area of higher roughness about 250 ft from the start of the section. This is another patch of dips on a longitudinal crack that only one pass detected due to small variations in the tracking position of the profiler.
Inspection of roughness profiles showed that narrow dips at longitudinal cracks account for much of the increase in roughness after visit 11 (12-Dec-2004), although the dips were less severe overall in visit 13 than in visit 12. By visit 15 (25-Jan-2010), two additional areas of isolated roughness appeared along with the area shown in figure 55.
Section 0214 profiles included evidence of upward curl in early visits. However, the slabs in the first half of the section gradually changed from upward curl to downward curl, and the upward curl in the second half of the section diminished over time. The slabs changed most aggressively between visit 04 (4-Dec-1997) and visit 10 (4-Feb-2004). Figure 56 shows the right-side profile from visit 01 (25-Jan-1994), and figure 57 shows right-side profiles from visit 10 over part of section 0214. In this part of the section, all of the slabs changed from upward to downward curl.
 |
| Figure 56. Graphs. Right Elevation Profiles from Visit 01 of Section 0214. |
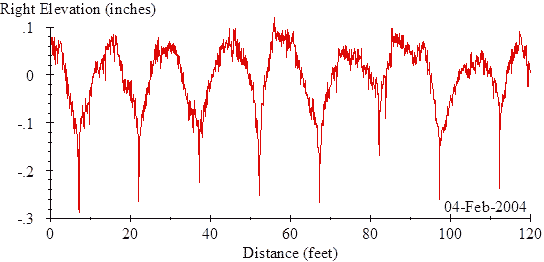 |
| Figure 57. Graphs. Right Elevation Profiles from Visit 10 of Section 0214. |
Distress surveys noted map cracking on the section starting in 1997. The 1997 survey listed low-severity map cracking throughout the section. By 2008, the distress surveys listed high-severity map cracking in the first part of the section and map cracking in the wheel paths throughout the section. The 2008 distress survey also noted a rough transition from asphalt to concrete pavement upstream of section 0214 and proposed that the resulting dynamic loads imposed on section 0214 may have contributed to the cracking. Figure 58 shows the profile leading to section 0214 in visit 09 (30-Oct-2002). The figure shows a distance of 0 ft at the section start. The rough features 60–80 ft upstream of the section would exacerbate truck dynamic loading. However, the role of dynamic loading in causing the map cracking is not clear.
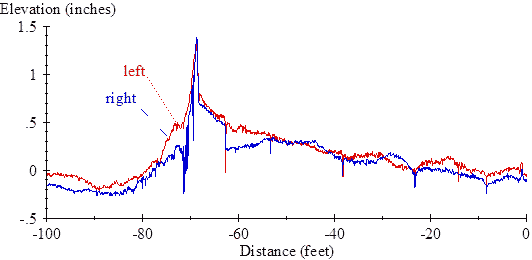 |
| Figure 58. Graph. Profiles Leading to Section 0214. |
Profile data for section 0215 included measurements on 16 additional SMP dates. On those dates, profiles were collected early (typically in the morning) and late (typically in the afternoon). Together with the 15 routine visits, the data include 47 sets of repeat measurements, with measurements every season in 1998 and from winter 2001 through winter 2004. Plotting of filtered profiles and PSD functions revealed that changes in slab curl caused most of the changes in the roughness of section 0215 over time.
Figure 59 shows the PSD plot for profiles measured in visits S05 (9-Jul-1998, 08:45) and S30 (15-Jul-2004, 09:07). The spectral content for these two profiles is very similar. In addition, the roughness level is about equal over the range shown in the figure, except at wavelengths equal to the slab length (15 ft) and half the slab length (7.5 ft). IRI for the earlier profile was 93.6 inches/mi, and IRI for the later profile was 129.4 inches/mi. Figure 59 shows that changes in slab curl caused most of the difference (see figure 12 and figure 13).
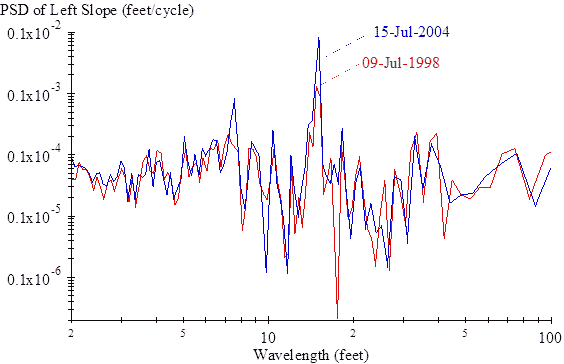 |
| Figure 59. Graph. PSD Plots for Section 0215. |
PSD plots of profiles from the 47 visits showed the following:
No specific observations are provided for section 0216.
The 1997 distress survey recorded longitudinal and transverse cracks, and the level of cracking increased throughout the monitoring period. The 2002 distress survey also listed “map cracking throughout (the) section.”
Narrow dips appeared in both the left and right profiles at positions in the middle third of some slabs starting in visit 09 (30-Oct-2002). The dips appeared in locations where the distress surveys included transverse cracks, although not every transverse crack caused a dip. In visit 15 (25‑Jan‑2010), the most severe dips appeared 30 ft (0–1.3 inches deep), 407 ft (0–0.9 inches deep), 466.5 ft (0–0.15 inches deep), and 481.5 ft (0–0.6 inches deep) from the start of the section in the left-side profiles and 42–45 ft (0–0.7 inches deep), 238 ft (0–0.4 inches deep), 450 ft (0–1.3 inches deep), and 478 ft (0–1.6 inches deep) from the start of the section in the right-side profiles. The construction report listed transverse cracking in the LCB 480 ft from the start of section 0217 but not at the other locations.(1) Inspection of roughness profiles showed that none of the dips caused the short (25-ft)-interval IRI to exceed 2.5 times the section average.
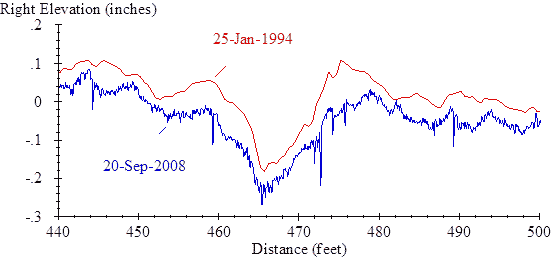
Throughout the monitoring history, one slab along the right side of section 0217 contributed twice as much to the roughness of the section as the others. Figure 60 shows the right-side profiles from visit 01 (25-Jan-1994) and visit 14 (20-Sep-2008). Joints appear within the plot 444.3, 459.2, 474.2, and 489.3 ft from the start of the section. The slab that extends from 459.2 to 474.2 ft has upward curvature that registers as upward curling to an automated curling analysis based solely on slab profile. However, the upward curvature of this slab may have another cause because (1) no other slab on section 0217 exhibited a similar level of curvature, (2) the overall curvature of this profile along this slab did not change significantly with time, and (3) the left side profiles were relatively flat. The cause of the upward curvature cannot be determined without additional information, and the curling analyses presented in this report depend more heavily on changes in slab shape with time than on the nominal profiles.
 |
| Figure 60. Graph. Right Elevation Profiles for Section 0217. |
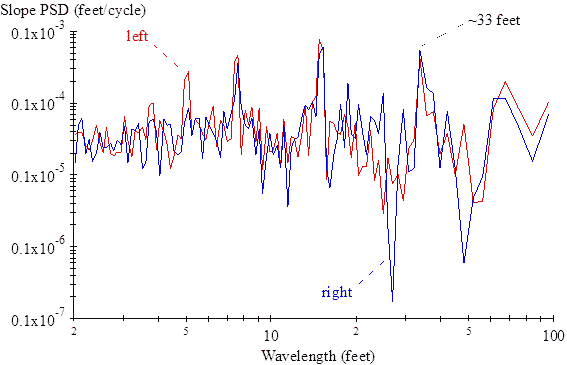
Profiles from section 0217 included noteworthy spectral content not caused by slab curl. Figure 61 shows the PSD plot for the left profile from visit 08 (8-Nov-2001). Slab curl caused the spikes at 15, 7.5, and 5 ft. Another spike appears at about 33 ft that rivals the others in amplitude. The contractor who built the test pavements confirmed that this was the approximate string line stake spacing. Content at this wavelength was strongest on section 0217, but lesser peaks appear in PSD plots from sections 0214, 0215, 0216, 0218, and 0220.
 |
| Figure 61. Graph. PSD Plots from Visit 08 of Section 0217. |
The construction report listed 11 transverse cracks in the LCB within the monitoring range of section 0218.(1) Plotting of filtered profiles revealed no localized roughness and no systematic appearance of cracks in the surface layer.
Transverse cracks appeared in mid-slab positions on section 0219 beginning in 2002 and on about half of the slabs by the end of the monitoring period. The profiles included narrow dips at some of these locations, particularly on the right side, starting in visit 09 (30-Oct-2002). By visit 15 (25-Jan-2010) narrow dips appeared intermittently in the right-side profiles 195 ft (0–0.15 inches deep), 258 ft (0–0.2 inches deep), 316 ft (0–0.9 inches deep), 384 ft (0–0.3 inches deep), 406 ft (0–0.8 inches deep), and 466 ft (0–0.4 inches deep) from the start of the section. Distress surveys also noted map cracking over most of section 0219 by the end of the monitoring period, but the cracking was less obvious in the photos than on other sections.
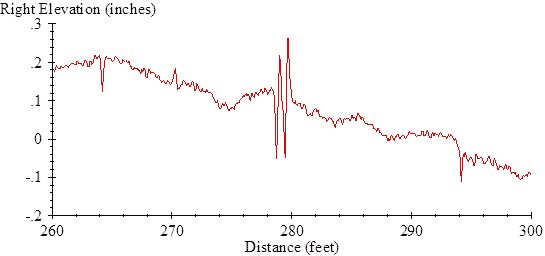
Profiles from visit 04 (4-Dec-1997) included densely spaced positive and negative spikes at some joint locations on section 0220. Figure 62 shows an example. Similar disturbances appeared in the right-side profiles at the joints about 70, 115, 175, 220, 325, 384, 430, and 474 ft from the start of the section. These disturbances typically appeared in only one or two of the repeat measurements in visit 04 and sparingly in profiles from visit 05 (8-Dec-1998) but not in any of the other visits. They did not correspond to anything noted in the distress survey, although a distress survey in 2003 noted seal damage at joints. The construction report listed 13 transverse cracks in the LCB within the monitoring range of section 0220.(1) Plotting of filtered profiles revealed no localized roughness and no systematic appearance of cracks on the surface.
 |
| Figure 62. Graph. Profile from Visit 04 of Section 0220. |
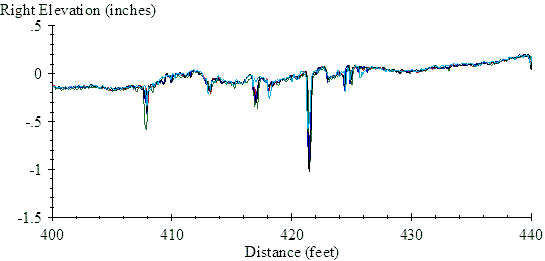
Distress surveys listed distress in the right wheel path of a slab from 410 to 425 ft from the start of section 0221 throughout the monitoring history and distress in neighboring slabs later in the monitoring period. In 1997, the survey noted “severe aggregate loss.” Every survey afterward showed scaling along the right side of that slab, and the survey in 2008 (including the photos) showed fiberglass patching at various locations. Figure 63 shows five repeat measurements of the right-side profile from visit 15 (25-Jan-2010). The dip 421 ft from the start of the section caused localized roughness, and the slab from 410 to 425 ft from the start of the section contributed to IRI 3 times as aggressively as the rest of the section.
 |
| Figure 63. Graph. Right Elevation Profile for Five Repeats from Visit 15 of Section 0221. |
Some profiles from visit 14 (20-Sep-2008) and visit 15 (25-Jan-2010) included a narrow dip up to 0.7 inches deep at a joint 325 ft from the start of section 0222. Nothing in the distress surveys distinguished this joint from the others, and the dips did not increase the roughness of the section.
No specific observations are provided for section 0223.
The left IRI value from visit 10 (4-Feb-2004) on section 0224 was 114 inches/mi. This value stood out because the right IRI was 71 inches/mi, the left IRI from visit 09 (30-Oct-2002) was 84 inches/mi, and the left IRI from visit 11 (12-Dec-2004) was 70 inches/mi (see figure 12). As shown in figure 64, a change in spectral content for wavelengths near 8 ft accounts for most of the difference. Although no other obvious explanation could be found, this content is most likely not caused by changes in slab curl, since it only appears on the left side of the lane. The content within the PSD plot at a 15-ft wavelength was not affected strongly, and the high content for wavelengths near 8 ft is not as concentrated as the upper harmonics caused by slab curl in the PSD plots shown for other sections. Furthermore, the peaks and valleys of the approximately 8‑ft-long waves do not align with the joint locations in a consistent manner.
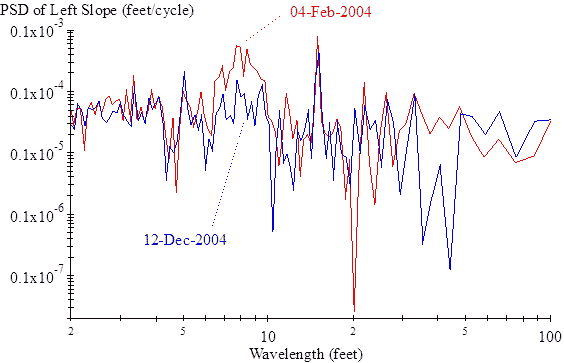 |
| Figure 64. Graph. PSD of Left Slope for Section 0224. |
The distress surveys reported low-severity raveling on section 0260 starting in 1995 and raveling with no severity qualification in both wheel paths starting in 2004. By 2008, the distress surveys reported significant distress in the left wheel path, and the photos showed fatigue, small potholes, patching, and pools of sealant in the left wheel path. The distress increased in severity by 2010, including more visible cracking along the left wheel path. These observations explain the steady rise in IRI of the left wheel path starting 11 years after the experiment began.
Some areas within the profile showed clear evidence of surface distress. For example, the area from 50 to 70 ft from the start of the section often included patches of narrow dips. The dips appeared starting in visit 06 (15-Nov-1999) on the left side and in visit 11 (12-Dec-2004) on the right side. The dips were not well repeated when they first appeared. However, by the end of the monitoring period, the profile over this segment had a consistent shape, which included a narrow dip 0.7 inches deep and a 3-ft-wide dip that was nearly 0.2 inches deep.
A rough area present since construction exists about 350 ft from the start of the section. Figure 65 shows the roughness profile at various ages, starting with the first profiling visit. The plot uses a 25-ft base length. The rough area progressed from a peak value of 118 inches/mi in visit 01 (25‑Jan‑1994) to 735 inches/mi by visit 15 (25-Jan-2010). Since the base length is equal to one-twentieth of the section length, this represents a progression in the contribution to overall IRI of the roughest area from 5.9 inches/mi to more than 36 inches/mi.
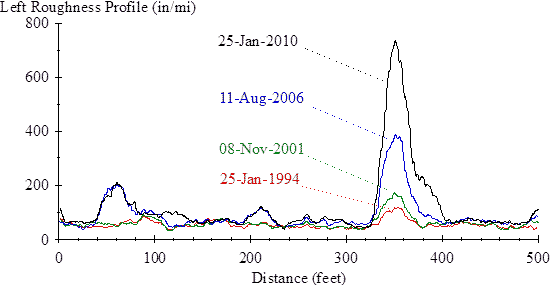 |
| Figure 65. Graph. Left Roughness Profile for Section 0260. |
Figure 66 shows profiles from visits 01 (25-Jan-1994) and 15 (25-Jan-2010). The initial disturbance is visible in the plot, although distress was not recorded there until 2000. However, it is not clear if the initial disturbance caused the roughness to progress by increasing the loading experienced at certain locations (i.e., a hot spot), if the disturbance was evidence of structural defects at that location (i.e., a weak spot), or both. In either case, figure 65 shows that the roughest area within section 0260 at the start of its service life progressed to the roughest area much later in its service life. (The peak value would stand out in the plot from visit 01 if not for the large vertical scale needed to accommodate the roughness in later visits.)
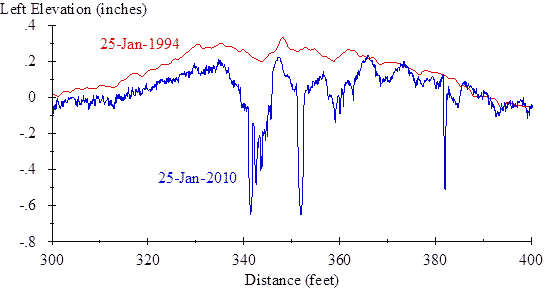 |
| Figure 66. Graph. Left Elevation Profile of a Segment from Section 0260. |
Distress surveys recorded longitudinal cracking in some areas of section 0261 starting in 1997 and transverse cracking at several locations after 2004. Dips appeared as depressions up to 5 ft wide with a narrow dip up to 1 ft wide in the majority of locations where the 2008 (and later) distress surveys showed transverse cracking. These dips appeared in the profiles starting with visit 11 (12-Dec-2004), and they were prominent late in the experiment. The dips exacerbated the roughness progression. Late in the experiment, localized roughness appeared about 325 ft from the start of the section, where a pothole developed.
The 1997 distress survey recorded the presence of six cores along the right wheel path near the end of the section. A longitudinal crack developed along the line of cores. This area was sealed, but the sealant eventually wore off. A series of bumps and dips appeared in the right-side profiles at that location that grew in roughness throughout the monitoring history.
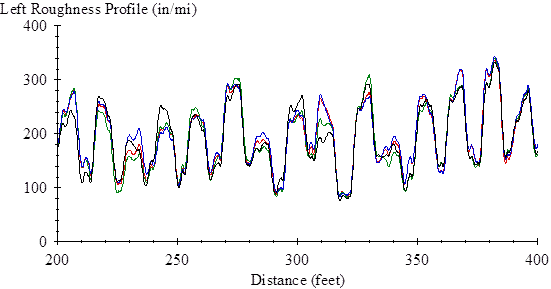
Section 0262 faulted. Filtered profile plots showed that the faulting grew steadily throughout the experiment. Figure 67 shows five repeat profile measurements from a portion of section 0262 in visit 15 (25-Jan-2010). The figure shows a consistent level of faulting along the section and among the repeat measurements. Faulting caused much of the roughness and its progression on section 0262. Figure 68 shows a very short (8-ft)-interval roughness profile for the same set of measurements covered in figure 67. The figure shows the average contribution to IRI of each 8‑ft-long segment as a function of the segment midpoint. The figure demonstrates that contributions to overall IRI of the section built up most aggressively at the joints.
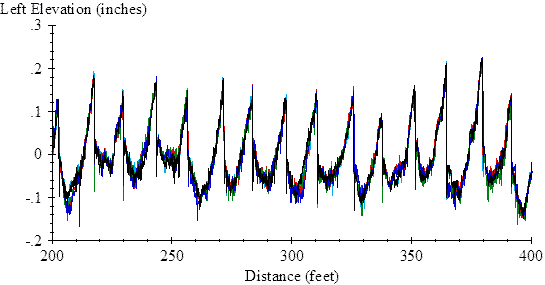 |
| Figure 67. Graph. Left Elevation Profile from Visit 15 of Section 0262. |
 |
| Figure 68. Graph. Left Roughness Profile from Visit 15 of Section 0262. |
Starting in visit 12 (11-Aug-2006), the right-side profiles from section 0262 included a narrow dip at the joint 83 ft from the start of the section and a swatch of narrow dips over a half-slab from 129 to 137 ft from the start of the section. Both of these features appeared in areas where distress surveys recorded longitudinal cracking. The roughness at joints caused by the faulting obscured the roughness of these dips.
Section 0263 developed very little faulting relative to the other test sections without dowels (0262, 0264, and 0265). In contrast, elevation profile plots showed a high level of slab curl.
All profiles from the right side of section 0264 included a rise in elevation of more than 0.5 inches over a 7-ft distance starting 164 ft from the start of the section. The area that included this built-in feature was the roughest of the section throughout the experiment.
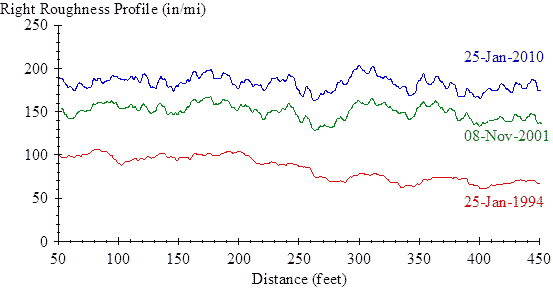
Section 0265 faulted. Filtered profile plots showed that the faulting grew steadily throughout the experiment. Like section 0262, faulting on section 0265 caused a large portion of the roughness progression. Figure 69 shows the roughness profile for section 0265 at various stages of the experiment. In this case, the roughness profile is plotted using a base length of 100 ft. Thus, every point along the plot represents IRI of a segment of pavement that starts 50 ft upstream and ends 50 ft downstream of that location. The 100-ft base length helps show the distribution of roughness throughout the section, but it is long enough to avoid local peaks caused by a single slab or joint.
 |
| Figure 69. Graph. Right Roughness Profile for Section 0265. |
Figure 69 demonstrates that in later visits roughness was distributed evenly along the section. This is because the magnitude of faulting was relatively consistent. The figure also demonstrates that roughness continued to increase throughout the section over the entire experiment.
In later visits, a patch of short-wavelength chatter appeared in the left-side profile within the slab from 314 to 328 ft from the start of the section. Distress surveys recorded scaling over this area and indicated “irregular surface characteristics” on the section. Portions of the section were diamond ground in an effort to alter the surface texture.
Section 0266 included a 60-ft-long bump beginning 400 ft from the start of the section. The bump was more than 0.6 inches high throughout the monitoring history. On the left side, a narrow dip appeared 438 ft from the start of the section and grew in severity over time. The dip appeared at a joint where photos in the 2004 distress survey showed a gap in the sealant and some missing concrete at the aft side of the joint. PSD plots and filtered elevation profile plots showed that the curl on this section was more severe than it was on sections 0267 and 0268.
Distress surveys indicated “irregular surface characteristics” on the section. Diamond grinding was performed on the left wheel path from 405 to 450 ft from the start of the section to adjust the texture. In the photos, it appeared the grinding barely submerged the existing texture. As such, the grinding did not affect IRI.
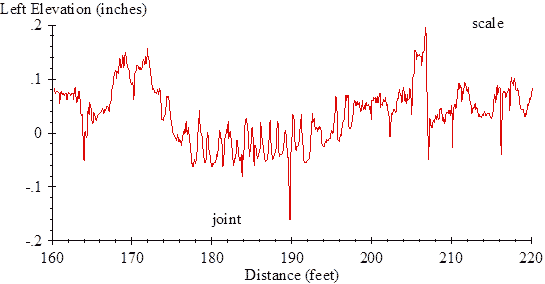
A weigh-in-motion scale was installed in section 0267 between visit 11 (12-Dec-2004) and visit 12 (13-Aug-2006). The scales appeared 206 ft from the start of the section on the left side and 194 ft from the start of the section on the right side. The portion of the section upstream of the scales received diamond grinding as part of the installation procedure. Diamond grinding reduced the IRI of the first 200 ft of the section by about 20 inches/mi on the right side but had very little effect on the left side. Figure 70 shows the profile from visit 12 over a segment that includes the scale. In the figure, the scale is about 0.1 inches above the surrounding pavement and contributes some roughness to the section. The series of closely spaced peaks from 176 to 192 ft along the plot occurs in an area that includes the inductive loop and the approach slab.
 |
| Figure 70. Graph. Weigh-in-Motion Scale on Section 0267. |
No specific observations are listed for section 0268.
1 Distortion of jointed concrete pavement slabs includes curling, which is typically associated with cyclic thermal gradients; warping, which is typically associated with cyclic and long-term changes in moisture gradient; and a small portion of built-in unevenness. In this appendix, the term curl is used as shorthand for all three sources of slab distortion.