U.S. Department of Transportation
Federal Highway Administration
1200 New Jersey Avenue, SE
Washington, DC 20590
202-366-4000
Federal Highway Administration Research and Technology
Coordinating, Developing, and Delivering Highway Transportation Innovations
 |
| This report is an archived publication and may contain dated technical, contact, and link information |
|
Publication Number: FHWA-HRT-06-108
Date: May 2006 |
Sensor applications to traffic control and management continue to evolve and escalate. Originally utilized for signalized intersection control, sensors are now used to supply real-time data for traffic adaptive signal control and mitigating recurring and nonrecurring congestion on freeways. Many advances in traffic control system technology during the past decade have been supported by the evolution of microprocessors and other electronics components. The relative ease with which research and widespread user knowledge can be retrieved has also assisted agencies in selecting appropriate sensor technologies and deployment configurations to satisfy their operational needs. The Internet with its convenient access to public and private libraries that contain evaluation reports of sensor performance and traffic management strategies enables the rapid sharing of test and operational experiences.
Traffic control concepts that rely on traffic flow data from sensors are common to central business district, arterial, and freeway traffic management strategies. The data needs of the applications can generally be satisfied by one or more sensor technologies. This chapter presents an overview of several of these traffic management strategies so that the traffic engineer or other practitioner can better understand their detection requirements. Additional information on how to use traffic sensors in traffic signal control systems can be found in two recommended references: Manual of Traffic Signal Design(1) and Traffic Control System Handbook.(2) The Freeway Management and Operations Handbook(3) may be consulted for information concerning freeway operation and appropriate freeway traffic management strategies.
Presence sensors detect slow moving and stopped vehicles. Passage sensors detect vehicles moving faster than 3 to 5 mi/h (5 to 8 km/h). |
Most vehicle sensors in use today monitor the movement of vehicles past a given point on the road. The data acquired are transmitted to a traffic signal controller, traffic counter, or other device. The controller or counter processes some data locally, while others are transmitted to a central computer or display monitor, in the case of camera imagery, at a traffic management center.
A sensor that detects the passage of vehicles in a specified direction may be used to issue a warning to alert the driver of a vehicle traveling in the opposite or forbidden direction. A presence sensor is generally used at locations where vehicle speeds are less than approximately 5 mi/h (8 km/h) or where stopped vehicle detection is required. A passage (motion-detecting) sensor will record the passage of a vehicle in the detection zone as long as the vehicle is moving more than 3 to 5 mi/h (5 to 8 km/h).
When vehicles are forced to stop or move very slowly when approaching a traffic-actuated signalized intersection, it is desirable to use presence detection to ensure that stopped vehicles waiting in the detection zone are detected. Early inductive-loop electronics units operating in the presence mode did not have a directional feature and could not differentiate between vehicles entering or leaving the detection zone. Some newer units contain this feature. Presence sensors that use over-roadway technologies such as video image processing incorporate directional features. At intersections, there may be less need for a directional feature, as the call is not normally retained in the controller once the vehicle leaves the detection zone. Passage sensors will not retain the call either once the vehicle leaves the detection zone. The difference is in controller operation (i.e., whether the controller is in locking or nonlocking mode).
Passage sensors may be used to count vehicles in individual lanes, multiple lanes where traffic flows in a particular direction, or all lanes where traffic flows in both directions. Passage sensors also measure vehicle speed and volume when speeds are greater than 3 to 5 mi/h (5 to 8 km/h).
Sensors based on video image processing, microwave radar, laser radar, passive infrared, ultrasound, passive acoustic, magnetometer, and inductive-loop sensor technologies discussed in Chapter 2 detect either vehicle presence or passage, depending on their particular design or the selected operating mode.
Modern traffic sensors can record traffic flow parameters by direction and by lane. Accurate arterial vehicle count and speed data are obtained by locating the sensors far enough in advance of the signalized intersection so that traffic does not back up to the detection zone. If traffic backs up to the sensor, only volume is measured.
Magnetometers can be used to count vehicles, provided the detection zone is placed in the desired portion of the lane of interest. Since magnetometer detection zones are generally less than 3 ft (1 m) in diameter, multiple units may be needed to detect vehicles over the entire lane width.
A properly functioning inductive-loop detector is an excellent sensor for detecting vehicle presence, providing it is properly installed and maintained. Loop size can be varied to accommodate different applications. For small area detection, the conventional loop and two-axis fluxgate magnetometer may be interchanged.
Some techniques for high-speed intersection signal control utilize conventional loops or magnetometer sensors with electronics units that are programmed for normal outputs. Other designs use electronic units that extend or hold the call of the vehicle after it leaves the detection zone (extended call detectors or extended call sensors). Another plan incorporates electronic units that delay an output until the detection zone has been occupied for a preset time (delayed call detectors or delayed call sensors). These are discussed in Chapter 4.
Over-roadway sensors are becoming more popular as sources of real-time data for signal control and freeway traffic management. This is because of their ability to provide multiple lane data from a single sensor, reduced maintenance, increased safety to installation personnel, data types not available from loops or magnetometers, and competitive purchase and installation costs.
A 1980 study suggested that the optimum characteristics of a sensor used for vehicle speed measurement were:(4)
When using two loops to measure speed, the loops should be large enough to sense high-body vehicles and provide a sharply defined wave front output as the vehicle passes over the loop. Any time differences in the detection of different vehicle types passing over the loops should be minimized. The loops should be spaced sufficiently far apart so that any difference in the time of intercept of the two inductive-loop detectors is small as compared to the transit time from the first loop to the second loop.
A rule of thumb for loop design states that the height of the magnetic field intercepted by the vehicle is two-thirds the distance of the shorter loop dimension. Therefore, a 6- x 6-ft (1.8- x 1.8-m) loop has intercepts of approximately 4 ft (1.2 m), as does a 6- x 100-ft (1.8- x 30.5-m) loop. Both 5-ft (1.5-m) wide and 6-ft (1.8 m) wide loops have proven effective at consistently detecting high-body vehicles. The choice depends on lane width. A spacing of at least 2.5 ft (0.8 m) should be allowed from the centerline to the edge of the loop to avoid actuation by traffic in adjacent lanes. In a 12-ft (3.6-m) lane, the 6-ft (1.8-m) loop should be used to ensure no counts are missed.
The spacing between loops for speed measurements is often specified as 16 ft (4.9 m) between the leading edges of two 6-ft (1.8-m) loops as shown in Figure 3-1. This sensor layout also applies to any pair of point sensors that might be used in a dual sensor speed-trap configuration. The sensitivity of the electronics unit connected to each loop must be the same. If not, the vehicle position with respect to the loop's leading edge, which induces the critical change in loop inductance needed to activate the electronics unit and which is proportional to the sensitivity, will vary from loop to loop, thereby introducing a measurement error. In the late 1980s, very fast response times at sensitivity levels appropriate for roadway vehicles were made possible by new electronic component technology.
Figure 3-1. Vehicle speed measurement using two inductive-loop detectors placed a known distance apart.
Freeways were originally conceived as limited access, free-flowing facilities with little need of traffic control. Rapid growth in freeway traffic volume and resulting congestion have led to development of freeway surveillance and control systems. These systems employ techniques such as ramp control, mainline control, corridor control, and traveler information systems to mitigate freeway congestion. Strategies used today to assist in the management of freeways include:
Each city street arterial and freeway traffic management concept has its own set of operating parameters and components, including sensors, as discussed below in the sections on signal control concepts for city streets, freeway surveillance and control, and coordinated operation of freeways and surface arterials.
Traffic signal control concepts for city street intersections may be grouped into strategies for individual intersections and strategies for groups of intersections as follows:
Sensor web density levels and their relation to traffic control systems are described in Appendix L. |
Signal control concepts for special functions include:
Types of local intersection signal control include pretimed control and actuated control. |
Local intersection control is the strategy residing in the local controller that manages traffic flow independently of other traffic signals. Two types of local control exist, pretimed and actuated.(2,5) The type of control selected is frequently subject to local policy and practice. If the local control is run independently of strategies for other intersections, the system control is called "uncoordinated control." Since each signal in uncoordinated control or isolated intersection control operates independently, offset is not a controlled parameter when isolated intersection control is implemented.
Pretimed ControlSensors are not required for pretimed control when right-of-way is assigned based on a predetermined fixed time duration, as determined from historic data, for all signal display intervals. Therefore, pretimed control is generally inefficient for controlling intersections that undergo changes in demand. Pretimed control may be used in conjunction with traffic adjusted or traffic responsive timing plan selection where closely spaced signals dictate fixed offsets, such as with diamond interchanges or central business districts.
Actuated ControlActuated control utilizes sensors to provide data to a local traffic signal controller as illustrated in Figure 3-2. Sensors are typically located at stoplines (A), upstream of the stopline (B), left turn lanes (C), and at positions to detect emergency (D) and transit vehicles (E). Inductive-loop detectors are the most common sensor used for this application, although multiple-lane, multiple-detection zone sensors such as the video image processor or true presence microwave radar may have merit for this type of signal control. The suitability of over-roadway sensors for a specific application should be evaluated through field testing by the responsible agency to ensure that the required calls are provided reliably. The information gathered by the sensors can be processed as indicated in Figure 3-3 or in another manner, depending on the particular traffic management requirements and strategies.
Actuated control can be semiactuated or fully actuated. In semiactuated control, the major street operates in a nonactuated mode such that green is always present unless a minor street actuation is received. Therefore, sensors are required only for the minor cross-street phases. In the absence of cross-street demand, semiactuated signals are recalled to the major street phase. Semiactuated operation is appropriate when vehicles on the minor streets approach the intersections in a random manner, that is, where platoons (groups of closely spaced vehicles traveling at the same speed) cannot be sustained. Such a condition is likely where there are long distances between signalized intersections, unpredictable or relatively low minor-street volumes (e.g., less than 20 percent of volumes on the major street), and a large proportion of turning movements.
In Figure 3-2, letter A indicates placement of stop bar detection sensors that are used to detect vehicles that turn right and thus avoid the need to call the green. Letter B indicates advance detection sensors used for measuring headways for gap acceptance logic, red light running minimization, and measuring volumes for added green per phase. Letter C indicates left turn phase detection sensors that measure presence and sometimes queue length of vehicles needing to call left turn phase logic. Letter D indicates emergency vehicle sensors that detect the approach of emergency vehicles and invoke emergency preemption logic. Letter E represents transit vehicle sensors, which invoke transit vehicle priority logic. All of the sensors provide traffic flow data used to actuate appropriate phases of isolated intersection signal control. The data enter a traffic signal controller located at one of the corners of the intersection. The controller uses logic processing, illustrated in Figure 3-3, to display the correct indications on the traffic signals and pedestrian signals. |
Figure 3-2. Isolated intersection control. The letters represent data sources that influence signal timing as explained in the text.
Figure 3-3. Data processing at an intersection with isolated intersection control.
Fully actuated control operates with traffic detection on all approaches to the intersection for all signal phases. It is the most widely applied control strategy for isolated intersections. Because the cycle length varies from cycle to cycle, it can be utilized at street intersections with sporadic and varying traffic distribution.
Volume-density control, a variant of actuated control, provides a complex set of criteria for allocating green time ("added initial" and "time waiting-gap reduction"). This mode can be utilized with both semiactuated and fully actuated signals. It normally operates on a continuously variable cycle length and requires accurate traffic flow data to accommodate changing conditions in a timely manner. Although the time waiting gap reduction can be utilized with presence sensors, passage sensors are normally installed far in advance of the intersection, e.g., from 200 to 600 ft (60 to 180 m) before the intersection, depending on approach speed.
Figure 3-4 shows a typical detection zone placement for fully actuated intersection control with advance sensors only on the primary phases. The sensors near the stopline detect vehicles that would otherwise be trapped in the crosswalks or in front of the stopline. Passage and advance sensors are normally located in accordance with estimated approach speeds to place a call to the controller until the phase is serviced.
The controller provides memory latching when passage sensors are used. Passage sensors generate a pulsed output (generally between 100 and 150 ms) whenever a vehicle enters the sensor's detection zone.(2)
Figure 3-4. Placement of sensors for fully actuated intersection control. The numbers represent a four-phase signal sequence consisting of traffic movements 1 and 5, 2 and 6, 4 and 8, and 3 and 7.
Interconnected intersection control provides signal progression that allows platoons of vehicles to proceed along arterial routes without stopping. It also imparts area-wide control to minimize total delay and number of stops over an entire network. This form of control is effective when traffic moves in platoons and their arrival time can be predicted at downstream intersections. Interconnected intersection control can function in a variety of ways. The first category selects from among a library of prestored signal timing plans based on TOD/DOW(classic pretimed). The prestored plans are generated offline from average or historical data. The second uses timing plans that best match current traffic flow conditions which may be generated online (see 1.5 GENERATION and SECOND GENERATION sections). The third uses flexible signal timing plans that are generated online in real time based on current traffic flow conditions based on centralized control with fixed offsets. These traffic responsive may update their flexible timing plans incrementally at each signal cycle. The fourth uses continuous adjustments to intersection timing with continuous communications between adjacent intersections and decentralized control. (See section titled Traffic Adaptive Control and Distributed Systems). These categories are detailed in Table 3-1.
Sensor DataSensors are utilized in interconnected intersection signal control to gather traffic flow data for signal timing plan selection or real-time calculation and to support critical intersection control. The signal timing selection process is similar for arterial and network systems. The operation of signal timing plans is determined by the roadway configuration and the goals of the corresponding plans. Figure 3-5 shows examples of surface street traffic signal configurations found in arterial open network systems and closed network systems typified by central business districts. An open network typically has coordination timing constraints on only two of the approaches to the signal. This is typical of arterial and multiple arterial systems. A closed network typically has constraints on all approaches to each intersection. This is typical of central business district systems and multiple parallel arterial systems.
Arterial SystemsArterial signal control systems are often implemented using an open network. The goals of arterial system timing plans are to provide arterial progression in the direction that carries heavier traffic volumes, to maximize arterial capacity, and to minimize arterial delay. Cycle length, split, and offset timing plan parameters are varied to reflect the current traffic conditions. The maximum phase times for minor cross streets in arterial systems are often controlled by pedestrian crossing time requirements. Detection of cross-street demand was discussed earlier as a part of isolated intersection control.
Figure 3-5. Arterial open network and surface street closed network traffic signal configurations typical of those found in interconnected intersection control.
Interconnected Control and Classic Pretimed Network SystemsThese network systems typify the era before urban traffic control system (UTCS) software was available. Two types of network systems were used: a closed-grid roadway configuration typical of urban central business districts and an area-wide system that controlled all or a major portion of the signals in a city or metropolitan area. The goals of network system timing plans were essentially the same as those for arterial systems.
Many urban jurisdictions installed pretimed and semiactuated traffic signals for a closed network. Vehicle detection sensors were used at the semiactuated intersection. As with the arterial system, cycle length, split, and offset varied from plan to plan. The plans could be computed offline and implemented on a TOD/DOW basis as in UTCS 1st-generation software; computed offline and implemented on a traffic-adjusted basis as in UTCS 1.5-generation software; or computed online in real time as with 2nd-generation software. In all cases, the plans were pretimed with sensor inputs used to generate the data needed to calculate the pretimed plans.
Timing plans were normally implemented by dividing a system into a number of sections, each of which had homogeneous traffic conditions. System sensors, assigned to each section, provided the information required for plan selection from a database library of applicable timing plans.
Control of Groups of Intersections Using Online Generated Timing PlansThe intersection control strategies described in previous sections are typical of those employed in pre-UTCS systems using uncoordinated control, time base coordinated control or interconnected control systems (see definitions in this chapter under "Signal Control Concepts for City Streets"). The UTCS project began the large-scale use of sensors and computers for controlling traffic signal systems in the United States. This project drove the initial U.S. development of traffic adjusted control and traffic responsive control, which led to traffic adaptive control.
Traffic Adjusted Control and UTCS 1.5-Generation SystemsFirst-generation interconnected traffic signal control systems are characterized by the TOD/DOW selection of a timing plan from a set of timing plans, which are computed offline. Traffic adjusted control such as UTCS 1.5-generation added the capability for timing plans to be selected based on a combination of volume Vand weighted occupancy O sensor data, referred to as VPLUSKO (i.e., volume plus weighted occupancy), where the K represents the weighting factor. Figure 3-6 illustrates the 1.5-generation UTCS timing plan selection process.
Figure 3-6. UTCS timing plan selection procedure.
Each timing plan has a VPLUSKO value corresponding to each of the sensors in the system. The sensor outputs are compared to the VPLUSKO values from each plan, and the plan that most closely matches the sensor outputs is selected. If a potential timing plan is found to be more favorable than the current plan, then the new plan is subjected to an antihunting test. The purpose of the antihunting test is to verify that the new plan is sufficiently better (by a predefined amount) to warrant implementation. This prevents needless transitions between timing plans that have similar benefits. The comparison operation is repeated at user-selected intervals, e.g., 4 to 15 minutes.
However, 1.5-generation systems do not address all the drawbacks of pre-UTCS signal control such as unexpected traffic flow scenarios (e.g., from unanticipated incidents). Traffic adjusted control (such as UTCS 1.5) responds successfully to precalculated traffic demands such as those produced by large vehicle flows from parking lot exits at sports venues.
Second-generation UTCS was a first attempt at real-time, online computing of optimized splits and offsets, while keeping cycle length fixed within variable groups of intersections. Trials with this technique demonstrated some reduction in vehicle-minutes of travel time (with respect to the base system) on the arterial, but increased travel time in the network as a whole.(7) More advanced strategies are found in third-generation traffic signal control systems. These traffic systems support the online generation and implementation of signal timing parameters derived from real-time sensor data and modeling, prediction, and optimization techniques.
Traffic responsive and traffic adaptive systems can overcome several limitations of signal control systems that rely solely on prestored timing plans. For example, prestored timing plans developed offline are best suited for traffic flow on a normal day or for events that produce predictable traffic patterns. Their major disadvantage is that they are developed from specific traffic flow scenarios and, therefore, cannot respond to situations that are significantly different from those used to generate them. Their major advantage is that they can be implemented at the beginning of a preplanned traffic event or incident such as the exiting of a large number of vehicles from a sports venue parking facility. Furthermore, data collection and manpower costs limit the ability of many traffic management organizations to maintain timing plans that are representative of current traffic volumes and patterns. Traffic responsive and traffic daptive systems attempt to overcome these limitations by providing signal timing that more quickly responds to real-time traffic flow sensor data than traditional traffic adjusted or TOD/DOW systems.
Traffic responsive and traffic adaptive systems generally require a greater number of sensors than conventional first-generation systems and usually require extensive initial calibration and validation.(8) Therefore, total system life-cycle costs, including software licensing, purchase of local controllers and central computers, and ongoing operating and field maintenance costs, are often compared to expected benefits when evaluating traffic signal operating strategies. Nevertheless, continued advancements in sensor and computer system technology plus improving traffic control algorithms are making traffic responsive and traffic adaptive systems increasingly attractive as compared to conventional systems when traffic volumes and roadway network design warrant their use. The ability to adapt to changes in traffic flow patterns over long-term intervals (i.e., to respond to aging of prestored timing plans) frequently makes traffic responsive systems cost effective.(9-26)
Centralized traffic responsive and distributed traffic adaptive system concepts have been developed for signal control. Typical of the traffic responsive concept are SCOOT and SCATS.
SCOOT and SCATS have been called both traffic responsive and traffic adaptive. This edition of the Traffic Detector Handbook uses the definitions in Appendix L, "Classification of Sensor Systems by Sensor Density Level," and Appendix P, "Glossary," and classifies them as traffic responsive systems. SCOOT: The Split, Cycle and Offset Optimization Technique (SCOOT) is a real-time system developed by the Transport and Road Research Laboratory (TRRL) in Great Britain. SCATS: The Sydney Coordinated Adaptive Traffic System (SCATS). A real-time system developed by the Roads and Traffic Authority (RTA) of New South Wales, Australia. |
SCOOT continuously measures traffic demand on most approaches to intersections in the network and optimizes signal cycle lengths, splits, and offsets to minimize delay and stops. SCOOT sensors are located upstream from the signal stopline, approximately 15 meters downstream of the adjacent upstream intersection. Timing changes per cycle are small to avoid major disruptions to traffic flow, but frequent enough to allow rapid response to changing traffic conditions. The prototype SCOOT systems reduced peak period average delay at traffic signals by approximately 11 percent as compared to fixed signal control plans generated by TRANSYT. Off-peak delay was reduced by an average of 16 percent.(10,16)
Similar to SCOOT, SCATS adjusts cycle time, splits, and offsets in response to real-time traffic demand and system capacity. The principal goal of SCATS is to minimize overall stops and delay when traffic demand is less than system capacity. When demand approaches system capacity, SCATS maximizes throughput and controls queue formation. SCATS sensors are installed in each lane immediately in advance of the stopline to collect volume and occupancy data during the green of the approach. Studies have found that the reduction of stopped and approach delay for the main approaches to intersections is greater during low-volume time periods than during peak volume periods.(27-29) Sensor configurations for SCOOT and SCATS are discussed in Appendix L.
The key differences between interconnected control, traffic adjusted control, traffic responsive control and traffic adaptive control are shown in Table 3-1. Wireless communications may be substituted for wireline for most communications speeds. |
Traffic adaptive systems are typified by the adaptive control system (ACS), which uses OPAC algorithms in one rendering and RHODES algorithms in another. These distributed systems are executed at the local intersection using an advanced traffic controller such as the 2070. They employ a rolling horizon, which recalculates predictions and optimizations every second for several seconds. Sensors placed upstream of the stopline give at least 10 to 15 seconds of travel time until the upstream vehicle platoon reaches the downstream intersections.(2) Sensor configurations for ACS are discussed in Appendix L. An implementation of ACS with the OPAC algorithms on Reston Parkway in Virginia resulted in a 5 to 8 percent reduction in stops and delay over an optimized actuated signal control system.(30) In simulations conducted as part of the RT-TRACS program (now called ACS), RHODES was found to increase throughput and reduce delay on the test network and, hence, performed better than the fixed-timing plan generated from TRANSYT-7F.(31-33) The advent of sensors that can be used to measure turning movements and travel times on links will expand the application of algorithms used in traffic adaptive systems. See Table 3-1 for more detail on differences between traffic responsive and traffic adaptive control.
Review of strategies for control of groups of intersectionsTable 3-1 summarizes the characteristics of different categories of control strategies for groups of intersections. The key difference is how rapidly each control strategy can make changes in response to variations in traffic demand. From this criterion flows differences in the data requirements and data flow rate needed to implement the strategies. This in turn enables different timing features to be changed at different frequencies in each category.
All of the categories and characteristics are for systems and not for the individual intersection. |
Category title to right characteristic below |
Uncoordinated control |
Time-based coordinated control (TBC) and interconnected control categories |
Traffic adjusted control |
Traffic responsive control |
Traffic adaptive control |
|---|---|---|---|---|---|---|
This row describes the system response and not any local traffic actuated response. In some interconnected systems, operators can select plans in real time. In all traffic adjusted and traffic responsive systems, plans may be selected in real time. |
Response to variations in traffic demand |
Very slow reactive response based on historic traffic flows, prompt local actuated response possible, no current system response |
Very slow reactive response based on historic traffic flows, prompt local actuated response possible, no current system response |
Slow reactive response based on overall network trend—volume plus weighted occupancy or general direction of flow |
Prompt reactive response based on changes in platoons |
Very rapid predictive proactive response based on predicted movements of individual vehicles or small packets of vehicles |
In most traffic adjusted and all traffic responsive systems, operator may select and download changes in signal settings and plans in real time. |
Frequency of change in control plan |
No changes related to adjacent intersections |
Plans for peaks, midday and evening off peaks, and weekends |
Minimum of 15 minutes, usually several times a rush period |
Minimum of 15 minutes with adjustments possible once per cycle |
No overall timing plan as continuous adjustments are made to all parameters. |
Fixed timing plans—cycle, split, offset, and actuated settings are not adjusted between switching of timing plans. These are used in uncoordinated signal control, time based coordinated control, interconnected control and traffic adjusted control systems. |
What timing features are changed |
No changes related to adjacent Intersections Timing for individual intersections may change at preset TOD/DOW |
Total timing plan may be changed out at preset TOD/DOW— Fixed plan with splits, offsets cycle length, etc., unchanged during period |
Total timing plan changed out—Fixed plan with splits, offsets, cycle length, etc., unchanged during period; variable TOD when plan is changed |
Total timing plan changed out—Flexible plan with cycle, splits, offsets, and actuated settings changeable once per cycle; variable TOD plan changes |
Phase selection, sequence, and durations adjusted every time step; cycle and offset not required; splits are dynamic as above |
Wireless communications may be substituted for wireline for most communications speeds. |
Data communications requirements |
None |
Not required for TBC; low speed for interconnected real-time comm not required (frequently twisted pair) |
Low speed, real time communication may be needed; twisted pair or better preferred |
Low speed but faster is better; real-time communication is needed |
Fast and real time |
System sensor requirements |
No system sensors required |
No system sensors required |
Minimal, one system sensor per intersection on average |
Moderate, minimum of 1 per approach, preferred 1 per lane per approach |
High, minimum of 1 per lane per approach, RHODES 2 per lane per approach |
|
Local intersection controller and coresident local computer requirements |
For new installations NEMA/170 and no coresident computer |
For new installations NEMA/170 and no coresident computer |
NEMA/170 and no coresident computer |
Moderate—NEMA/170/ATC and no coresident computer for local control algorithms |
High, ATC preferred, coprocessor card or separate computer box for running local algorithms |
|
Central computer or system master requirements |
None |
TBC None—interconnect minimal, vendor system master or PC level |
Moderate, vendor system master or PC level |
High end system master or PC required— much central processing |
Medium most processing is local |
|
Maintenance of database, communications, sensors and system master |
Low cost —local settings, local sensors, traffic studies |
Low cost —add setting coordination settings, some communications traffic studies for them |
Moderate cost —add to interconnected more database, communications and minimal system sensors |
Medium cost —add more system sensors, central database, communications but fewer traffic studies |
High cost —add more system sensors, communications, less central database |
|
Installation |
Low cost |
Low cost |
Moderate cost |
Medium cost |
High cost |
|
System design and operation |
Requires lowest skill level and staffing |
Requires moderate skill level and staffing |
Complex and requires good skill level and staffing |
More complex and requires high skill level and staffing |
More complex and requires high skill level and staffing |
A discussion of the systems engineering process involved in designing traffic signal systems is found in NCHRP Synthesis 307.(8) The major steps involved in the systems engineering process as applied to traffic signal systems begin with the identification of requirements for:
Once requirements are established, plans and methods to implement them and evaluate system performance are developed.
The Traffic Control Systems Handbook and the Traffic Detector Handbook describe the types of coordinated traffic signal systems through a category of characteristics as listed in Table 3-1. The number of sensors required for each level are described in more detail in Appendix L.
Freeway surveillance and control are used to mitigate recurring and nonrecurring congestion. Common techniques applied for this application include entrance ramp metering, mainline metering, freeway-to-freeway metering, corridor management, high occupancy vehicle lanes, congestion-based pricing for toll facilities, advanced traveler information systems, and automatic incident detection. |
Sensors are used in freeway surveillance and control to detect recurring and nonrecurring congestion and to assist in mitigating their effects. Recurring congestion occurs when both the location and time of congestion are predictable such as during weekday peak travel periods. Nonrecurring congestion is caused by random, temporary incidents such as stalled vehicles, accidents, spilled loads, or other unpredictable events.
Recurring congestion develops when traffic demand exceeds freeway capacity. Recurring congestion may be reduced by decreasing peak period demand through techniques such as entrance ramp metering, mainline metering, freeway-to-freeway connection control, corridor management, control of the number of occupants needed to access high-occupancy vehicle lanes, congestion-based pricing for use of toll facilities, and advanced traveler information systems that inform motorists of congestion ahead and perhaps of alternate routes. Sensors play a major role in alleviating recurring congestion, particularly in entrance ramp metering.
Nonrecurring congestion is more difficult to manage because of its unpredictability. Detecting the incident and removing its cause as quickly as possible minimize the effects of the nonrecurring events.
A variety of information gathering techniques are used for incident detection, including periodic sensor placement along freeways, closed-circuit television, aerial surveillance, emergency call boxes, freeway patrols, and cellular telephone calls from motorists. Nonimaging mainline sensors are not as effective for incident identification, but are often used to detect the beginning of congestion at off peak hours, which usually indicates some type of incident has occurred. They can also be used to determine the extent of the incident's impact. Automatic incident detection algorithms face a more difficult task during peak traffic hours because the characteristics of nonrecurring congestion caused by an incident are often difficult to differentiate from those of recurring congestion.
The following sections further explore techniques that utilize sensors for managing traffic on freeways.
Fifty to sixty percent of the delay on urban freeways is associated with incidents, rather than with recurring congestion due to capacity shortfall.(34,35) Often recurring and nonrecurring congestion occur simultaneously during peak periods. In fact, since most algorithms detect incidents by measuring perturbations in traffic flow, automatic incident detection techniques must distinguish between shock waves formed by recurring peak-period congestion and those formed by incidents during similar periods. An incident can be defined as any anomaly that disrupts the smooth flow of traffic. Debris on the road, flooding, cargo spills, vehicle collisions or accidents, special events such as ball games and festivals, and highway work are examples of incidents.
Traffic Flow Characteristics During an IncidentTraffic flow characteristics during a freeway incident can be characterized in terms of the four flow regions illustrated in Figure 3-7.(36) Flow region A is far enough upstream of the incident so that traffic moves at normal speeds with normal density. Flow region B is the area located directly behind the incident where vehicles are queuing if traffic demand exceeds the restricted capacity caused by the incident. In this region, characterized by the upstream propagation of a shock wave, speeds are generally lower, and a greater vehicle density may exist. Flow region C, also shown in Figure 3-8, is the region directly downstream from the incident where traffic is flowing at a metered rate, or incident flow rate, due to the restricted capacity caused by the incident. Depending on the extent of the capacity reduction, traffic density in region C can be lower than normal, while the corresponding traffic speed is generally higher than normal. Flow region D is far enough downstream from the incident such that traffic in D flows at normal density and speed, as in region A.
Incident clearing and the return of traffic flow to normal occur in several phases. These are detection, verification and identification, response, removal, and recovery. Detection determines that something extraordinary has occurred. Then the location, types of vehicles, presence of hazardous materials, and possible injuries related to the incident have to be verified and identified. This step facilitates timely dispatching of appropriate personnel and equipment to remove affected vehicles and people from the site.
Figure 3-7. Traffic flow characteristics during an incident
(source: Intelligent Vehicle Highway Systems: The State of the Art, prepared for Massachusetts Department of Highways (JHK and Associates, New York, NY, March 1993)).
Figure 3-8. Freeway incident detection scenario.
Detection and verification are the areas in which improved sensor and communications technology can be of most benefit to incident clearing. Closed circuit television, roving highway and freeway service patrols, aerial surveillance, roadside emergency call boxes, reports from fleet operators, and some repeated number of cellular telephone calls to 911 or the traffic management center are methods used to verify the occurrence of an incident.
Timeliness is the key to incident clearing and the minimization of congested flow conditions. Rapid detection and verification allow faster and perhaps less complex response options and more effective aid to victims. Quick response and the proper equipment permit rapid removal of affected vehicles and debris, and reduced delay and exposure to secondary accidents at the scene and at the end of any queues that form. When an incident blocks a traffic lane, the flow is choked and slowed, resulting in a traffic queue upstream of the incident. The queue and vehicle-hours of delay continue to build until the incident is cleared and normal traffic flow is restored. If the normal flow of traffic into the incident site is reduced by diversion onto alternate routes, then the vehicle-hours of delay are minimized. If normal traffic flow is not diverted, then additional vehicle-hours of delay are realized.(35)
ITS technology, with its emphasis on real-time operation and rapid communication, can assist in reducing the delay and crash costs associated with incidents. However, without the capability for rapid response and the cooperation and coordination among personnel in the responsible agencies (e.g., highway patrol, tow truck operators, fire, hazardous material team, emergency medical services, local police, traffic and transit management), the potential benefits of these high technology systems may not be realized.
Several forms of freeway metering exist. The most common is onramp metering, which restricts freeway demand at limited access onramps in an effort to prevent breakdown of flow on the mainline. Freeway-to-freeway connector metering, also used to control mainline demand, is designed so that queues at the metering signals do not compromise safety on the high-speed roadways. Mainline metering is applied at selected locations, such as bridges and tunnels, to maximize traffic flow through these facilities. It is usually implemented where there is sufficient storage capacity (such as at a toll plaza) and in conjunction with HOV lanes that bypass the queues upstream of the signals.
Ramp closure, a technique that does not require sensors on the ramp or mainline, can be used to restrict the number of vehicles entering a freeway. The more modern approach is to use sensors to monitor mainline congestion and transmit that information to ramp signals, which moderate the number of vehicles entering the freeway mainline.
Ramp ClosureClosing an entrance ramp during peak period is a positive technique for limiting the number of vehicles entering a congested freeway. It is, however, the most restrictive and least popular with the public. If applied in an inappropriate situation, it could result in underutilization of the freeway and the overloading of alternative routes. Ramp closures are effective where the entrance ramp introduces serious weaving or merging problems under congested conditions.
Manually placed barriers (including law enforcement vehicles), automated barriers, and signing are used for ramp closures. Sensors are not required except, perhaps, during the changeover operation of automated barriers.
Ramp MeteringThe most common technique for addressing recurring congestion on freeways is ramp metering. It limits the rate at which vehicles enter the freeway's mainline so that the downstream mainline capacity is not exceeded. Ramp metering redistributes the freeway demand over space and time. Excess demand is either stored on the ramp or diverted. The diverted vehicles may choose less traveled alternate routes, or their occupants may select another mode of transportation. Metering rates range from a minimum of 180 to 240 vehicles per hour (v/h) to a practical maximum of 750 to 900 v/h.
Ramp meters assist in dispersing platoons of vehicles that are released from nearby signalized intersections. By releasing a limited number of vehicles into the mainline traffic stream, turbulence is reduced in the merge zone. This leads to a reduction in sideswipe and rear-end accidents, which are associated with stop-and-go traffic flow. Maximum mainline flow rates can be achieved by controlling ramp flow rates such that freeway traffic moves at or near optimum speed throughout the network.
Management of nonrecurring congestion created by freeway incidents is a secondary benefit associated with ramp metering. Once an incident is detected, ramp metering can potentially reduce the number of vehicles impacted by the incident. For example, meters upstream of a detected incident can be adjusted to allow fewer vehicles to enter the affected facility, potentially diverting some trips to onramps downstream of the incident location. Conversely, the downstream ramps can operate with relaxed metering rates in order to accommodate the increased demand. This incident management strategy works well during peak periods, especially when integrated with a smart corridor operation. Incidents occurring during off-peak hours may be mitigated with a strategy that closes upstream onramps rather than with metering because of the reduced onramp volumes.
A seminal study that evaluated the benefits of ramp metering was conducted by the Minnesota Department of Transportation (MnDOT) in accordance with a bill passed in the year 2000 session by the Minnesota Legislature.(37) The bill required MnDOT to examine the effectiveness of ramp meters in the Minneapolis-St. Paul, MN, region by conducting a shutdown study before the next legislative session. The goal was to evaluate and report any relevant fact comparisons or statistics concerning traffic flow and safety impacts associated with deactivating system ramp meters for a predetermined amount of time. The study, completed at a cost of $651,600, occurred in the fall of 2000, with the results presented to the Legislature and the public in early 2001.
A summary of the conclusions reached by MnDOT concerning the annual benefits of ramp metering is as follows:
Figure 3-9 depicts a conceptual freeway ramp meter installation. The sensors on the mainline serve a dual purpose: adjustment of the ramp-metering rate in response to real-time demand and collection of historical volume and occupancy data. A demand sensor on the ramp indicates the arrival of a vehicle at the stopline and the commensurate start of the metering cycle. Demand at the stopline is typically required before the ramp signal is allowed to turn green. A passage sensor detects when the vehicle passes the stopline and returns the ramp signal to red for the next vehicle. The passage sensor can also be used to monitor meter violations (i.e., drivers who ignore the red stop signal) and provide historical data about the violation rate at each ramp.
Figure 3-9. Conceptual ramp metering sensor and roadway configurations.
Ramps that contain two metered lanes or one metered and one unmetered HOV lane add a count sensor after the passage sensor to obtain the total count of vehicles entering the mainline. The queue sensor is used at locations where ramp backup impacts surface street operation. A high occupancy rate over a queue sensor can signal the ramp metering logic to increase vehicle passage or, in special situations, to suspend metering to prevent vehicles from backing onto feeder roads.(2) The advanced warning sign alerts drivers to the operational status of metering activity. Where ramp geometrics are poor, a merge sensor may be used as a feedback mechanism to prevent additional vehicles from proceeding down the ramp if a vehicle is stopped in the freeway merge area.
Current ramp metering strategies include:(2)
The traffic signal in a pretimed metering system operates with a constant cycle using a metering rate calculated from historical data. Metering and signage can accommodate single vehicle entry or platoon entry onto the mainline. The major operational advantage of pretimed metering is the regularity of the rate that is easily accommodated by drivers. The principal drawback of pretimed metering is its inherent insensitivity to changes in traffic conditions. Pretimed metering is often implemented as an initial operating strategy until traffic responsive control can be initiated. The sensors needed for pretimed metering are a queue sensor, demand sensor, and passage sensor.
The method for calculating pretimed metering rates depends on the primary purpose of the metering, namely to minimize congestion or to improve safety.
Minimizing congestion through pretimed metering—Freeway congestion reduction is implemented by choosing a metering rate approximately equal to the difference between upstream freeway demand and the downstream freeway capacity. Metering rates that address congestion reduction are based on:
Improving safety through pretimed metering—Pretimed metering that improves merging safety allows each vehicle enough time to enter the mainline before the following vehicle enters the merging area. This prevents rear-end and lane-changing collisions by breaking up platoons of vehicles that compete for gaps in the freeway traffic stream. Metering rates that primarily treat safety depend on the distance from the stopline to the merging point, ramp geometry, and vehicle type.
Local Traffic Responsive MeteringLocal responsive metering uses real-time mainline traffic flow information near the ramp or just downstream of the ramp to determine metering rates. The traffic flow parameters assist in evaluating freeway operation with respect to upstream demand and downstream capacity and in determining the maximum number of ramp vehicles permitted to enter the freeway without causing congestion. Traffic flow parameter measurements such as occupancy and volume are often smoothed to filter short-term random fluctuations by calculating running averages over a 5-minute period. Some facilities include sensors to determine traffic composition and weather to account for the effects of these factors. The sensors needed for pretimed metering are a queue sensor, demand sensor, passage sensor, merge sensor, and mainline sensors.
Advantages and disadvantages—The advantage of local traffic responsive metering over pretimed metering is the ability of the metering rate to respond to short-term variations in traffic demand or to reduced capacity caused by incidents downstream of the ramp. Results with traffic responsive metering are 5 to 10 percent better than pretimed metering in terms of reduced overall delay. A best case example of traffic responsive ramp metering benefits is from a ramp control experiment in Los Angeles, CA, that produced a 100 percent increase in average speed from 25 to 52 mi/h (40 to 84 km/h), a 20 percent decrease in ramp wait time, and a 3 percent increase in freeway volumes.(38) The main disadvantage of local traffic responsive control strategies is that mitigation must wait until the congestion reaches the local section controlled by the ramp. Table 3-2 contains a recommended range of metering rates based on mainline occupancy as the controlling parameter.(39,40)
Occupancy (percent) |
Metering rate vehicles per minute (v/min)a |
Occupancy (percent) |
Metering rate (v/min)b |
|---|---|---|---|
<10 |
12 |
<20 |
12+ |
11-16 |
10 |
20-22 |
10 |
17-22 |
8 |
22-25 |
8 |
23-28 |
6 |
25-27 |
6 |
29-34 |
4 |
27 or higher |
4 |
>34 |
3 |
a Blumentritt, C.W., et al. Guidelines for Selection of Ramp Control Systems, NCHRP Report 232. National Research Council, Transportation Research Board, Washington, DC, May 1981.
b McDermott, J.M., S.J. Kolenko, and R.J. Wojcik. Chicago Area Expressway Surveillance and Control: Final Report, Report Number FHWA-IL-ES-27. Illinois Department of Transportation, Oak Park, IL, 1979.
Improving safety—The impact of local traffic responsive ramp metering on the crash rate was studied in an early operational test in Chicago, IL. The metering rate was controlled by stream measurements of lane occupancy in one of the center lanes near the metering device, plus measurements of occupancy at the nearest downstream bottleneck. The prevailing metering rate was the most restrictive calculated from local or freeway segment conditions. An analysis of merges that occurred during peak traffic flow periods showed an 11.6 percent reduction in all traffic conflicts when the metering rate was 12 or more v/min. Metering at a more restrictive rate was predicted to reduce conflicts further.(40) Although strategies were developed for controlling metering rates based on mainline flow rate, ramp flow rate, and occupancy measurements, the advantages of these techniques were outweighed by operational and maintenance disadvantages created by the need for more sensors and more precise and accurate data.
Implementation—Local traffic responsive metering algorithms may be implemented with techniques other than lookup tables. Some algorithms attempt to maintain mainline occupancy at a preselected value through a recursive process. Asservissement LINéaire d'Entrée Autoroutière (ALINEA), is such an algorithm that uses feedback to control mainline occupancy by adjusting the metering rate R (v/min) at time t+1 based on its value at time t according to(41-43)
![]() (3-1)
(3-1)
where
R|t = metering rate at time t in v/min
KR = rate adjustment parameter in v/min
![]() = nominal or target occupancy
= nominal or target occupancy
O|t+1 = measured mainline occupancy at time t+1.
Papageorgiou uses a default value of 1.17 for KR, while Mahmassani reports a value of 0.32. Typical values for ![]() are 0.17 to 0.30. If the calculated value for R violates physical or operational constraints, it is suitably adjusted to a feasible value. The metering rate at any time may be constrained by maximum and minimum values to suit the traffic management objectives. The default values of KR are for illustration only and are not meant to imply values suitable for any or all applications.
are 0.17 to 0.30. If the calculated value for R violates physical or operational constraints, it is suitably adjusted to a feasible value. The metering rate at any time may be constrained by maximum and minimum values to suit the traffic management objectives. The default values of KR are for illustration only and are not meant to imply values suitable for any or all applications.
In the Netherlands, fuzzy logic control (FLC) is used on the A12 freeway between The Hague and Utrecht.(44) The algorithm restricts the metering rate when the downstream speed is less than the upstream speed. FLC produced 35 percent faster travel times and a 5 to 6 percent greater bottleneck capacity than two other controllers over a 6.8-mi (11-km) freeway section.
The Washington State Department of Transportation (WSDOT) operated two ramp metering algorithms in the greater Seattle area, the local metering algorithm and the bottleneck algorithm.(45) The local metering algorithm uses linear interpolation between measured mainline occupancy and appropriate metering rates for that occupancy. The bottleneck algorithm reduces the number of vehicles entering the freeway by the number of vehicles stored in a downstream bottleneck section. Both of these algorithms use queue overrides to flush the ramp queue when it becomes excessive. A fuzzy logic algorithm (FLA) is replacing the older algorithms to meter traffic on more than 100 ramps on Interstates 5, 405, and 90 and on State Route 520. Congestion at the I-90 study site was 8.2 percent lower with the FLA than with the local metering algorithm, while throughput was 4.9 percent greater. Some ramp queues decreased, while other increased slightly. However, the ramps had sufficient storage space, and given the mainline benefits, slightly longer ramp queues were acceptable. Results at the more congested I-405 test site were mixed. Mainline congestion increased by 1.2 percent with the FLA, while throughput increased slightly by 0.8 percent (as compared to the bottleneck algorithm). However, the fuzzy logic algorithm significantly reduced the time each ramp was congested by an average of 26.5 minutes.(46) A fuzzy logic control algorithm is under investigation to simultaneously control multiple ramps along a freeway section.(47,48)
Local traffic responsive metering, as used by Caltrans in Orange County, CA, establishes a floor below which the rate cannot fall. The local responsive ramp-metering algorithm that resides in the 170 controllers at the onramps operates as follows. First, a TOD rate is programmed into the 170 controller. This rate may be: alternatively (1) manually entered by a traffic engineer into the 170 controller in the field, (2) sent by a traffic management center operator to the 170 in the field, or (3) sent by area engineers from their office to the 170 in the field. Second, critical values for the average 3-min mainline volume/lane (currently 75 vehicles) and the average 1-min mainline occupancy/lane (currently 20 percent) are entered into the 170 controller. Third, a local responsive rate RLR, based on the actual mainline volume, for the number of vehicles released by the ramp is calculated as:
![]() (3-2)
(3-2)
where
VC = critical value of mainline traffic volume per lane for a 3-min period
VM = real-time mainline traffic volume per lane over 3 min
NRL = number of ramp lanes
and the factor of 3 converts the 3-min values into 1-min values.
Fourth, if the locally measured mainline volume is less than the critical value, then the local responsive meter rate is used, provided RLR is greater than the value in the TOD table. If the TOD rate is larger, then it is used. If the locally measured mainline volume is greater than the critical value, then the TOD rate is also used. Other versions of a local responsive ramp-metering algorithm can compare the actual mainline occupancy with the critical occupancy value and adjust the meter rate accordingly.(49)
Coordinated Traffic Responsive ControlIn this strategy, traffic flow data are analyzed at a central traffic management center that simultaneously adjusts the metering rates at several ramps. The metering rates are found from the analysis of the demand and capacity of an entire freeway section rather than traffic conditions in the immediate vicinity of individual ramps. A conceptual representation of a coordinated traffic responsive ramp control system is shown in Figure 3-10.
Figure 3-10. Conceptual coordinated traffic responsive ramp control system.
A linear programming model is often used to calculate sets of integrated metering rates for each ramp based on the expected range of capacity and demand. The appropriate metering rate at each ramp is then selected from these precomputed sets, based on real-time measurement of freeway conditions.(38) In another approach, the temporal and spatial characteristics of the traffic flow pattern on the freeway and affected surface streets are used as inputs to a metering rate optimization algorithm.(50)
In the United States, applications of coordinated ramp metering are found in Long Island, NY, Seattle, WA, Denver, CO, and Los Angeles, CA. The Los Angeles system wide adaptive ramp metering (SWARM) model implemented by Caltrans can activate one of three algorithms in an attempt to avoid breakdown in the flow-density regime.(51) The first algorithm, SWARM 1, adjusts rates at ramps upstream of a bottleneck in an attempt to maintain an acceptable level of service in the region of the bottleneck. The second and third algorithms, SWARM 2 and 3, are local responsive in nature. SWARM 2 is headway based, and SWARM 3 is density based. SWARM 1 estimates freeway conditions 10 to 15 min into the future using a Kalman filter.
As depicted in Figure 3-11, the SWARM 1 algorithm clamps down on the metering rates at time t0 to prevent a bottleneck from occurring later at time t1. The algorithm establishes the extent of the flow rate reduction propagated upstream through user-selected factors that control the propagation rate of the flow restriction. Data from either several links or the entire freeway can be used to establish the metering rate. When a queue override condition is in force, the metering goes to the maximum rate, rather than continuous green, to maintain platoon dispersion.
Figure 3-11. Principles of SWARM 1 ramp metering algorithm.
In Europe, two coordinated ramp metering approaches have been developed as part of DRIVE projects: the Metaline strategy and the Sirtaki strategy. The Metaline strategy is based on a linear quadratic integral control law that minimizes the deviation of selected bottleneck densities from their desired values by modifying the onramp flows. The Sirtaki strategy is built around the SIMAUT simulation model. SIMAUT incorporates coordinated ramp metering strategies based on demand-responsive control.(52) In case of an incident, control strategies can be simulated and analysis aided by the model's ability to reconstruct the current traffic stream in real time.
A summary of ramp metering rates provided by different metering methods is found in Table 3-3 in order of metering method preference.(3)
Ramp metering method |
Number of metered lanes |
Approximate metering rate, v/h |
Comments |
|---|---|---|---|
Single vehicle entry per green interval |
1 |
240-900 (54) |
|
Tandem metering with single vehicle entry per green interval per lane |
2 |
400-1700 |
|
Platoon metering with single lane multiple vehicle entry per green interval |
1 |
240-1100 (54) |
|
Mainline metering is one form of freeway mainline traffic management that also makes use of driver information systems, variable-speed control, lane closure, and reversible lane control. Individually or in combination, these control techniques are gaining acceptance at many highly congested freeway locations throughout the Nation. The role of sensors in mainline control is dependent on the selected operational strategy and its data requirements.
When mainline metering is applied, signals on the freeway mainline control flow rates in a manner similar to ramp metering. Mainline metering manages traffic demand at a mainline control point to maintain a desired level of service on the freeway downstream of the control location.
The desired level of service for mainline metering is selected to achieve one or several of the following objectives:
Mainline metering is found on the westbound lanes crossing the San Francisco-Oakland Bay Bridge, as illustrated in Figure 3-12. The signal bridge used for metering up to 16 lanes of traffic is located about 800 ft (244 m) downstream from the toll plaza, which contains 20 toll booths and 2 bypass lanes (used for carpools during peak traffic periods and buses all the time). During peak periods, two of the toll booth lanes convert into additional HOV lanes that bypass the metering. The lanes from the remaining toll booths are reduced to 12 metered lanes at the signal bridge prior to merging onto the 5-lane Bay Bridge. During offpeak periods and weekends, 14 lanes are metered. The metering produces a more flexible system that accommodates a mix of bus, carpool, and single passenger vehicles, allowing the bridge to operate at peak efficiency.
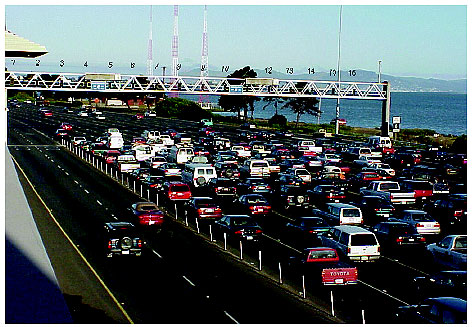
Figure 3-12. Mainline metering configuration on I-80 westbound crossing the San Francisco-Oakland Bay Bridge
(Photograph courtesy of Caltrans District 4, Oakland, CA).
Traffic accidents were reduced by 15 percent after the metering system was installed, with as many as 500 additional vehicles per hour crossing the bridge during peak periods. Fuzzy logic was utilized to control the queue length at the metering stations.(53) A new and enhanced fuzzy control system was developed to function with fewer sensor stations, lane occupancy data rather than station occupancy data, and new data validation algorithms. As reported by Caltrans (Sean Coughlin, Caltrans District 4, August 24, 1999), fuzzy control will be activated again once the original infrared sensors in each lane (set approximately 600 ft (183 m) apart) are replaced by dual magnetic sensors (approximately 1200 ft (366 m) apart).
Another application of mainline metering has operated since 1978 on Route 94 upstream of its junction with Route 125 in San Diego, CA. Ramps on Route 125 are metered, but the ramps on Route 94 are not. Mainline lanes of Route 94 are metered to offset the unbalanced upstream control.
A gantry, which contains a separate signal head for each of the three lanes (two conventional lanes and one HOV lane), is mounted over the roadway. During normal system operation from 6 to 9 a.m., each signal displays a green ball to allow one vehicle at a time to proceed in that lane. A passage sensor is located immediately downstream of the stop line. As the vehicle is detected, the signal turns red (no yellow interval is used during the metering operation, only during startup). The signal then remains red for the remainder of the metering cycle, which is set to achieve the desired flow rate. Extensive signing is placed in advance of the metering station to warn freeway traffic of the unusual event that they are about to encounter.
The success of the Route 94/125 mainline metering has encouraged the use of three other mainline metering stations on San Diego area freeways. One of these, located in El Cajon, is shown in Figure 3-13. Three lanes of southbound State Route 67 are metered as they join westbound Interstate 8. An internally illuminated sign displays the message "PREPARE TO STOP" during the metering operation. The metering signals are 12-inch (300-mm) standard 3-section heads centered on each lane and mounted on a 50-ft (15-m) mast arm.
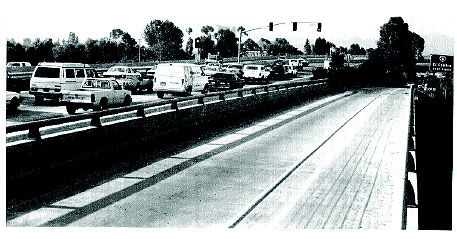
Figure 3-13. Freeway mainline metering at El Cajon, CA.
In Tokyo and Osaka, Japan, mainline metering has been implemented by regulating the number of toll booths that are open at any given time on the mainline of the expressways. Traffic entering the expressway system via the mainline is controlled based on expressway demand and downstream capacity. Such control is rather coarse, however, and might not be appropriate for all bottleneck conditions.
Freeway-to-Freeway MeteringA third technique for managing recurring congestion is to meter freeway-to-freeway connector ramps. Experiences in Minneapolis, MN, and San Jose, San Diego, Los Angeles, and Orange County, CA, indicate that significant benefits can be achieved with connector metering under conditions similar to those associated with ramp metering. Freeway connectors often have per-lane flow rates greater than 900 v/h (the maximum possible with single entry metering). Metering rates exceeding this figure are achieved by two-lane metering or possibly platoon metering. Such configurations work best when there is an added lane downstream from the onramp.
Figure 3-14 illustrates connector metering from the eastbound I-105 Freeway onto the southbound I-605 Freeway in Norwalk, CA. Meters on the two I-105 lanes allow three vehicles per lane during each green cycle to enter the four lanes of the I-605 mainline. One of the two I-105 ramp lanes continues as a fifth mainline lane.(49)
Storage capacity is another issue that affects the metering of freeway-to-freeway connectors. As with onramps, queues are not allowed to extend upstream where they might interfere with other freeway movements. In addition, end-of-queue protection must be provided with automatic warning signs to prevent rear-end collisions.
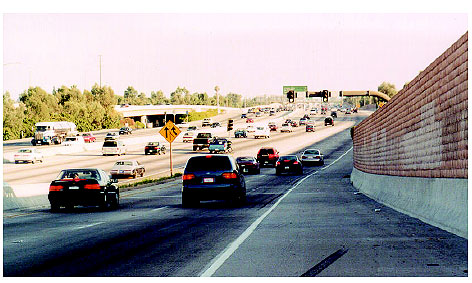
Figure 3-14. Freeway-to-freeway metering at the junction of the I-105 and I-605 freeways in Norwalk, CA
(Photograph courtesy of Lawrence A. Klein).
Safety problems occur when the design speed for certain curves is below that of other portions of the freeway. To lessen the crash potential at such locations, a speed measurement system that incorporates a flashing display to alert the driver to an unsafe speed can be used. Thus, if a vehicle is traveling faster than the desired or safe speed, a flashing sign or signal is activated to advise the driver to reduce the speed of the vehicle, as shown in Figure 3-15.
Figure 3-15. Warning sign alerting drivers to unsafe speed.
One system that was evaluated used loops spaced 16 ft (4.8 m) apart to measure speed.(54) A display was attached to a bridge structure downstream of the loop to alert the driver. If the vehicle was detected traveling 62 mi/h (100 km/h) or less, only the speed was displayed. If the vehicle was traveling faster, an additional SLOW DOWN message was displayed along with the speed. The study concluded that a speed detection system was effective in inducing drivers to reduce vehicle speed.
Unfortunately, at one such installation, drivers were observed deliberately accelerating to see how high a reading they could achieve on the speed sign. A potential solution to this problem would be to display speed values only up to the existing speed limit. Any speed above the limit would receive the message SLOW DOWN or YOU ARE EXCEEDING SPEED LIMIT.
Another speed measuring sensor was designed using modulated light emitting diodes. It was deployed to measure the speed and height of high and long trucks entering a curved freeway-to-freeway interchange. The diodes operated in the near-infrared spectrum at 880 nanometers. The signal modulation prevented interference from other sources of infrared energy, including sunlight. Two transmitter-receiver systems measured the vehicle speed and one measured the vehicle height. When trucks susceptible to rollover or jackknifing were encountered, flashers were activated to warn drivers to reduce speed.(55)
Corridor control applications that coordinate traffic flow on freeways and major surface arterials require improved monitoring of traffic to support faster incident detection, quicker prediction and notification of congested locations, ramp queue detection, and motorist information services. The strategies below assist in optimizing the design of corridor control systems and maximizing their utilization:
The I-10 Smart Corridor Program in Los Angeles, CA, applies this congestion management approach. The service region consists of the freeways and arterial surface streets in a geographic area along a 14-mile segment of the I-10 (Santa Monica) Freeway. Building on the existing infrastructure, it adds new or modifies existing capabilities, resources, and policies to provide interagency coordination that maximizes agency effectiveness. An expert system helps automate responses to congestion along the corridor. Fourteen changeable message signs (also referred to as variable message signs), 24 trailblazer signs, 350 real-time traffic controlled signals, 45 ramp meter stations, and about 3,000 inductive-loop detectors are used in the corridor.
The Information for Motorists (INFORM) corridor in the New York City metropolitan area is another example of the corridor approach to traffic management. INFORM incorporates 136 mi (219 km) of roadway, consisting of two freeways (the Long Island Expressway-I-495 and the Northern State Parkway-Grand Central Parkway combinations) and a number of parallel and crossing arterial streets. The corridor extends east from the Borough of Queens in New York City, through Nassau County and into Suffolk County. This corridor uses 80 changeable message signs, 112 real-time controlled signals, 70 ramp meter stations, and about 2,400 inductive-loop detectors.
Data collection is an essential part of any traffic engineering, planning, or operational activity. Advanced traffic management and traveler information services are supported by the collection of real-time traffic flow information on highway segments and surface street networks, especially during peak traffic flow periods.
Advanced traffic management and traveler information systems require real-time, online traffic data to effectively:
Traffic management data requirements are dependent on the application, whether it is to support real-time operational strategies, offline planning and administration, computation of measures of effectiveness, compilation of related statistics, verification of proper sensor operation, or research. The following sections discuss the traffic management functions supported by real-time and offline data acquisition and analysis and measures of effectiveness that require data collection to evaluate the performance of a traffic management strategy.
Table 3-4 lists typical demand and capacity management services and strategies that support real-time traffic operations. Demand management is typically advisory, while capacity management involves enforceable controls. Each strategy has its individual data requirements, including data type and format, measurement and update rates, precision, and data transmission bandwidth. For example, automatic incident detection associated with real-time freeway traffic management requires, as a minimum, traffic volume, occupancy, and speed data updated in 20- to 30-second intervals. Volume and occupancy provide measures of congestion and alert operations personnel to incidents. Speed data provide estimates of travel delay and level of service and are inputs to incident detection algorithms.
Environmental sensors are needed to supply data about current weather conditions and information that leads to warnings concerning blowing sand, roadway icing, or the presence of other hazards. This information can augment and assist in the interpretation of volume, occupancy, and speed data. Travelers may report some incidents over cellular or roadside telephones, while others are deduced from the volume, occupancy, and speed data provided by sensors. Once an incident is verified, complementary data from patrol vehicles or surveillance cameras are needed to determine incident severity and the resources required to clear the incident. Cameras, in turn, require the transmission of control signals for pan, tilt, zoom, and focus and the return of video imagery to the operations center.(49)
Traveler information services provided by kiosks, internet web sites, and roadside devices require the transmission of data that reflect the real time operational state of the highways, including location of incidents, predicted travel times, suggested alternate routes and transportation modes, and maintenance, construction, and special event locations and impacts. Often interagency and public-private partnership agreements are required to implement these strategies.
Service |
Strategy |
|---|---|
Demand management |
|
Traffic demand management |
High occupancy vehicle lanes, ramps, and connectors Toll road congestion pricing (public and private) Electronic road pricing (ERP) for entry into central business district during congested periods Diversion to surface streets Alternative transportation mode identification Fees for single occupant use of high occupancy vehicle lanes Parking advisories |
Motorist and traveler information |
Changeable message sign activation and updating Highway advisory radio operation Kiosk maintenance Web site maintenance Personal information access device data transmission Information service provider data exchange Interagency coordination |
Capacity management |
|
Traffic signal control |
Adaptive signal control algorithms that calculate and adjust cycle length, split, offset, and green band interval (bandwidth) in real time Left turn lanes activated by vehicle detection Automated red light enforcement |
Metering |
Ramp metering Mainline metering Freeway-to-freeway metering |
Incident management |
Automatic incident detection Incident verification Incident removal End of queue warning Alternative route diversion Onramp closure and metering Incident response teams for large or severe incidents Interagency coordination |
Hazard warning |
Rain and fog detection and motorist alert Ice and snow detection and motorist alert Dangerous curve, merge area, high wind, and rough pavement warnings Construction and maintenance lane closures and alerts End of queue detection Overheight and overweight detection and alert |
Commercial vehicle operations |
Data exchange in support of electronic clearance, credentialing, and weigh-in-motion |
Pollutant emissions enforcement |
Monitoring of carbon monoxide, hydrocarbons, and nitrogen oxides emitted at the tailpipe and evaporated Mandating use of alternate transportation modes |
Strategies for real-time arterial signal control generally u travel times from an upstream sensor to the stopline at the intersection, startup or lag time for vehicles discharging from the stopline, and discharge rates for vehicles at the stopline and in queues between an upstream sensor and the stopline. The types of data are gathered and the time interval over which the data is gathered depends on the category of traffic control system strategy being utilized.
Metering is performed through fixed time-of-day plans or by using sensors that monitor mainline traffic flow and adjust the ramp or feeder highway metering rates accordingly. In the latter application, the metering rate may be responsive to local mainline flow (e.g., flow upstream of the ramp) or to flow over a wider area or section of the freeway where metering among several ramps is coordinated.
Automated hazard warning requires sensors to detect inclement weather, road condition, or oversize or overweight vehicle. The information is then conveyed to the motorist through mobile or fixed changeable message signs, highway advisory radio, normal commercial radio, or special radios that allow sideband reception of traffic information. Commercial vehicles can receive warnings concerning overweight status through transducers mounted in the cab when weigh-in-motion sensors are installed. Large, lighted, and bright roadside signs are needed to warn drivers of fog. These signs must be repeated at frequent intervals to alert the motorist to the continued danger and reduced speed limits.(56,57)
Weigh-in-motion is the focus of two separate FHWA documents: McCall, Bill; Vodrazka, Walter C. Jr., States' Successful Practices Weigh-In-Motion Handbook, Dec. 15, 1997, available from the National Transportation Library, http://ntl.bts.gov/card_view.cfm?docid=6243, http://ntl.bts.gov/lib/6000/6200/6243/wim.pdf Data Collection Guide for SPS WIM Sites, August 31, 2001, www.fhwa.gov/pavement/ltpp/spstraffic/tmg.pdf |
Sensors used for electronic clearance and credentialing and weigh-in-motion enhance commercial vehicle operations. Analysis of transportation vehicle emissions also relies on sensors to gather the needed pollutant data.
Much of the information collected to execute the real-time functions of a traffic management system serves a secondary role as a valuable data resource for operations analyses and reviews, new construction and safety planning, highway research, and other administrative and planning services. The offline applications support a broad spectrum of users and uses, each requiring specific data, accuracy, precision, and spatial and temporal sampling. In recognition of the importance of archived data, an Archived Data User Service (ADUS) has been added to the U.S. National ITS Architecture and a five-year plan developed to support ADUS implementation.(58) Table 3-5 describes the types of archived data generally of interest in offline applications.(49)
Function/use |
Data |
|---|---|
Traffic census volumes |
Vehicle volumes by variable time intervals Vehicle classification counts Average speed by time periods High occupancy vehicle priority entry and facility usage Ramp usage by variable time intervals Vehicles by person occupancy Person and vehicle miles of travel |
Traffic congestion |
Average speed or travel time by time-of-day periods Congestion delay measurement |
Crash and incident events |
Crashes, types, trends, and rates Incidents, types, trends, and rates Commercial vehicle crash and incident locations and causes |
Event planning, construction, and maintenance lane closures |
Traffic volumes, time distribution, congestion levels Volume/capacity relationships Lane closure statistics (spatial and temporal) Volumes from parking facilities and their impact on local arterials and freeways Equivalent single axle loads |
Resource allocation and policy analyses |
Spatial and temporal traffic activity levels Spatial and temporal resource deployment Measures of effectiveness to support cost effectiveness analyses Origin-destination (O-D) data to support trend and policy option studies Electronic fare, transit automatic vehicle identification, and O-D data for intermodal transportation and land use analyses Incident statistics by type, location, time, season, weather Flow rate, density, truck use, speed, O-D, etc. data for research Pollutant emission concentrations by vehicle type, time-of-day, flow rate, speed, and vehicle miles traveled for air quality analyses High occupancy vehicle and transit usage to support effectiveness analyses |
The strategies used by a traffic management system should be evaluated periodically to assess the degree to which the system objectives are satisfied. Evaluations are also important to ensure that the needs of the stakeholders (e.g., the system operators and agencies that respond to real-time incidents and congestion, those involved with planning for future improvements, users of historical data, travelers, and allied agencies and private partners) are supported. The evaluation criteria are usually expressed in terms of measures of effectiveness. Many measures of effectiveness (MOEs) are based on sensor surveillance data collected by the traffic management system.
System-Wide MOEsA number of measures have traditionally been used to quantify the performance of freeway systems. These include:(59-62)
Detection of priority vehicles is associated with signal preemption and signal priority. Preemption interrupts or alters the normal signal sequence at an intersection in deference to a special situation, such as the passage of a train, a bridge opening, or the granting of the right of way to an emergency vehicle such as a fire engine, ambulance, or police car. Signal priority holds the green longer than normal or allows the signal to change to green as soon as possible in order to provide priority treatment for transit vehicles. |
Priority vehicles may either be emergency vehicles such as fire engines, ambulance, and police cars, or mass transit vehicles such as buses and trolleys. Emergency vehicles preempt the right-of-way by interrupting the normal phase sequence of the signals along the route to allow for their safe and rapid passage. After a preset time period, the signal returns to normal operation. With railroad preemption, train predictors (sensors provided by the railroad) detect the approach of a train and trigger a reaction, which first clears the track area and then allows nonconflicting green phases to operate during the passage of the train. Transit vehicles receive priority treatment by extending the green signal phase or changing the signal to green as soon as possible to expedite movement of the vehicle along its route. Transit priority is used less frequently than preemption for emergency vehicles, primarily because of concerns over disruption to surrounding traffic.(63) The response to different types of priority vehicles can be coordinated among several agencies and jurisdictions to provide a seamless travel corridor. In urban and rural traffic, travel time savings of 10 to 30 seconds and savings greater than 30 seconds per intersection, respectively, were reported when an emergency vehicle preempted a red signal during an ITS field operational test (FOT).(64)
Some emergency systems preempt the right-of-way without using sensors to detect emergency vehicles along the route. In these systems, a green indication is displayed at all signalized intersections along the selected route traveled by the emergency vehicle. The right-of-way is assigned by activating a switch from a central location, such as a fire station. A number of centrally controlled computerized signal systems preprogram the emergency progression, which leads to more efficient traffic flow than the manual switch-activation technique.
Detection systems used to detect priority vehicles either use transmitters mounted on the vehicles or roadside-mounted sensors that identify the priority vehicle by its signature (i.e., the information they receive by regularly scanning the roadway for the presence of these vehicles). |
There are two broad classes of priority vehicle detection systems. The first class uses transmitters or beacons mounted on the vehicle to identify it to receivers located near the controlled signal. Some transit vehicles transmit a signal to a central station, which in turn sends a priority command to the signal. The first class of priority vehicle detection systems includes high-intensity light beacons, RF beacons, infrared beacons, and inductive loops operating in conjunction with vehicle-mounted identification devices. The second class of priority vehicle detection systems does not require a beacon or transmitter on the vehicle. These sensors identify the priority vehicles through information they receive from the vehicle signature produced by the sensor. Included in this class of sensors are inductive loops that classify vehicles using algorithms that are incorporated into the detector electronics, laser radar sensors, and sound detection systems.
One of the first priority systems developed is the high-intensity light emitter/receiver system, which flashed light on and off at a high frequency coded to identify different vehicle types.(65) The receiver is able to distinguish between emergency vehicles coded for command preemption and transit vehicles that receive only priority treatment. Each intersection to be preempted is equipped with one or more optical receivers, depending on the number of approaches that provide preemption. As the emergency vehicle with the light emitter approaches the intersection, the appropriate directional receiver senses the coded light, triggering the preemption circuitry in the intersection controller. When the light from an emergency vehicle is detected, a signal is conveyed to a phase selector (connected to the controller) or directly to the controller. The status of the controller is examined and the controller either holds the green interval for the emergency vehicle or terminates the green on the opposing street(s), thus transferring the green to the direction of travel of the emergency vehicle. Priority vehicle operation is similar, except that the control function is not preempted. If the signal is green, the controller attempts to hold the green long enough for the priority vehicle to enter. If the light is not green, the controller attempts to activate the green phase as quickly as possible. Newer transit priority systems, which are centralized, first transmit the request for priority from the vehicle to a centralized transit management center and then from the center to the affected intersection. The components of the high-intensity light beacon system are similar to those shown below for the infrared beacon.
Another early signal priority system was the radio beacon. Each emergency or transit vehicle is equipped with a RF transmitter and each controlled intersection with a receiver. Since the transmitter in this system broadcasts the RF frequencies in all directions, it must also incorporate a direction code or provide limited preemption such as having all signals flash red. Furthermore, the detection range must be limited to avoid preempting nearby signals unnecessarily.
Another form of RF priority system is found on the buses in Aalborg, Denmark.(66) These vehicles are equipped with a driver's console, computer, global positioning system (GPS), and data radio. The driver inputs pertinent details about the current trip and an identifying journey number. The console informs the driver whether the vehicle is ahead or behind schedule, at which point the driver inputs the journey time in plus or minus form on the console display. Priority request information is transmitted by the vehicle to a centrally located base station when the vehicle crosses a report line. The base station can analyze all priority requests received and, if necessary, decide among conflicting requests before relaying the priority command to the affected signal. The base station also downloads GPS correction data every 10 to 20 seconds and new schedules and report lines as needed.
The GPS approach has become increasing popular in the United States as well. Communication techniques include transmission of priority requests from the bus to the control center by digital channels on the bus radio system and transmission of the signal priority command from the control center to the intersection using spread spectrum radio or optical links.
The infrared priority system relies on beacons or transmitters mounted on vehicles. As the vehicle approaches the intersection, it saturates the intersection with an encoded, infrared signal that is received, decoded, and validated to give the requesting vehicle priority. The type of signal priority is programmed into the electronics unit located in the controller cabinet. Figure 3-16 shows an example of beacon, receiver, and electronics units.
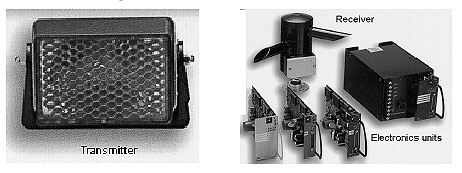
Figure 3-16. Infrared beacon priority system
(Courtesy of 3M Company, St. Paul, MN).
Inductive-loop detectors, in conjunction with electronics units designed to receive dozens of different codes from transmitters mounted on the underside of the vehicles, allow discrimination among emergency and transit vehicles. The transmitter in Figure 3-17 is disk shaped and is attached to the vehicle with a threaded shaft that extends from the disk. Its continuously transmitted programmed code is detected by any standard loop in the roadway. A special digital electronics unit interprets the code and identifies the vehicle or vehicle type. The electronics unit also provides conventional vehicle detection data. In addition to preemptive and priority control, the vehicle-mounted transmitter can also be used to override gate control, recognize vehicles at control positions or gasoline pumps, and correlate transit bus passage with schedules.
Another type of digital inductive-loop detector electronics unit eliminates the need for mounting a special transmitter on the vehicle. This system consists of a conventional loop buried in the roadway and a special digital electronics unit that transmits a high frequency excitation signal to the loop and receives a unique waveform (also termed the "signature" or "footprint") corresponding to each vehicle class it detects. When a waveform similar to that expected for a priority vehicle is identified, priority signal treatment is provided. The system can also be used to classify vehicles as described in Chapter 2.(67)
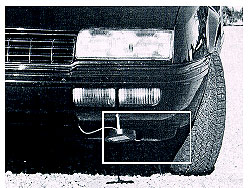
Figure 3-17. Transmitter mounted under a vehicle identifies it to a subsurface inductive-loop detector.
Its application to bus detection is illustrated in Figure 3-18. The digitized signature is input to a microprocessor that seeks and compares preidentified features to those of known bus profiles stored in memory. If a bus is identified, an output is generated to request priority treatment. Typical signatures for various classes of vehicles are shown in Figure 3-19.
Figure 3-18. Inductive-loop detection system for transit vehicles.
Figure 3-19. Representative vehicle signatures obtained from loops excited by high frequency signals from specialized electronics units.
Laser radar sensors that scan one or more traffic lanes are capable of supplying unique vehicle profiles. The vehicle's profile is classified by an algorithm incorporated into the sensor or stored in an auxiliary computer connected to the sensor through a serial interface. The traffic signal priority is adjusted according to the vehicle class. Although these sensors have the potential to differentiate between emergency and transit vehicles, this application of the sensor has not been demonstrated.
Sound detection systems, such as that illustrated in Figure 3-20, detect the sound energy emitted by sirens on emergency vehicles. Optional ultrasonic emitters are available to identify transit vehicles. A set of phased-array microphones, mounted on the mast arm, provides directionality to the source of the sound. A light can also be mounted to give visual verification that the signal priority request has been received.
Figure 3-20. Sound detection priority system for 4-way intersection control
(Courtesy of Sonic Systems, Vancouver, British Columbia, Canada).
The applications described above involved the detection of vehicles. However, properly timed actuated signal control also requires the detection of pedestrians. Unlike vehicles, pedestrians do not induce changes in the Earth's magnetic field, cause inductance variations, or otherwise produce signals that are easily detected by other sensors (an exception might be video detection, although this application has not been exploited to date). Moreover, pedestrians cannot be depended on to follow a specific path toward their intended destination, nor can they be expected to take a specific action to make their presence known to the signal controller.
Pedestrian detection is often a major consideration when developing traffic signal timing plans. Manually operated and automatic pedestrian sensors may be installed for this application. |
The push-button sensor, shown in Figure 3-21, is the most common form of pedestrian detection. The microswitch contact closure created when a pedestrian pushes the button causes a low-voltage current to flow to the controller and registers a "demand" for pedestrian service.
The weak link in the manually operated push-button system is the pedestrian, as it requires the pedestrian to be proactive in registering a demand. Unfortunately, many pedestrians do not make the necessary effort and, in those cases, are likely to cross the intersection illegally or unsafely. These pedestrians do not realize that pushing the button will extend their green time as well as service their needs faster.
Where two buttons for crossing in different directions are located on the same support, each button's relationship to the corresponding crosswalk must be clearly and unequivocally indicated. Although the Manual on Uniform Traffic Control Devices (MUTCD(68) specifies a series of standard signs for use with pedestrian push-button devices, many agencies augment these standard signs with additional instructional signs.
Figure 3-21. Manually operated pedestrian push button.
Active response pedestrian push buttons are common in the United States and Europe. When activated, they turn on a small light (usually green) or a small sign that flashes the message "WAIT PLEASE" or "WAIT FOR WALK." An example from England is shown in Figure 3-22. Such a response is a confirmation of the pedestrian's call for service similar to that of a lighted elevator button. This response to a call for a walk message appears to alleviate pedestrian anxiety from the lack of feedback from conventional manually operated push buttons and promotes understanding of the pedestrian phasing of the traffic signal.
Figure 3-22. Interactive pedestrian push button.
Another responsive crosswalk device is shown in Figure 3-23. Although not presently in the MUTCD, the device is increasing in popularity as it displays the time remaining for the pedestrian to cross the street.
Figure 3-23. Countdown timer showing time remaining for pedestrian crossing.
When visually impaired pedestrians use push buttons, some type of guiding device can be used to enable the pedestrian to locate the button. Texturing the concrete on the sidewalk approaching the push button, audible locators, or handrails can be used for this purpose.
Audible pedestrian signals are devices that emit buzzing, whistling, beeping, or chirping sounds that are correlated with the visual WALK/DON'T WALK signs used by sighted individuals. Intermittent pulses in the frequency range of 300-1,000 Hz (with 750 Hz being optimal) are the most effective sounds for the human ear to localize and do not require a high volume level to be effective. The devices may be either pedestrian activated or automatic. Pedestrian-activated signals are connected to the pedestrian call (push) button, which is connected to the signal controller. Automated signals are activated by the cycle change at pretimed intersections. Many of the automatic devices, such as that in Figure 3-24, emit different sounds to indicate which direction to cross and how much time is available for crossing. The two most popular audible pedestrian signals used in the United States emit either a buzzer or a birdcall sound. The audible signal most frequently used in the western United States emits a "peep peep" tone for the east-west direction and a "cuckoo" tone for the north-south crossings. Audible signals indicate only that the WALK indication is displayed, not that the intersection is clear. The devices are meant to complement rather than be a substitute for a visually impaired person's orientation and mobility skills.
Figure 3-24. Audible pedestrian signal device.
Several innovative pedestrian signal alternatives have been tested to detect the presence of pedestrians and provide safer crossing intervals. Instead of traditional pedestrian pushbutton devices, which require actuation, the new signal installations use pressure-sensitive mats or infrared sensors (mounted on poles) to detect the presence of pedestrians waiting to cross the street. After being detected, a pedestrian is given a white light, indicating that a WALK signal will follow. If pedestrians wait until the WALK signal is displayed, a second infrared sensor monitors their progress within the crosswalk and holds the pedestrian clearance interval (and red signal for motor vehicles) until the pedestrian reaches the other side of the street. Thus, slower pedestrians (e.g., elderly, wheelchair users) are given extended walking intervals. If the pedestrian steps off the curb too soon or leaves the crossing area, the request for a WALK signal is no longer valid, and NO WALK interval is given.
Other systems that alert drivers to the presence of pedestrians are illustrated in Figure 3-25. The pedestrian crosswalk lights in Figure 3-25a only flash when activated by the pedestrian. Therefore, the motorist receives real-time information indicating that a pedestrian is in the vicinity of the crosswalk. Figure 3-25b shows automatic detection of pedestrians at curbside and within an intersection using microwave radar sensors that activate a pedestrian call feature. At the same time, slower pedestrians detected within the on-street detection zones receive more time to cross the street. The detection of motion in the target area (for example, curbside) has the same effect as a pedestrian pressing a call button.
(a) Crosswalk lighting
(b) Microwave radar sensing
Figure 3-25. Pedestrian crossing safety devices.
Curves, hills, inclement weather, and natural and man-made visual obstructions often require advance warning signs to be installed to alert drivers to a red signal that lies ahead. Such a warning provides the extra time needed to bring the vehicle to safe stop. |
Advance driver alerts to a red signal ahead are often required when the geometrics of intersections do not permit the signal to be seen in time for drivers to react. In addition, there may be sight-distance restrictions due to overhead obstructions such as bridges and large trees, which cannot be removed. Intersections located on a downgrade may increase the actual required stopping distance.
Other potentially hazardous situations that involve traffic signals occur where signals are difficult to see at vertical curves that hide the queue at a signal, while not obstructing the signal itself. Another poor signal visibility situation arises in areas subject to dense ground fogs that reduce signal visibility below normal minimums.
To alleviate these dangerous situations and modify driver behavior, additional information may be provided to the driver and not be limited to a simple fixed sign that warns of a potential RED signal ahead. This type of tailored response is provided through changeable message advance warning signs. These signs have the capability to alter the displayed information based on whether the driver should slow or proceed. The warning sign shown in Figure 3-26 is used to alert approaching drivers that a hidden signal around a curve is red and that they must stop.
The criteria for a changeable message sign used in a red signal warning system include:
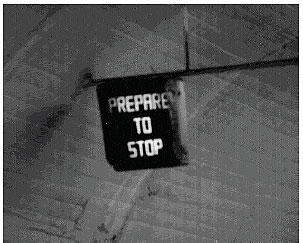
Figure 3-26. PREPARE TO STOP lighted sign.
When warranted, this type of flashing sign provides an effective solution to the problem of rear-end accidents. When actuated in such a manner that it provides the approaching drivers with accurate information as to whether they will have to stop for the signal, it is a beneficial addition to the signal installation.
Roadway mounted sensors are often used for vehicle counting and classification, over-height detection, and road surface and weather reporting. Both in-roadway and over-roadway sensors are used in these applications. |
In many locations, inductive-loop detectors and over-roadway sensors have replaced pneumatic tubes for counting vehicular traffic. Since the tubes are laid over the roadway, they are especially vulnerable to the wear and tear of passing traffic. The buried loops or over-roadway sensors provide a better means of counting. Moreover, should the loop or over-roadway sensor fail, all counting would stop. On the other hand, the tube tends to distort counts prior to failure. Another favorable aspect is that the loop and over-roadway sensors give only a single output for most vehicles, regardless of the number of axles, thus providing a more accurate count.
In addition to conventional traffic counts, a growing number of computerized signal systems are using loop and over-roadway sensors to provide volume data. The data collected by the sensors are output directly to the system computers, which control signal timing throughout the system.
It is not appropriate to generate multiple-lane vehicle counts by extending a single loop across several lanes. If a second vehicle in a different lane moves over part of a loop before the first vehicle has left its part of the loop, only one continuous output will be registered. This could lead to significant undercounting.
When lane discipline is good (i.e., traffic stays in its own lane), a separate loop should be placed in each lane. However, in some cases lane discipline is poor (i.e., traffic is continually changing lanes) and lanes are wide. If count accuracy is important for these instances, then an additional loop could be placed between the lanes, as shown in Figure 3-27. This depicts the three-loop layout for a two-lane roadway.
1 ft = 0.3 m
Figure 3-27. Three-loop layout for counts.
Ideally, the loops should be placed according to the following constraints:
The logic to be inserted into the vehicle count model is described as follows:(69)
Electronics units provide normal inductive-loop detector operation with timing functions (if desired) and also a secondary output of one pulse per vehicle in a single long loop or in a series of sequential short loops. Count accuracy for a single loop of any size is greater than 95 percent for properly functioning loop systems. Accuracy for the four loops in series configuration (discussed in Chapter 4) is lower because of the complexities associated with the analysis of its count output values.
When it becomes necessary to distinguish between the directions of travel (such as where two directions of traffic must use the same roadway facility as on a reversible lane), two loops, two electronics unit channels, and directional logic can be used as illustrated in Figure 3-28. With this system, separate counts are accumulated for each direction of travel. An alternative approach is to activate the appropriate loops and reversible lane control signals according to time-of-day programming.
1 ft = 0.3 m
1 in = 2.5 cm
Figure 3-28. Directional detection using point sensors.
As part of the traffic counting process, many agencies wish to obtain vehicle counts by class of vehicle. There are several vehicle classification counters commercially available. Many of these devices use loops and axle sensors to obtain the information required to classify vehicles as was discussed in Chapter 2. Other approaches use laser radar sensors to obtain vehicle class data. Many video image processors and presence-detecting microwave radar sensors can classify vehicles into three to five user-selected length bins.
Overheight sensors are deployed at approaches to tunnel portals, bridge underpasses, restricted height parking structures, and at other covered structures such as those found at weigh stations and toll facilities. Two types of sensor technologies are used for overheight detection. The first is an optical system that detects overheight vehicles when they interrupt or break the transmission of the beam from transmitter to receiver as depicted in Figure 3-29. The second, a laser radar, functions in much the same manner, except that it transmits longer wavelength energy in the near-infrared spectrum.
Figure 3-29. Overheight sensor configuration
(Picture courtesy of MBB SensTech, Munich, Germany).
Environmental observation systems are beneficial for tracking the location and movement of fronts and storm cells and providing needed information to traffic management agencies. In order for roadway weather sensors to obtain accurate data, they must be calibrated regularly. Such calibrated sensor data could then also be used to support the needs of the National Weather Service and improve the accuracy of pavement temperature forecast models. |
A variety of data can be gathered from weather information systems mounted on or near the roadway, including wind speed and direction, air temperature and humidity, precipitation type and rate, visibility, roadway surface temperature, roadway wet/dry status, and road surface chemical analysis for determining whether application of ice-reducing chemicals is warranted. Many of these systems are solar powered and can transmit data over wireless communications links. Specialized forward-scatter sensors are available for measuring visibility through fog and using the information to control brightly lighted signs that warn drivers of the reduced visibility conditions ahead.(57) Weather monitoring systems, such as the one in Figure 3-30, integrate many sensors to provide specific data for an application. Still other systems provide computer interfaces that display video and data on a monitor as illustrated in Figure 3-31.
In an evaluation of research on road weather observations and predictions, the Desert Research Institute (DRI) and the Nevada Department of Transportation (NDOT) concluded that Road Weather Information Systems (RWIS) provide data that improve weather forecasts, but that challenges remain in forecasting when ice will form on roads.(70) In tests of models that predict ice formation as a function of meteorological parameters, DRI found a large variation in the minimum pavement temperature from 19 °F to 10 °F (−7 to −12 °C). Minimum pavement temperature appeared to be most sensitive to air temperature changes, total cloud cover, and precipitation. Inaccuracies in air temperature of 34 and 36 °F (1 and 2 °C) caused a change in minimum pavement temperature of more than 33 and 34 °F (0.5 and 1 °C), respectively. Significant underestimation of precipitation changed minimum pavement temperature by about 36 °F (2 °C). Inaccurate cloud cover predictions caused changes in minimum pavement temperature of more than 37 °F (3 °C).
Figure 3-30. Integrated weather information system
(Picture courtesy of Nu-metrics, Uniontown, PA).
Figure 3-31. Weather imagery and data display
(Picture courtesy of System Innovations, Fredericksburg, VA).
Based on a 2004 National Academy of Sciences report that described the need for a robust, integrated weather observational and data management system, FHWA responded with an initiative called Clarus—the Nationwide Surface Transportation Weather Observing and Forecasting System.(71,72) The initiative's overall objective is to reduce the impact of adverse weather for all road and transit users and operators. The projected six-year Clarus program has been structured to include:
The requirement for increased vehicle safety on arterials and freeways has led to the development of vehicle-mounted sensors that support advanced cruise control functions such as headway and proximity detection, and issue warnings when lane divider markings are crossed. |
Table 3-6 gives examples of vehicle-mounted sensors that support various collision and hazard avoidance strategies and prevent specific types of crashes.(73) Headway detection advises the driver of an imminent crash with an obstacle or to maintain a safe distance when following another vehicle. Proximity detection gives the driver information about adjacent lane vehicles or obstacles while backing up. The lane position monitor advises the driver if the vehicle is drifting out of its travel lane. In-vehicle signing conveys posted or dynamic information to the driver from the traffic management infrastructure. A gap acceptance aid advises the driver when it is safe to cross or turn at intersections. Vision enhancement gives the driver a clearer image of the roadway and environment ahead during reduced visibility conditions such as heavy rain, fog, and nighttime.
However, sensors are not the only component of a hazard warning system. Human response time, the devices used to transmit the sensor information to the driver, and the dynamics of the encounter with a particular hazard are other factors that must be analyzed in designing a hazard warning system. A systems analysis approach reveals that uncertainty in human response time is the major factor affecting performance of an alerting system.(74) Thus, a system designed to protect slowly responding drivers may have a high unnecessary alert rate for rapidly responding drivers. Likewise, systems designed to have few unnecessary alerts also have relatively high crash rates. The way to combat this tradeoff is to decrease the response time uncertainty through driver training, improved display and audio alerts, or tuning each system to the driver using it. Although the systems methodology has been successful in modeling the performance of relatively simple systems such as a rear-end collision alert system, its extension to other applications requires more detailed dynamic models, probability distributions for a collision given an alert (obtained through Monte Carlo simulation), and inclusion of representative hazard variables such as driving speed and road condition.
Strategy |
Vehicle-mounted sensor |
Preventable crash |
|---|---|---|
Headway detection |
Millimeter-wave radar, laser radar, video |
Rear-end |
Proximity detection |
Millimeter-wave radar, ultrasonic |
Backing, lane change and merge |
Lane position monitor |
Laser radar, video, passive reflected light detector |
Road departure, opposite direction |
In-vehicle signing |
Video, infrared communications, microwave transponder |
Road departure, opposite direction, intersection, and crossing path |
Gap acceptance aid |
Video |
Intersection and crossing path |
Vision enhancement |
Millimeter-wave radar, passive far infrared, intensified CCD cameras |
Reduced visibility |
Automobile, truck, and bus use of radar sensors is projected to grow from worldwide revenues of $35 million (U.S.) in 1998 to between $300 and $500 million (U.S.) by 2003.(75) Automotive distance warning systems are a large part of this market, including front, side, and back radar to monitor obstacles. These systems calculate the distance from objects and their speed, if they are moving, and alert drivers if they are too close to another object or vehicle. Table 3-7 lists composite requirements for automotive radar distance warning systems.(76-78)
Radars designed for advanced adaptive cruise control provide the input to systems that automatically reduce vehicle speed and apply the brakes as the separation between approaching vehicles diminishes. Other smart cruise systems rely on highway-based sensors and appropriate in-vehicle systems to inform the driver of the presence and location of roadway obstacles, vehicles in an intersection, road surface condition, and pedestrians crossing streets.(79) A still more futuristic look at automatic vehicle control and guidance includes automatic highway systems. Here sensors are required to:
Parameter |
Dimensioning criteria |
Value |
|---|---|---|
Center frequency |
Compatible with government frequency allocation for the application |
24 or 76 to 77 GHz |
Waveform |
Capable of detecting presence and measuring the relative speed of vehicles within the range measurement interval |
Frequency modulated, continuous wave (FMCW) |
Azimuth field-of-view |
Large enough to detect a vehicles at sufficient range when the following vehicle is on a curved road section |
±8.5 degrees |
Antenna horizontal beamwidth |
Obtain a sufficiently high probability that all relevant vehicles will be resolved from each other |
1.5 degrees |
Range measurement interval |
Sufficient to include the distance to a car stopping ahead to the distance needed to reduce speed comfortably when a car is overtaken |
1 to 200 m (3.3 to 656 ft) |
Relative velocity of vehicles |
Ability to measure relative speed of approaching and departing vehicles |
-50 to +100 m/s (-112 to +224 mi/h) |
Update rate |
Fast enough to match the vehicle longitudinal control servo bandwidth with the reaction times |
10 to 20 Hz |
Mounting position |
Obtain view of critical areas with radar waveform able to penetrate vehicle body materials, such as by placing antenna behind a plastic bumper or plastic grill |
¾ |
Radar sensors operating over shorter distances are finding applications in park distance control and airbag precrash detection, especially for side airbags. The frequencies being considered for these radars are 24 and 77 GHz. Laser radars can also potentially be used for the precrash detection application. Ultrasonic sensors are available from original equipment and aftermarket manufacturers for park distance control and obstacle detection.
In-vehicle sensing functions are likely to be performed by optical sensors, either in the visible or infrared wavelength bands. Three-dimensional camera chips for passenger detection are in development for this purpose. In-vehicle sensing is proposed to control inflation of the smart airbag based on the shape and position of the occupant on each seat. Occupant data could also support automatic validation of high occupancy vehicle lane use and calculation of fees for occupant-based services.
Night vision systems that utilize uncooled infrared detectors such as barium strontium titanate are scheduled for insertion into high-end passenger vehicles beginning with year 2000 models.(82) Lane tracking systems, such as Autovue shown in Figure 3-32, aid drivers of trucks and passenger vehicles in staying within prescribed lanes. This in-vehicle camera detects painted lines or other markers at the lane edges and sounds an alarm to alert the driver when the vehicle deviates from the center of the lane, but before the vehicle crosses the lane marker.
Another lane deviation sensing system utilize a laser diode to scan the roadway for paint that serves as a lane demarcator. In addition to the small glass spheres embedded in the paint, an external coating of spheres is often applied to a painted stripe to enhance the retroreflectivity of the marking. Since the road surface generally has low reflectivity, the energy backscattered from the paint and road surface is different and detectable by a scanning laser sensor.(83)
Figure 3-32. Autovue lane tracking sensor
(Photograph courtesy of Iteris, Inc., Anaheim, CA).
A third method proposed for lane position monitoring utilizes a passive sensor, available light, and current road striping practice. The sensor consists of a cylindrical lens and a silicon crystal detector. Figure 3-33 shows the voltage generated as a prototype sensor scans across the lane centerline. The voltage is proportional to the location of the line's centroid.(84) The scan voltage is monotonic, smooth, and fairly linear in the central 50 percent of the plot. In this example, the detector output voltage is nonzero when the lane is physically centered on the detector. This indicates that overall background light falling on the detector is nonuniform, in this case produced by external sources in the sensor's field of view. Baffling is under consideration to eliminate the voltage offset.
Voltage is proportional to centerline location in the sensor's field of view. The contrast between the lane lines and the background in reflected sunlight was 0.57. The scan length was approximately 64 inches (163 cm) and the sensor declination was 21 degrees. |
1 cm = 0.4 inch
Figure 3-33. Output voltage generated by passive lane positioning sensor.
FHWA-HRT-06-108

