Surrogate Safety Assessment Model and Validation: Final Report
PDF files can be viewed with the Acrobat® Reader®
Chapter 3. Theoretical Validation (Continued)
Case 8: Mid-Block U-Turn Versus Left Turn at Signalized Intersection (VISSIM)
The primary objective of the median U-turn design is to remove all left-turn traffic from the main intersection. In this configuration, all left-turn movements are converted to right turns at the intersection and then use uni-directional median crossovers to make U-turns onto major roads to complete their change of direction, as shown in figure 87.(15)
This type of design favors the major street through-movement because time from the signal cycle does not have to be allocated to protected left-turn phases. Because it is possible to control the median U-turn intersection with a simple two-phase cycle, it also eliminates lost time associated with the left-turn phases and facilitates coordinated progression along high-volume arterial corridors. This design also removes (or relocates, for unsignalized median U-turns) all of the conflicts that would normally be associated with left-turn movements. Thus, crashes directly associated with left-turn movements are effectively eliminated. It is understood that the exposure to crashes associated with higher right turn and U-turn volumes would likely increase, although these types of crashes are generally less severe than left-turn crashes.
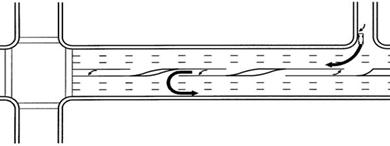
Figure 87. Illustration. Mid-Block U-Turn at Signalized Intersection.
From the perspective of bicycles and pedestrians, the median U-turn design presents fewer threats. Although this design requires a longer time to cross the major roadway, the median can also serve as a refuge area for pedestrians; however, the crossing time can be longer and require two-cycle pedestrian signals.
This study compares the mid-block U-turn design with conventional signal control to evaluate the ability of the mid-block U-turn approach to reduce the number of crossing conflicts.
Intersection Description
The intersections used for this test are shown in figure 88 and figure 89.
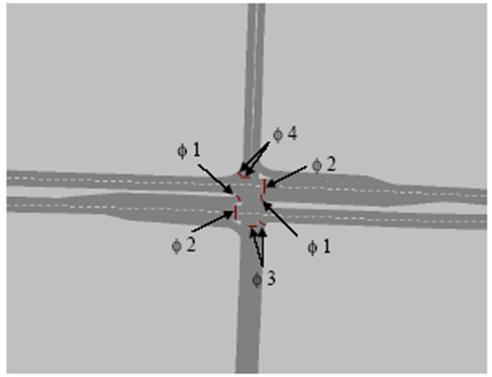
Figure 88. Screen Capture. Conventional Intersection in VISSIM.
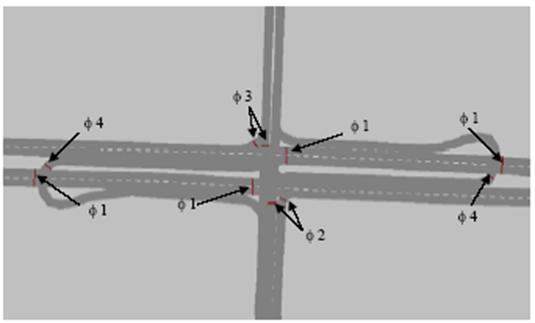
Figure 89. Screen Capture. Intersection with Median U-Turn in VISSIM.
Table 53 shows traffic volumes applied to each approach of the intersection. Fully-actuated traffic control is applied in this test. Figure 90 through figure 95 indicate the timing plans used for each testing scenario.
Table 53. Case 8 Service Flow by Each Approach.
Approach |
Southbound |
Northbound |
Eastbound |
Westbound |
| L |
TH |
R |
L |
TH |
R |
L |
TH |
R |
L |
TH |
R |
Phase ID (Four Phase) |
3 |
3 |
3 |
2 |
2 |
2 |
4 |
1 |
|
4 |
1 |
|
Low Volumes |
25 |
75 |
25 |
50 |
100 |
50 |
75 |
650 |
125 |
75 |
650 |
125 |
Medium Volumes |
50 |
150 |
50 |
100 |
200 |
100 |
150 |
1,300 |
150 |
150 |
1,300 |
150 |
High Volumes |
100 |
200 |
100 |
150 |
200 |
150 |
200 |
1,400 |
200 |
200 |
1,400 |
200 |
Note: L, TH, and R correspond to vehicles proceeding left, through, or right at the intersection.
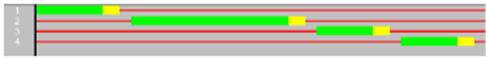
Figure 90. Illustration. Timing Plan Conventional Intersection in Low Volumes
(Cycle: 80; Split: 12, 28, 10, 10).
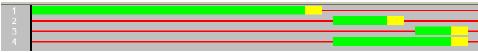
Figure 91. Illustration. Timing Plan for Median U Turn in Low Volumes
(Cycle: 80; Split: 49, 9.5, 6.5, 21).

Figure 92. Illustration. Timing Plan for Conventional Intersection in Medium Volumes
(Cycle: 80; Split: 12, 28, 10, 10).
Figure 93. Illustration. Timing Plan for Median U Turn in Medium Volumes
(Cycle: 80; Split: 49, 9.5, 6.5, 21).
Figure 94. Illustration. Timing Plan for Conventional Intersection in High Volumes
(Cycle: 80; Split: 12, 28, 10, 10). 0it: 12,28,10,10).0,10).
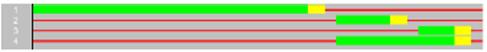
Figure 95. Illustration. Timing Plan for Median U Turn in High Volumes
(Cycle: 80; Split: 49, 9.5, 6.5, 21).
Data Analysis and Comparison Results
Ten replications were performed for each simulation scenario, and the resulting output trajectory data was analyzed by SSAM. F-tests and t-tests were applied to compare the average number of conflict events and surrogate measures of safety between the two design options. Table 54 through table 58 list the values of all surrogate measures of safety and corresponding t-test results for different types of aggregations with the low- speed events and crash data excluded (TTC ≤ 0 and MaxS ≥ 16.1 km/h (10mi/h)).
Table 54. Case 8 Comparison Results for Total Conflicts.
Total |
TTC ≤ 0.5 |
TTC ≤ 1.0 |
TTC ≤ 1.5 |
|
CON |
MED U |
CON |
MED U |
CON |
MED U |
Low Volume Mean |
N/A |
N/A |
0.5 |
1.1 |
35.8 |
41.3 |
Variance |
N/A |
N/A |
0.500 |
1.433 |
63.511 |
61.122 |
t-value(95%), difference (%) |
N/A |
-1.365 |
-1.558 |
Medium Volume Mean |
N/A |
N/A |
2.1 |
2.4 |
96.7 |
87.3 |
Variance |
N/A |
N/A |
1.433 |
2.489 |
50.011 |
92.900 |
t-value(95%), difference (%) |
N/A |
-0.479 |
2.487, 9.72% |
High Volume Mean |
1.2 |
0.8 |
3.8 |
3.2 |
115.6 |
100.1 |
Variance |
2.400 |
0.844 |
4.400 |
5.289 |
199.156 |
42.767 |
t-value(95%), difference (%) |
0.702 |
0.610 |
3.151, 13.41% |
Note: Shaded cells indicate statistically significant differences between the two alternatives.
This table shows that the median U-turn design intersection shows fewer total conflicts at medium and high volumes. Also, in either design case, very few conflict events occur with TTC ≤ 1.0 s.
Table 55. Case 8 Comparison Results for Crossing Conflicts.
Crossing |
TTC ≤ 0.5 |
TTC ≤ 1.0 |
TTC ≤ 1.5 |
|
CON |
MED U |
CON |
MED U |
CON |
MED U |
Mean |
N/A |
N/A |
N/A |
N/A |
0.3 |
0.9 |
Variance |
N/A |
N/A |
N/A |
N/A |
0.456 |
0.989 |
t-value(95%), difference (%) |
N/A |
N/A |
-1.579 |
Mean |
N/A |
N/A |
N/A |
N/A |
0.5 |
1.1 |
Variance |
N/A |
N/A |
N/A |
N/A |
0.944 |
0.989 |
t-value(95%), difference (%) |
N/A |
N/A |
-1.365 |
Table 56. Case 8 Comparison Results for Rear-End Conflicts.
Rear End |
TTC ≤ 0.5 |
TTC ≤ 1.0 |
TTC ≤ 1.5 |
|
CON |
MED U |
CON |
MED U |
CON |
MED U |
Low Volume Mean |
N/A |
N/A |
N/A |
N/A |
29.5 |
30.3 |
Variance |
N/A |
N/A |
N/A |
N/A |
67.611 |
50.233 |
t-value(95%), difference (%) |
N/A |
N/A |
-0.233 |
Medium Volume Mean |
N/A |
N/A |
N/A |
N/A |
83.6 |
72.1 |
Variance |
N/A |
N/A |
N/A |
N/A |
36.711 |
64.100 |
t-value(95%), difference (%) |
N/A |
N/A |
3.622, 13.76% |
High Volume Mean |
N/A |
N/A |
N/A |
N/A |
97.4 |
80.8 |
Variance |
N/A |
N/A |
N/A |
N/A |
93.378 |
45.733 |
t-value(95%), difference (%) |
N/A |
N/A |
4.451, 17.04% |
Note: Shaded cells indicate statistically significant differences between the two alternatives.
This table shows that the median U-turn intersection has fewer rear-end conflicts at medium and high volumes than the conventional intersection. There are no events that occur with TTC < 1.0 s.
Table 57. Case 8 Comparison Results for Lane-Change Conflicts.
LC |
TTC ≤ 0.5 |
TTC ≤ 1.0 |
TTC ≤ 1.5 |
|
CON |
MED U |
CON |
MED U |
CON |
MED U |
Low Volume Mean |
N/A |
N/A |
N/A |
N/A |
6.2 |
9.8 |
Variance |
N/A |
N/A |
N/A |
N/A |
4.178 |
7.733 |
t-value(95%), difference (%) |
N/A |
N/A |
-3.299, -58.06% |
Medium Volume Mean |
N/A |
N/A |
1.2 |
1 |
12.8 |
14.3 |
Variance |
N/A |
N/A |
1.067 |
1.333 |
7.733 |
11.567 |
t-value(95%), difference (%) |
N/A |
0.408 |
-1.080 |
High Volume Mean |
1.2 |
0.8 |
2.8 |
2.2 |
17.7 |
18.2 |
Variance |
2.400 |
0.844 |
4.178 |
2.622 |
29.344 |
7.067 |
t-value(95%), difference (%) |
0.702 |
0.728 |
-0.262 |
Note: Shaded cells indicate statistically significant differences between the two alternatives.
This table shows that there is no significant difference for the number of lane-change conflicts between the two scenarios, except a significant increase in the number of lane-change events for median U-turns at low volumes.
Table 58. Case 8 Comparison Results for Average Surrogate Measures of Safety.
| |
TCON |
TMED U |
CCON |
CMED U |
RECON |
REMED U |
LCCON |
LCMED U |
TTC (low) |
1.4 |
1.39 |
N/A |
N/A |
1.4 |
1.4 |
1.37 |
1.33 |
t -value, diff(%) |
1.144 |
N/A |
0.000 |
1.148 |
TTC (med) |
1.38 |
1.37 |
N/A |
N/A |
1.39 |
1.38 |
1.32 |
1.33 |
t -value, diff(%) |
1.515 |
N/A |
1.587 |
-0.334 |
TTC (high) |
1.36 |
1.36 |
1.4 |
1.34 |
1.38 |
1.38 |
1.25 |
1.27 |
t -value, diff(%) |
0.000 |
0.675 |
0.000 |
-0.584 |
PET(low) |
2.69 |
2.65 |
N/A |
N/A |
2.74 |
2.72 |
2.42 |
2.43 |
t -value, diff(%) |
0.742 |
N/A |
0.364 |
-0.066 |
PET(med) |
3.08 |
3.05 |
N/A |
N/A |
3.16 |
3.13 |
2.54 |
2.68 |
t -value, diff(%) |
0.770 |
N/A |
0.765 |
-1.130 |
PET(high) |
3.15 |
3.05 |
2.96 |
2.45 |
3.26 |
3.14 |
2.56 |
2.7 |
t -value, diff(%) |
2.571, 3.17% |
1.143 |
3.322, 3.68% |
-1.003 |
MaxS(low) |
6.42 |
6.46 |
N/A |
N/A |
6.32 |
6.28 |
6.93 |
7.07 |
t -value, diff(%) |
-0.321 |
N/A |
0.328 |
-0.364 |
MaxS(med) |
7.44 |
7.31 |
N/A |
N/A |
7.51 |
7.15 |
7.05 |
8.19 |
t -value, diff(%) |
1.148 |
N/A |
3.012, 4.79% |
-3.559, -16.17% |
MaxS(high) |
7.62 |
7.69 |
5.32 |
6.33 |
7.61 |
7.44 |
7.77 |
8.9 |
t -value, diff(%) |
-0.658 |
-3.469, -18.98% |
1.535 |
-3.735, 14.54% |
DeltaS(low) |
5.76 |
5.76 |
N/A |
N/A |
5.75 |
5.67 |
5.83 |
6.01 |
t -value, diff(%) |
0.000 |
N/A |
1.013 |
-0.734 |
DeltaS(med) |
4.37 |
4.23 |
N/A |
N/A |
4.25 |
3.99 |
5.09 |
5.35 |
t -value, diff(%) |
1.489 |
N/A |
2.551, 6.12% |
-1.192 |
DeltaS(high) |
3.26 |
4.04 |
5.32 |
6.33 |
3.11 |
3.88 |
4.01 |
4.64 |
t -value, diff(%) |
-9.119, -23.93% |
-3.469, -18.98% |
-8.284, -24.76% |
-2.965, -15.71% |
DR(low) |
-2.78 |
-2.76 |
N/A |
N/A |
-2.77 |
-2.78 |
-2.82 |
-2.69 |
t -value, diff(%) |
-0.625 |
N/A |
0.521 |
-0.931 |
DR(med) |
-2.42 |
-2.38 |
N/A |
N/A |
-2.38 |
-2.29 |
-2.68 |
-2.77 |
t -value, diff(%) |
-0.967 |
N/A |
-2.266, 3.78% |
0.572 |
DR(high) |
-2.17 |
-2.38 |
-2.45 |
-2.83 |
-2.1 |
-2.31 |
-2.53 |
-2.66 |
t -value, diff(%) |
4.548, -9.68% |
1.422 |
5.338, -10.00% |
0.665 |
MaxD(low) |
-2.95 |
-2.99 |
N/A |
N/A |
-2.9 |
-2.9 |
-3.2 |
-3.28 |
t -value, diff(%) |
0.879 |
N/A |
0.000 |
0.378 |
MaxD(med) |
-2.88 |
-2.88 |
N/A |
N/A |
-2.79 |
-2.74 |
-3.44 |
-3.59 |
t -value, diff(%) |
0.000 |
N/A |
-1.869 |
0.677 |
MaxD(high) |
-2.88 |
-2.92 |
-3.7 |
-3.29 |
-2.64 |
-2.76 |
-4.16 |
-3.62 |
t -value, diff(%) |
0.796 |
-0.416 |
4.230, -4.55% |
-2.227, 12.98% |
MaxDeltaV(low) |
2.94 |
2.96 |
N/A |
N/A |
2.93 |
2.92 |
2.98 |
3.08 |
t -value, diff(%) |
-0.424 |
N/A |
0.210 |
-0.684 |
MaxDeltaV(med) |
2.23 |
2.14 |
N/A |
N/A |
2.17 |
2.02 |
2.59 |
2.71 |
t -value, diff(%) |
1.865 |
N/A |
2.856, 6.91% |
-1.076 |
MaxDeltaV(high) |
1.67 |
2.06 |
2.66 |
3.16 |
1.59 |
1.97 |
2.05 |
2.39 |
t -value, diff(%) |
-8.890, -23.35% |
-3.504, -18.80% |
-7.982, -23.90% |
-3.101, -16.59% |
Note: Shaded cells indicate statistically significant differences between the two alternatives. The tan and blue colors indicate extreme values to the right and left columns respectively.
This table indicates that, for most of the measures, the average values of both severity- and probability-related surrogates are worse for the median U-turn design.
Correlations with Predicted Crash Frequency
Because there is no crash prediction model for median U-turn intersections, no correlation test can be performed.
Findings and Conclusions
Based on the above observations, the following conclusions can be drawn:
- The median U-turn intersection generates fewer total and rear-end conflicts than the conventional intersection.
- There are very few crossing conflicts for both scenarios.
- Most of the conflicts have TTC values greater than 1.0 s.
- The conventional intersection exhibits more favorable average values for most of the surrogate measures related to both the severity and probability of crashes.
The reduction in the number of conflicts is consistent with the conventional understanding of the safety impact of median U-turns, but the increase in the severity of the average values of surrogate measures is counter-indicative.
Case 9 and 10: Single Roundabout Versus Four- and Three-Approach Intersections (AIMSUN)
Roundabouts were first applied in Europe and have achieved significant results, such as reduced travel delay, reduced crash rates, and when crashes do occur, reduced crash severity. Modern roundabouts are circular intersections that incorporate channelized approaches, yield control, and design geometry that facilitate moderate operating speeds, typically less than 48.3 km/h
(30 mi/h).(22) They differ from other types of circular intersections (rotaries, traffic circles, etc.) in terms of their operational traffic patterns. Under the right conditions, a properly designed roundabout is thought to offer safety and efficiency benefits greater than conventional intersections.(23)
Roundabouts may improve the safety of intersections by eliminating or altering conflict types, reducing speed differentials at intersections, and forcing drivers to decrease speeds as they proceed into and through intersections. Figure 96 presents a diagram of vehicle-vehicle conflict points for a traditional four-leg intersection and a four-leg roundabout intersection of two-lane roads. Notice that the number of vehicle-to-vehicle conflict points for four-leg intersections drops from 32 to 8 with roundabouts. Figure 97 presents a diagram of vehicle-vehicle conflict points for a traditional three-leg, T-intersection and a three-leg roundabout. As the figure shows, the number of vehicle-to-vehicle conflict points for roundabouts decreases from nine to six for three-leg intersections. Fewer conflict points is conventionally understood to indicate that there are fewer opportunities for collisions.(16)
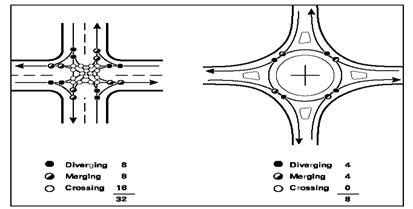
Figure 96. Illustration. Conflict Points for Intersections with Four Single-Lane Approaches.(23)
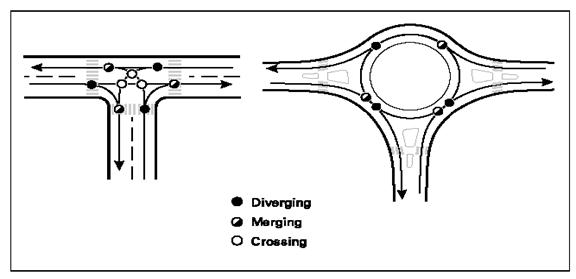
Figure 97. Illustration. Conflict Points for T-Intersections with Single-Lane Approaches.(23)
This study examines these effects by comparing a typical single roundabout to a comparable eight-phase, four-approach conventional intersection and a comparable T-intersection.
Intersection Description
Case 9: Single four-approach roundabout versus four-approach intersection
The intersections used for this test are shown in figure 98 and figure 99. All left-turn bays are 76.25 m (250 ft) long.
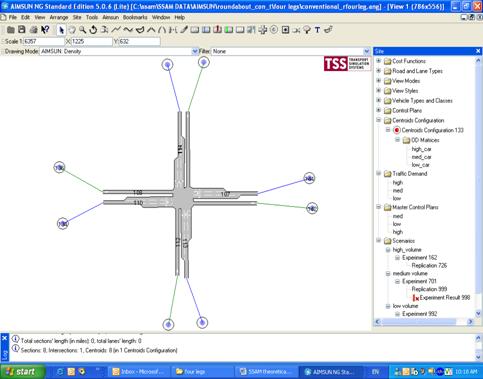
Figure 98. Screen Capture. Conventional Intersection in AIMSUN.
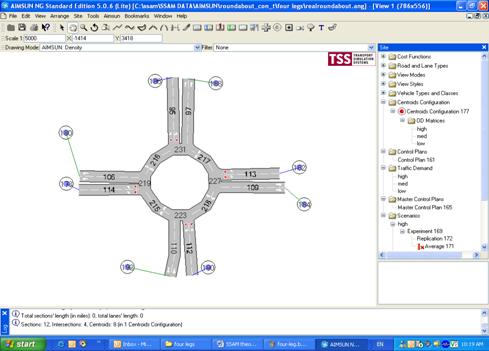
Figure 99. Screen Capture. Four-Approach Roundabout in AIMSUN.
Table 59 shows the traffic volumes applied to each approach of the intersection. Fixed-time traffic control is used in the conventional intersection design for this test. Figure 100 through figure 102 indicate the timing plans used for each testing scenario.
Table 59. Case 9 Service Flow by Each Approach.
| Approach |
Southbound |
Northbound |
Eastbound |
Westbound |
| L |
TH |
R |
L |
TH |
R |
L |
TH |
R |
L |
TH |
R |
| Phase ID (Four Phase) |
3 |
4 |
4 |
7 |
8 |
8 |
5 |
2 |
2 |
1 |
6 |
6 |
| Low Volumes |
75 |
100 |
25 |
75 |
100 |
25 |
75 |
100 |
25 |
75 |
100 |
25 |
| Medium Volumes |
150 |
200 |
50 |
150 |
200 |
50 |
150 |
200 |
50 |
150 |
200 |
50 |
| High Volumes |
200 |
200 |
200 |
200 |
200 |
200 |
200 |
200 |
200 |
200 |
200 |
200 |
Note: L, TH, and R correspond to vehicles proceeding left, through, or right at the intersection.
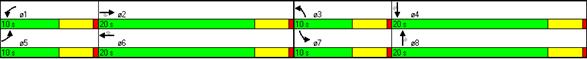
Figure 100. Screen Capture. Timing Plan for Conventional Intersection in Low Volumes.
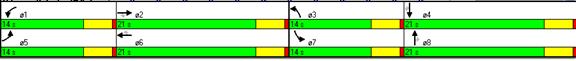
Figure 101. Screen Capture. Timing Plan for Conventional Intersection in Medium Volumes.
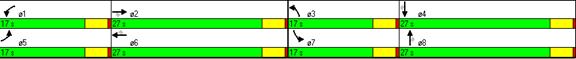
Figure 102. Screen Capture. Timing Plan for Conventional Intersection in High Volumes.
Case 10: Single three-approach roundabout versus T-intersection
The intersections used for this test are shown in figure 103 and figure 104.
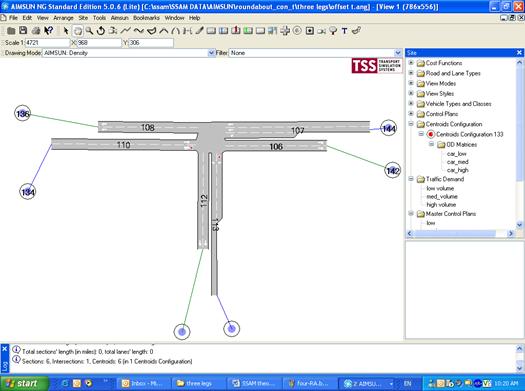
Figure 103. Screen Capture. T-Intersection in AIMSUN.
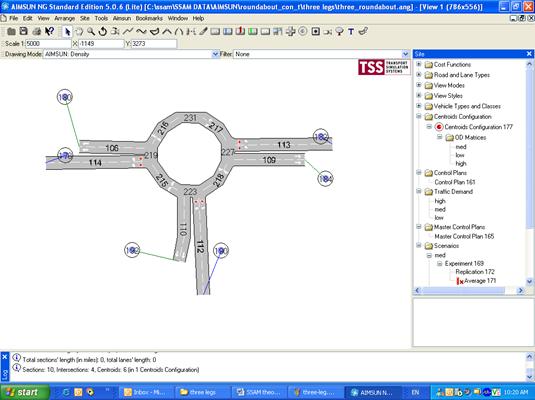
Figure 104. Screen Capture. Three-Approach Roundabout in AIMSUN.
Table 60 shows traffic volumes applied to each approach of the intersection. Fully-actuated traffic control is applied in this test. Figure 105 through figure 107 indicate the timing plans used for each testing scenario.
Table 60. Case 10 Service Flow by Each Approach.
| Approach |
Northbound |
Eastbound |
Westbound |
| L |
R |
TH |
R |
L |
TH |
| Phase ID (Four Phase) |
3 |
3 |
2 |
2 |
1 |
1 |
| Low Volumes |
200 |
200 |
200 |
100 |
200 |
200 |
| Medium Volumes |
400 |
400 |
300 |
200 |
400 |
400 |
| High Volumes |
600 |
600 |
600 |
600 |
600 |
600 |
Note: L, TH, and R correspond to vehicles proceeding left, through, or right at the intersection.
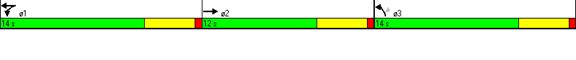
Figure 105. Illustration. Timing Plan for T-Intersection in Low Volumes.
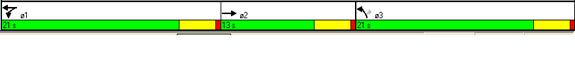
Figure 106. Illustration. Timing Plan for T-Intersection in Medium Volumes.
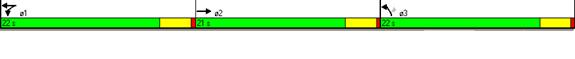
Figure 107. Illustration. Timing Plan for T-Intersection in High Volumes.
Data Analysis and Comparison Results
Case 9: Single four-approach roundabout versus four-approach intersection:
Ten replications were performed for each simulation scenario, and the resulting output trajectory data were analyzed by SSAM. Table 61 through table 65 list the values of all surrogate measures of safety and corresponding t-test results for different types of aggregations with the low-speed and crash events excluded (TTC ≤ 0 and MaxS ≥ 16.1 km/h (10 mi/h)).
Table 61. Case 9 Comparison Results for Total Conflicts.
| Total |
TTC ≤ 0.5 |
TTC ≤ 1.0 |
TTC ≤ 1.5 |
| |
CON |
RA |
CON |
RA |
CON |
RA |
| Low Volume Mean |
N/A |
1.0 |
14.90 |
2.80 |
27.10 |
5.30 |
| Variance |
N/A |
0.44 |
6.10 |
1.51 |
8.10 |
9.57 |
| t-value(95%), difference (%) |
N/A |
13.87, 81.2% |
16.401, 80.4% |
| Medium Volume Mean |
N/A |
5.6 |
36.90 |
22.50 |
66.20 |
46.60 |
| Variance |
N/A |
5.6 |
86.54 |
14.5 |
82.40 |
14.49 |
| t-value(95%), difference (%) |
N/A |
4.530, 39.0% |
6.297, 29.6% |
| High Volume Mean |
N/A |
12.30 |
53.00 |
70.60 |
93.00 |
133.70 |
| Variance |
N/A |
5.79 |
44.00 |
64.49 |
53.33 |
194.01 |
| t-value(95%), difference (%) |
N/A |
-5.343, -33.2% |
-8.184, -43.8% |
Note: Shaded cells indicate statistically significant differences between the two alternatives. The tan and blue colors indicate extreme values to the right and left columns respectively.
This table shows that the four-approach roundabout has fewer total conflicts at low and medium volumes but more total conflicts at high traffic volumes than the conventional intersection. There are no events, in either case, that occur with TTC < 0.5 s.
Table 62. Case 9 Comparison Results for Crossing Conflicts.
| Crossing |
TTC ≤ 0.5 |
TTC ≤ 1.0 |
TTC ≤ 1.5 |
| |
CON |
RA |
CON |
RA |
CON |
RA |
| Low Volume Mean |
N/A |
N/A |
N/A |
N/A |
N/A |
N/A |
| Variance |
N/A |
N/A |
N/A |
N/A |
N/A |
N/A |
| t-value(95%), difference (%) |
N/A |
N/A |
N/A |
| Medium Volume Mean |
N/A |
1.00 |
N/A |
N/A |
N/A |
N/A |
| Variance |
N/A |
0.44 |
N/A |
N/A |
N/A |
N/A |
| t-value(95%), difference (%) |
N/A |
N/A |
N/A |
| High Volume Mean |
N/A |
4.00 |
1.40 |
6.40 |
3.10 |
7.90 |
| Variance |
N/A |
2.22 |
2.04 |
4.93 |
6.10 |
5.66 |
| t-value(95%), difference (%) |
N/A |
-5.986, -357.1% |
-4.427, -154.8% |
Note: Shaded cells indicate statistically significant differences between the two alternatives.
This table shows there are very few crossing conflicts for either scenario. At high volumes, the roundabout has statistically more crossing events, although crossing events amount to approximately only 5 percent of the total events that occur.
Table 63. Case 9 Comparison Results for Rear-End Conflicts.
| Rear End |
TTC ≤ 0.5 |
TTC ≤ 1.0 |
TTC ≤ 1.5 |
| |
CON |
RA |
CON |
RA |
CON |
RA |
| Low Volume Mean |
N/A |
N/A |
13.20 |
0.50 |
21.30 |
0.70 |
| Variance |
N/A |
N/A |
10.18 |
0.50 |
12.01 |
0.68 |
| t-value(95%), difference (%) |
N/A |
12.290, 96.2% |
18.288, 96.7% |
| Medium Volume Mean |
N/A |
N/A |
33.20 |
5.60 |
57.10 |
7.90 |
| Variance |
N/A |
N/A |
71.07 |
6.27 |
71.21 |
5.43 |
| t-value(95%), difference (%) |
N/A |
9.925, 83.1% |
17.772, 86.2% |
| High Volume Mean |
N/A |
N/A |
42.60 |
20.20 |
70.20 |
30.20 |
| Variance |
N/A |
N/A |
32.71 |
16.40 |
58.84 |
40.18 |
| t-value(95%), difference (%) |
N/A |
10.108, 52.6% |
12.711, 57.0% |
Note: Shaded cells indicate statistically significant differences between the two alternatives.
This table indicates that the four-approach roundabout will, for all traffic volumes, statistically reduce the number of rear-end conflicts, as expected from field experience.
Table 64. Case 9 Comparison Results for Lane Change Conflicts.
| Lane Change |
TTC ≤ 0.5 |
TTC ≤ 1.0 |
TTC ≤ 1.5 |
| |
CON |
RA |
CON |
RA |
CON |
RA |
| Low Volume Mean |
N/A |
0.90 |
1.70 |
2.10 |
5.80 |
4.40 |
| Variance |
N/A |
0.54 |
1.79 |
1.43 |
10.18 |
6.93 |
| t-value(95%), difference (%) |
N/A |
-0.705 |
1.070 |
| Medium Volume Mean |
N/A |
4.40 |
3.60 |
15.50 |
9.00 |
37.20 |
| Variance |
N/A |
5.16 |
4.71 |
10.94 |
6.89 |
19.96 |
| t-value(95%), difference (%) |
N/A |
-9.511, -330.6% |
-17.212, -313.3% |
| High Volume Mean |
N/A |
8.20 |
9.00 |
44.00 |
19.70 |
95.60 |
| Variance |
N/A |
4.84 |
11.56 |
68.00 |
17.57 |
115.82 |
| t-value(95%), difference (%) |
N/A |
-12.409, -388.9% |
-20.782, -385.3% |
Note: Shaded cells indicate statistically significant differences between the two alternatives.
This table shows that the four-approach roundabout has more lane-change conflicts at medium- and high-traffic volumes than the conventional design. This was expected due to the weaving movements that are necessary in a roundabout to complete turning maneuvers.
Table 65. Case 9 Comparison Results for Average Surrogate Measures of Safety.
| |
TCON |
TRA |
CCON |
CRA |
RCON |
RRA |
LCCON |
LCRA |
| TTC (low) |
1.04 |
0.99 |
N/A |
N/A |
1.01 |
0.99 |
1.15 |
1.01 |
| t -value, diff(%) |
0.974 |
N/A |
0.211 |
2.100, 12.17% |
| TTC (med) |
1.04 |
1.05 |
N/A |
N/A |
1.02 |
0.95 |
1.14 |
1.08 |
| t -value, diff(%) |
-0.536 |
N/A |
1.984 |
1.908 |
| TTC (high) |
1.05 |
1.02 |
1.14 |
0.67 |
1.03 |
0.98 |
1.12 |
1.06 |
| t -value, diff(%) |
2.542, 2.86% |
8.867, 41.23% |
2.896, 4.85% |
2.966, 5.36% |
| PET(low) |
1.45 |
1.24 |
N/A |
N/A |
1.46 |
1.37 |
1.42 |
1.23 |
| t -value, diff(%) |
3.662, 14.48% |
N/A |
1.048 |
2.670, 13.38% |
| PET(med) |
1.45 |
1.32 |
N/A |
N/A |
1.45 |
1.48 |
1.46 |
1.31 |
| t -value, diff(%) |
6.905, 8.97% |
N/A |
-0.573 |
5.141, 10.27% |
| PET(high) |
1.44 |
1.35 |
1.33 |
1.03 |
1.45 |
1.48 |
1.4 |
1.34 |
| t -value, diff(%) |
6.770, 6.25% |
4.219, 22.56% |
-1.178 |
3.259, 4.29% |
| MaxS(low) |
34.51 |
37.35 |
N/A |
N/A |
34.46 |
39.18 |
34.72 |
36.59 |
| t -value, diff(%) |
-2.282, -8.23% |
N/A |
-1.494 |
-1.244 |
| MaxS(med) |
33.96 |
35.07 |
N/A |
N/A |
33.99 |
34.26 |
33.74 |
34.81 |
| t -value, diff(%) |
-2.645, -3.27% |
N/A |
-0.312 |
-1.594 |
| MaxS(high) |
32.61 |
34.71 |
31.09 |
44.22 |
33.08 |
32.97 |
31.15 |
34.47 |
| t -value, diff(%) |
-7.737, -6.44% |
-10.670, -42.23% |
0.276 |
-6.908, -10.66% |
| DeltaS(low) |
34.19 |
29.47 |
N/A |
N/A |
34.13 |
28.03 |
34.41 |
29.24 |
| t -value, diff(%) |
4.749, 13.81% |
N/A |
2.511, 17.87% |
4.134, 15.02% |
| DeltaS(med) |
33.19 |
28.05 |
N/A |
N/A |
33.23 |
27.56 |
32.89 |
27.75 |
| t -value, diff(%) |
11.286, 15.49% |
N/A |
4.910, 17.06% |
6.317, 15.63% |
| DeltaS(high) |
31.16 |
27.65 |
30.44 |
36.59 |
31.98 |
27.46 |
28.36 |
26.97 |
| t -value, diff(%) |
10.168, 11.26% |
-5.254, -20.20% |
7.705, 14.13% |
2.029, 4.9% |
| DR(low) |
-12.64 |
-18.5 |
N/A |
N/A |
-12.61 |
-42.93 |
-12.72 |
-15.12 |
| t -value, diff(%) |
1.67 |
N/A |
1.477 |
0.867 |
| DR(med) |
-12.58 |
-20.67 |
N/A |
N/A |
-12.58 |
-16.08 |
-12.6 |
-20.87 |
| t -value, diff(%) |
4.812, -64.31% |
N/A |
1.372 |
4.273, -65.63% |
| DR(high) |
-12.15 |
-26.82 |
-11.5 |
-40.46 |
-12.4 |
-13.36 |
-11.35 |
-29.94 |
| t -value, diff(%) |
11.118, -120.74% |
4.176, -251.83% |
1.572 |
10.733, -163.79% |
| MaxD(low) |
-12.64 |
-30.44 |
N/A |
N/A |
-12.61 |
-59.98 |
-12.72 |
-24.25 |
| t -value, diff(%) |
3.270, -140.82% |
N/A |
2.110 |
2.166, -90.64% |
| MaxD(med) |
-12.6 |
-33.54 |
N/A |
N/A |
-12.59 |
-24.14 |
-12.67 |
-32.74 |
| t -value, diff(%) |
8.791, -166.19% |
N/A |
2.557, -91.74% |
7.439, -158.41% |
| MaxD(high) |
-12.94 |
-38.36 |
-19.22 |
-97.36 |
-12.59 |
-17.62 |
-13.23 |
-40.04 |
| t -value, diff(%) |
16.188, -196.45% |
10.203, -406.56% |
3.659, -39.95% |
13.390, -202.65% |
| MaxDeltaV(low) |
17.93 |
15.37 |
N/A |
N/A |
17.9 |
14.31 |
18.01 |
15.31 |
| t -value, diff(%) |
4.815, 14.28% |
N/A |
4.071, 20.06% |
4.029, 14.99% |
| MaxDeltaV(med) |
17.34 |
14.68 |
N/A |
N/A |
17.36 |
14.5 |
17.22 |
14.51 |
| t -value, diff(%) |
11.094, 15.34% |
N/A |
4.689, 16.47% |
6.279, 15.74% |
| MaxDeltaV(high) |
16.3 |
14.44 |
15.9 |
19.1 |
16.73 |
14.32 |
14.85 |
14.09 |
| t -value, diff(%) |
10.263, 11.41% |
-5.133, -20.13% |
7.837, 14.41% |
2.117, 5.12% |
Note: Shaded cells indicate statistically significant differences between the two alternatives. The tan and blue colors indicate extreme values to the right and left columns respectively.
In this table, most of the average values of surrogate measures indicate that the roundabout has worse performance than the conventional intersection, except for the DeltaS and MaxDeltaV measures. The reduction in the DeltaS indicates a reduction in the potential severity of resultant crashes by the reduction of relative vehicle speeds. The other surrogate measures indicate a higher propensity for conflicts that have higher probability of resultant collisions.
Case 10: Single three-approach roundabout versus T-intersection:
Ten replications were performed for each simulation scenario, and the resulting output trajectory data were analyzed by SSAM. Table 66 through table 70 list the values of all surrogate measures of safety and corresponding t-test results for different types of aggregations with the low-speed and crash events excluded from the analysis (TTC ≤ 0 and MaxS ≥ 16.1 km/h (10 mi/h)).
Table 66. Case 10 Comparison Results for Total Conflicts.
| Total |
TTC ≤ 0.5 |
TTC ≤ 1.0 |
TTC ≤ 1.5 |
| |
CON |
RA |
CON |
RA |
CON |
RA |
| Low Volume Mean |
0.80 |
2.80 |
39.40 |
5.90 |
65.40 |
11.20 |
| Variance |
0.62 |
3.73 |
38.71 |
6.77 |
22.71 |
9.51 |
| t-value(95%), difference (%) |
-3.030, -250.0% |
15.709, 85.0% |
30.194, 82.9% |
| Medium Volume Mean |
1.90 |
8.90 |
80.90 |
38.50 |
135.10 |
82.30 |
| Variance |
1.66 |
9.43 |
38.32 |
77.17 |
86.10 |
125.34 |
| t-value(95%), difference (%) |
-6.647, -368.4% |
12.477, 52.4% |
11.482, 39.1% |
| High Volume Mean |
57.20 |
32.60 |
305.60 |
185.10 |
549.80 |
344.90 |
| Variance |
184.84 |
34.04 |
3641.16 |
200.32 |
12272.62 |
374.77 |
| t-value(95%), difference (%) |
5.258, 43.0% |
6.148, 39.4% |
5.762, 37.3% |
Note: Shaded cells indicate statistically significant differences between the two alternatives. The tan and blue colors indicate extreme values to the right and left columns respectively.
Similar to the results for the four-leg roundabout, the three-approach roundabout reduces the total conflict events over that of the conventional intersection 40 percent to 80 percent for most traffic volumes and TTC threshold values. The three-approach roundabout and T-intersection exhibit conflict events that have TTC values ≤ 0.5, whereas the four-approach roundabout did not have any events at this level of severity for any traffic volume levels.
Table 67. Case 10 Comparison Results for Crossing Conflicts.
| Crossing |
TTC ≤ 0.5 |
TTC ≤ 1.0 |
TTC ≤ 1.5 |
| |
CON |
RA |
CON |
RA |
CON |
RA |
| Low Volume Mean |
N/A |
N/A |
1.90 |
0.80 |
3.30 |
0.90 |
| Variance |
N/A |
N/A |
1.66 |
0.62 |
1.34 |
0.77 |
| t-value(95%), difference (%) |
N/A |
2.305, 57.9% |
5.223, 72.7% |
| Medium Volume Mean |
0.50 |
3.20 |
6.30 |
4.00 |
10.00 |
5.40 |
| Variance |
0.28 |
3.96 |
4.90 |
5.11 |
10.67 |
3.82 |
| t-value(95%), difference (%) |
-4.150, -540.0% |
2.299, 36.5% |
3.822, 46.0% |
| High Volume Mean |
13.90 |
9.10 |
83.10 |
17.30 |
117.30 |
21.40 |
| Variance |
11.43 |
3.88 |
262.10 |
15.12 |
569.79 |
15.38 |
| t-value(95%), difference (%) |
3.879, 34.6% |
12.497, 79.2% |
12.537, 81.8% |
Note: Shaded cells indicate statistically significant differences between the two alternatives. The tan and blue colors indicate extreme values to the right and left columns respectively.
This table shows that the three-approach roundabout reduces crossing conflicts 45 percent to 80 percent at almost all traffic volumes.
Table 68. Case 10 Comparison Results for Rear-End Conflicts.
| Rear End |
TTC ≤ 0.5 |
TTC ≤ 1.0 |
TTC ≤ 1.5 |
| |
CON |
RA |
CON |
RA |
CON |
RA |
| Low Volume Mean |
N/A |
N/A |
32.70 |
0.90 |
49.20 |
1.20 |
| Variance |
N/A |
N/A |
31.57 |
0.77 |
30.40 |
0.84 |
| t-value(95%), difference (%) |
N/A |
17.685, 97.2% |
27.155, 97.6% |
| Medium Volume Mean |
0.90 |
0.20 |
71.00 |
9.60 |
115.20 |
15.50 |
| Variance |
0.77 |
0.18 |
54.44 |
19.60 |
131.07 |
37.83 |
| t-value(95%), difference (%) |
2.278, 77.8% |
22.564, 86.5% |
24.259, 86.5% |
| High Volume Mean |
17.50 |
0.60 |
155.30 |
59.70 |
330.10 |
94.50 |
| Variance |
50.06 |
0.93 |
1399.79 |
53.34 |
5805.43 |
136.28 |
| t-value(95%), difference (%) |
7.484, 96.6% |
7.931, 61.6% |
9.665, 71.4% |
Note: Shaded cells indicate statistically significant differences between the two alternatives.
As with the results for total and crossing conflict, this table shows that the three-approach roundabout has significantly fewer rear-end conflicts events than the conventional T-intersection, as expected from the field experience.
Table 69. Case 10 Comparison Results for Lane-Change Conflicts.
| Lane Change |
TTC ≤ 0.5 |
TTC ≤ 1.0 |
TTC ≤1.5 |
| |
CON |
RA |
CON |
RA |
CON |
RA |
| Low Volume Mean |
N/A |
N/A |
4.80 |
4.20 |
12.90 |
9.10 |
| Variance |
N/A |
N/A |
3.07 |
3.29 |
9.66 |
7.88 |
| t-value(95%), difference (%) |
N/A |
0.753 |
2.870, 29.5% |
| Medium Volume Mean |
N/A |
N/A |
3.60 |
24.90 |
9.90 |
61.40 |
| Variance |
N/A |
N/A |
3.60 |
26.32 |
11.43 |
73.16 |
| t-value(95%), difference (%) |
N/A |
-12.314, -591.7% |
-17.707, -520.2% |
| High Volume Mean |
25.80 |
22.90 |
67.20 |
108.10 |
102.40 |
229.00 |
| Variance |
26.62 |
23.66 |
147.73 |
151.21 |
277.60 |
198.00 |
| t-value(95%), difference (%) |
1.293 |
-7.480, -60.9% |
-18.357, -123.6%, |
Note: Shaded cells indicate statistically significant differences between the two alternatives.
This table shows that the three-approach roundabout has more lane-change conflicts at medium- and high-traffic volumes. This was expected because of the weaving maneuvers necessary in a roundabout.
Table 70. Case 10 Comparison Results for Average Surrogate Measures of Safety.
| |
TCON |
TRA |
CCON |
CRA |
RCON |
RRA |
LCCON |
LCRA |
| TTC (low) |
1.02 |
0.96 |
1.01 |
0.48 |
1.00 |
0.99 |
1.12 |
1.01 |
| t -value, diff(%) |
1.488 |
3.879, 52.48% |
0.139 |
2.256, 9.82% |
| TTC (med) |
1.02 |
1.05 |
0.99 |
0.69 |
1.02 |
1.02 |
1.11 |
1.09 |
| t -value, diff(%) |
-2.203, -2.94% |
5.228, 30.30% |
0.000 |
0.588 |
| TTC (high) |
0.99 |
1.02 |
0.87 |
0.73 |
1.07 |
1.01 |
0.85 |
1.05 |
| t -value, diff(%) |
-4.208, -3.03% |
5.639, 16.09% |
5.960, 5.61% |
-13.670, -23.53% |
| PET(low) |
1.42 |
1.22 |
1.12 |
0.79 |
1.46 |
1.73 |
1.35 |
1.19 |
| t -value, diff(%) |
4.108, 14.08% |
1.532 |
-1.334 |
3.286, 11.85% |
| PET(med) |
1.4 |
1.34 |
1.02 |
1.06 |
1.44 |
1.53 |
1.3 |
1.31 |
| t -value, diff(%) |
3.342, 4.29% |
-0.452 |
-1.834 |
-0.171 |
| PET(high) |
1.13 |
1.33 |
0.64 |
1.21 |
1.35 |
1.45 |
1.01 |
1.29 |
| t -value, diff(%) |
-19.321, -17.7% |
-11.612, -89.06% |
-7.391, -7.41% |
-13.856, -27.72% |
| MaxS(low) |
33.89 |
36.29 |
31.11 |
46.79 |
33.96 |
35.16 |
34.33 |
35.4 |
| t -value, diff(%) |
-2.551, -7.08% |
-12.004, -50.40% |
-0.356 |
-1.012 |
| MaxS(med) |
33.11 |
34.62 |
32.29 |
46.19 |
33.15 |
33.77 |
33.55 |
33.82 |
| t -value, diff(%) |
-4.399, -4.56% |
-17.725, -43.05% |
-0.844 |
-0.408 |
| MaxS(high) |
25.45 |
34.06 |
26.04 |
43.28 |
24.36 |
31.07 |
28.28 |
34.42 |
| t -value, diff(%) |
-48.734, -33.83% |
-34.553, -66.21% |
-25.057, -27.55% |
-21.144, -21.71% |
| DeltaS(low) |
32.75 |
26.94 |
30.03 |
37.94 |
33.15 |
18.58 |
31.9 |
26.95 |
| t -value, diff(%) |
6.903, 17.74% |
-4.675, -26.34% |
5.826, 43.95% |
4.956, 15.52% |
| DeltaS(med) |
31.22 |
26.36 |
31.27 |
38.51 |
31.59 |
23.45 |
26.9 |
26.02 |
| t -value, diff(%) |
12.524, 15.57% |
-7.886, -23.15% |
9.228, 25.77% |
0.783 |
| DeltaS(high) |
19.58 |
25.78 |
29.91 |
36.44 |
17.11 |
25.27 |
15.69 |
25 |
| t -value, diff(%) |
-28.502, -31.66% |
-11.521, -21.83% |
-23.944, -47.69% |
-31.253, -59.34% |
| DR(low) |
-12.45 |
-21.18 |
-13.13 |
-25.57 |
-12.46 |
-9.89 |
-12.24 |
-22.24 |
| t -value, diff(%) |
2.234, -70.12% |
0.995 |
-1.897 |
2.151, -81.70% |
| DR(med) |
-12.82 |
-23.63 |
-13.53 |
-45.3 |
-12.8 |
-14.93 |
-12.3 |
-23.92 |
| t -value, diff(%) |
7.064, -84.32% |
2.941, -234.81% |
1.232 |
6.521, -94.47% |
| DR(high) |
-21.01 |
-29.88 |
-16.17 |
-55.42 |
-23.78 |
-14.29 |
-17.65 |
-33.93 |
| t -value, diff(%) |
8.851, -42.22% |
7.717, -242.73% |
-10.772, 39.91% |
9.662, -92.13% |
| MaxD(low) |
-12.94 |
-37.93 |
-18.35 |
-108.21 |
-12.68 |
-27.52 |
-12.52 |
-32.35 |
| t -value, diff(%) |
4.615, -193.12% |
3.937, -489.7% |
1.004 |
3.586, -158.39% |
| MaxD(med) |
-14.18 |
-40.39 |
-14.54 |
-111.26 |
-13.76 |
-25.89 |
-18.8 |
-37.81 |
| t -value, diff(%) |
12.079, -184.84% |
9.483, -665.20% |
3.391, -88.15% |
5.407, -101.12% |
| MaxD(high) |
-41.35 |
-47.62 |
-25.12 |
-114.54 |
-50.53 |
-18.89 |
-30.36 |
-53.23 |
| t -value, diff(%) |
4.780, -15.16% |
19.911, -355.97% |
-24.751, 62.62% |
10.298, -75.33% |
| MaxDeltaV(low) |
17.13 |
14.05 |
15.81 |
20.09 |
17.35 |
9.61 |
16.62 |
14.04 |
| t -value, diff(%) |
6.960, 17.98% |
-4.593, -27.07% |
6.096, 44.61% |
4.927, 15.52% |
| MaxDeltaV(med) |
16.29 |
13.79 |
16.26 |
20.17 |
16.49 |
12.27 |
13.99 |
13.61 |
| t -value, diff(%) |
12.260, 15.35% |
-7.721, -24.05% |
9.151, 25.59% |
0.649 |
| MaxDeltaV(high) |
10.23 |
13.48 |
15.64 |
19.06 |
8.94 |
13.22 |
8.21 |
13.07 |
| t -value, diff(%) |
-28.459, -31.77% |
-11.447, -21.87% |
-23.380, -47.86% |
-31.021, -59.20% |
Note: Shaded cells indicate statistically significant differences between the two alternatives. The tan and blue colors indicate extreme values to the right and left columns respectively.
In general, the data in the table has some counter-indicative results. Some of the average surrogate measures of safety are better for the roundabout and others are worse. Conflicts classified as crossing and lane-changing events generally have worse average values of surrogates, but rear-end events have better average values for the roundabout design.
Correlations with Predicted Crash Frequency
Because all crash prediction models for roundabout are only valid for four-approach roundabout at the current stage of development of roundabout crash prediction models, no correlation test can be performed for the three-approach roundabout versus T-intersection case.
The predicted crash rates for all scenarios of four-approach roundabout versus conventional four-approach intersection are listed in table 71 with the corresponding surrogate measures of safety. Rank orders for each category of data are also listed in the table. The Spearman rank correlation coefficients are calculated for each test. The results indicate a weak correlation between the predicted crash rates and the conflict rates. For the surrogate safety measure of lane-change crashes, there is even no relationship.
Table 71. Case 9 Spearman Rank Correlations Between Conflicts and Crash Frequency.
| AADT |
Low |
Medium |
High |
Rs |
| CON |
RA |
CON |
RA |
CON |
RA |
| Crash Frequency |
M |
1.7 |
0.2 |
3 |
0.6 |
4.1 |
1.3 |
1 |
| R |
4 |
1 |
5 |
2 |
6 |
3 |
| Total Conflict |
M |
27.1 |
5.3 |
66.2 |
46.6 |
93 |
133.7 |
0.54 |
| R |
2 |
1 |
4 |
3 |
5 |
6 |
| Crossing Conflict |
M |
|
|
|
|
|
|
N/A |
| R |
|
|
|
|
|
|
| Rear-End Conflict |
M |
21.3 |
0.7 |
57.1 |
7.9 |
70.2 |
30.2 |
0.69 |
| R |
3 |
1 |
5 |
2 |
6 |
4 |
| LC Conflict |
M |
5.8 |
4.4 |
9 |
37.2 |
19.7 |
95.6 |
0 |
| R |
1 |
1 |
3 |
5 |
4 |
6 |
NOTE: Rates that are not significantly different are assigned the same rank. Rows labeled "M" provide mean values and rows labeled "R" provide the ranking of each alternative. The Rs column provides Spearman rank correlation coefficients indicating agreement with theoretical crash estimates.
Findings and Conclusions
Based on the above observations, the following conclusions can be drawn:
- Both four-approach and three-approach roundabouts generate fewer total and rear-end conflicts but more lane-change conflicts than the corresponding conventional intersections.
- Three-approach roundabout generates fewer crossing conflicts than T-intersection.
- There are only a few crossing conflicts for both designs.
In general, for most traffic volumes, both four-approach and three-approach roundabouts generate fewer total and rear-end conflicts than the corresponding conventional intersections. Roundabouts show higher rates of lane-change conflicts than conventional intersections, which is expected because of the traffic maneuvers expected in a roundabout. The severity of resulting collisions in a roundabout is most likely lower than that of a conventional intersection, but the probability of collisions occurring is higher when conflicts do occur (at a less frequent rate than that of conventional intersection designs).
Case 11: Double Roundabout Versus Diamond Intersection (AIMSUN)
In both rural and suburban areas, the most predominant interchange type is the diamond interchange, a relatively simple design and implementation that accommodates low- to medium-traffic volumes, with partial access control and limited right of way. Although a diamond interchange is the most common interchange type, it may create unnecessary delay at signals and can at times cause spillback onto a freeway. An alternative to the conventional or tight diamond interchange is a double-roundabout interchange as shown in figure 108. The double roundabout eliminates traffic signals, some costs, and traffic delays resulting from the signals. In addition, it is believed to reduce conflicts and crash frequency.
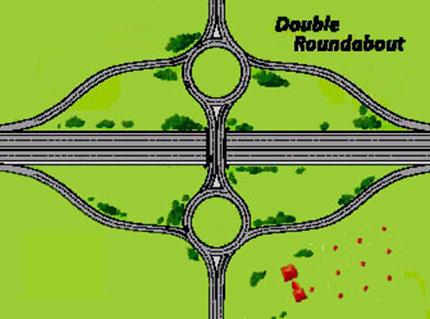
Figure 108. Illustration. Double Roundabout.
Some of the first modern double-roundabout interchanges in the United States were built in the mid 1990s in Colorado and Maryland. Studies show that using double roundabouts at interchange ramp terminals with low and medium flows will result in noticeably less delay than stop-controlled and signalized diamond interchanges. Other benefits include increased safety and the ability to use narrower bridges. This evaluation compares the double roundabout with a comparable diamond interchange to evaluate the comparative safety effect of the two designs.(22)
Intersection Description
The intersections used for this test are shown in figure 109 and figure 110. The left-turn bays are 76.25 m (250 ft) long.
Figure 109. Screen Capture. Diamond Interchange in AIMSUN.
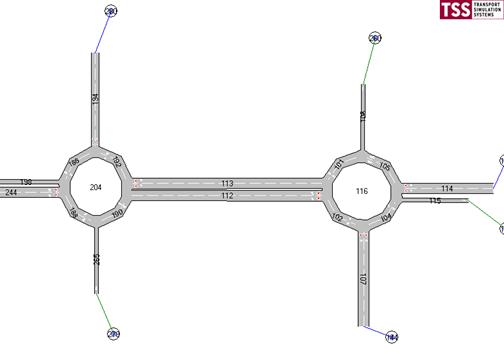
Figure 110. Screen Capture. Double Roundabout in AIMSUN.
Table 72 shows traffic volumes applied to each approach of the intersection. Fully-actuated traffic control for a four-phase diamond interchange is applied in this test. Figure 111 through figure 113 indicate the timing plans used for each testing scenario.
Table 72. Case 11 Service Flow by Each Approach.
| Approach |
Southbound |
Northbound |
Eastbound |
Westbound |
| L |
TH |
R |
L |
TH |
R |
L |
TH |
R |
L |
TH |
R |
| Phase ID (Four Phase) |
3 |
3 |
|
7 |
7 |
|
1 |
1 |
|
5 |
5 |
|
| Low Volumes |
125 |
25 |
100 |
125 |
25 |
100 |
100 |
100 |
100 |
100 |
100 |
100 |
| Medium Volumes |
250 |
50 |
200 |
250 |
50 |
200 |
200 |
150 |
200 |
200 |
150 |
200 |
| High Volumes |
450 |
50 |
400 |
450 |
50 |
400 |
400 |
300 |
400 |
400 |
300 |
400 |
Note: L, TH, and R correspond to vehicles proceeding left, through, or right at the intersection.

Figure 111. Screen Capture. Timing Plan for Four-Phase Diamond Interchange in Low Volumes.

Figure 112. Screen Capture. Timing Plan for Four-Phase Diamond Interchange in Medium Volumes.

Figure 113. Screen Capture. Timing Plan for Four-Phase Diamond Interchange in High Volumes.
Data Analysis and Comparison Results
Ten replications were performed for each simulation scenario and the resulting output trajectory data was analyzed by SSAM. F-tests and t-tests were applied to compare the average number of conflict events and surrogate measures of safety between the two design options. Table 73 through table 77 list the values of all surrogate measures of safety and corresponding t-test results for different types of aggregations with the low-speed events and crash data excluded (TTC ≤ 0 and MaxS ≥ 16.1 km/h (10mi/h)).
Table 73. Case 11 Comparison Results for Total Conflicts.
| Total |
TTC ≤ 0.5 |
TTC ≤ 1.0 |
TTC ≤ 1.5 |
| |
DIA |
RA |
DIA |
RA |
DIA |
RA |
| Low Volume Mean |
2.30 |
3.40 |
30.10 |
10.60 |
52.60 |
22.10 |
| Variance |
1.12 |
0.93 |
19.66 |
9.16 |
90.93 |
28.77 |
| t-value(95%), difference (%) |
-2.426, -47.8% |
11.488, 64.8% |
8.816, 58.0% |
| Medium Volume Mean |
5.30 |
13.20 |
62.10 |
64.20 |
110.10 |
118.10 |
| Variance |
3.57 |
15.51 |
169.43 |
58.84 |
251.88 |
187.21 |
| t-value(95%), difference (%) |
-5.720, -149.1% |
-0.440 |
-1.207 |
| High Volume Mean |
16.40 |
55.70 |
119.20 |
444.30 |
250.80 |
772.80 |
| Variance |
20.93 |
79.12 |
203.73 |
1099.79 |
979.73 |
3791.07 |
| t-value(95%), difference (%) |
-12.424, -239.6% |
-28.475, -272.7% |
-23.899, -208.1% |
Note: Shaded cells indicate statistically significant differences between the two alternatives. The tan and blue colors indicate extreme values to the right and left columns respectively.
This table indicates that the total conflicts for the double roundabout is lower at low volumes and higher at high volumes. For all traffic volumes, the double roundabout design has more conflict events that occur at very low values of TTC.
Table 74. Case 11 Comparison Results for Crossing Conflicts.
| Crossing |
TTC ≤ 0.5 |
TTC ≤ 1.0 |
TTC ≤ 1.5 |
| |
DIA |
RA |
DIA |
RA |
DIA |
RA |
| Low Volume Mean |
N/A |
N/A |
2.50 |
1.10 |
4.60 |
1.30 |
| Variance |
N/A |
N/A |
2.72 |
2.32 |
5.16 |
3.12 |
| t-value(95%), difference (%) |
N/A |
1.971 |
3.627, 71.7% |
| Medium Volume Mean |
0.40 |
3.30 |
8.30 |
4.00 |
13.20 |
5.00 |
| Variance |
0.93 |
6.23 |
13.57 |
7.78 |
19.96 |
11.11 |
| t-value(95%), difference (%) |
-3.426, -725.0% |
2.943, 51.8% |
4.652 62.1% |
| High Volume Mean |
2.20 |
13.80 |
19.80 |
23.20 |
41.70 |
30.20 |
| Variance |
3.73 |
31.96 |
29.51 |
46.18 |
79.34 |
93.96 |
| t-value(95%), difference (%) |
-6.140, -527.3% |
-1.236 |
2.762 27.6% |
Note: Shaded cells indicate statistically significant differences between the two alternatives. The tan and blue colors indicate extreme values to the right and left columns respectively.
This table shows that the dual roundabout has less crossing conflict events than the diamond interchange. Crossing conflicts are a very small part (less than 5 percent) of the total conflicts.
Table 75. Case 11 Comparison Results for Rear-End Conflicts.
| Rear End |
TTC ≤ 0.5 |
TTC ≤ 1.0 |
TTC ≤ 1.5 |
| |
DIA |
RA |
DIA |
RA |
DIA |
RA |
| Low Volume Mean |
1.20 |
0.40 |
22.70 |
3.10 |
38.10 |
5.80 |
| Variance |
1.29 |
0.27 |
31.57 |
1.88 |
88.10 |
4.84 |
| t-value(95%), difference (%) |
2.028 |
10.718, 86.3% |
10.595, 84.8% |
| Medium Volume Mean |
2.20 |
0.80 |
45.00 |
18.90 |
80.90 |
30.20 |
| Variance |
2.84 |
0.62 |
113.11 |
8.99 |
195.88 |
27.29 |
| t-value(95%), difference (%) |
2.378, 63.6% |
7.469, 58.0% |
10.732, 62.7% |
| High Volume Mean |
6.50 |
3.90 |
71.30 |
234.10 |
165.20 |
393.80 |
| Variance |
4.72 |
2.99 |
78.68 |
526.54 |
563.51 |
1872.40 |
| t-value(95%), difference (%) |
2.961, 40.0% |
-20.927, -228.3% |
-14.647, -138.4% |
Note: Shaded cells indicate statistically significant differences between the two alternatives. The tan and blue colors indicate extreme values to the right and left columns respectively.
This table shows that the dual roundabout has less rear-end conflict events at low- and medium-traffic volumes but more events at high volumes than the diamond interchange. Rear-end conflicts are more than 50 percent of the total conflicts.
Table 76. Case 11 Comparison Results for Lane Change Conflicts.
| Lane Change |
TTC ≤ 0.5 |
TTC ≤ 1.0 |
TTC ≤ 1.5 |
| |
DIA |
RA |
DIA |
RA |
DIA |
RA |
| Low Volume Mean |
1.10 |
2.00 |
4.90 |
6.40 |
9.90 |
15.00 |
| Variance |
0.99 |
1.33 |
1.88 |
4.04 |
3.88 |
16.00 |
| t-value(95%), difference (%) |
-1.868 |
-1.949 |
-3.617, -51.5% |
| Medium Volume Mean |
2.70 |
9.10 |
8.80 |
41.30 |
16.00 |
82.90 |
| Variance |
1.57 |
5.21 |
9.07 |
45.79 |
17.11 |
110.99 |
| t-value(95%), difference (%) |
-7.774, -237.0% |
-13.876, -369.3% |
-18.692, -418.1% |
| High Volume Mean |
7.70 |
38.00 |
28.10 |
187.00 |
43.90 |
348.80 |
| Variance |
6.90 |
45.11 |
42.77 |
143.11 |
76.10 |
498.40 |
| t-value(95%), difference (%) |
-13.286, -393.5% |
-36.856, -565.5% |
-40.227, -694.5% |
Note: Shaded cells indicate statistically significant differences between the two alternatives.
This table indicates that the dual roundabout has many more lane-change conflict events at all traffic volumes than the diamond interchange, which is consistent with the results for the four- and three-approach roundabout cases compared to conventional intersections.
Table 77. Case 11 Comparison Results for Average Surrogate Measures of Safety.
| |
TDIA |
TRA |
CDIA |
CRA |
RDIA |
RRA |
LDIA |
LRA |
| TTC (low) |
1.03 |
1.01 |
1.05 |
0.55 |
1.03 |
1.02 |
1.03 |
1.04 |
| t -value, diff(%) |
0.686 |
5.336, 47.62% |
0.194 |
-0.205 |
| TTC (med) |
1.03 |
1.01 |
1 |
0.65 |
1.04 |
1 |
0.97 |
1.03 |
| t -value, diff(%) |
1.477 |
5.319, 35.00% |
2.062, 3.85% |
-1.824 |
| TTC (high) |
1.05 |
1 |
1 |
0.72 |
1.09 |
1.03 |
0.91 |
1.01 |
| t -value, diff(%) |
6.634, 4.76% |
10.601, 28.00% |
6.780, 5.50% |
-5.674, -10.99% |
| PET(low) |
1.44 |
1.16 |
1.16 |
0.74 |
1.53 |
1.12 |
1.24 |
1.22 |
| t -value, diff(%) |
5.730, 19.44% |
2.814, 36.21% |
4.096, 26.80% |
0.290 |
| PET(med) |
1.36 |
1.24 |
1.02 |
0.71 |
1.46 |
1.35 |
1.13 |
1.24 |
| t -value, diff(%) |
5.326, 8.82% |
3.668, 30.39% |
2.883, 7.53% |
-2.407, -9.73% |
| PET(high) |
1.22 |
1.28 |
0.81 |
0.67 |
1.35 |
1.41 |
1.12 |
1.19 |
| t -value, diff(%) |
-4.595, -4.92% |
3.453, 17.28% |
-3.898, -4.44% |
-2.452, -6.25% |
| MaxS(low) |
33.54 |
34.38 |
34 |
41.85 |
33.61 |
35.95 |
33.05 |
33.13 |
| t -value, diff(%) |
-1.302 |
-5.809, -23.09% |
-1.805 |
-0.084 |
| MaxS(med) |
32.63 |
33.1 |
32.53 |
40.53 |
32.65 |
32.71 |
32.62 |
32.79 |
| t -value, diff(%) |
-1.494 |
-7.923, -24.59% |
-0.111 |
-0.245 |
| MaxS(high) |
27.26 |
32.27 |
24.36 |
36.33 |
27.42 |
31.08 |
29.4 |
33.27 |
| t -value, diff(%) |
-26.392, -18.38% |
-19.853, -49.14% |
-15.564, -13.35% |
-9.051, -13.16% |
| DeltaS(low) |
30.07 |
24.22 |
33.87 |
38.98 |
30.87 |
19.5 |
25.25 |
24.76 |
| t -value, diff(%) |
6.727, 19.45% |
-1.555 |
6.520, 36.83% |
0.384 |
| DeltaS(med) |
28.52 |
25.71 |
31.75 |
36.98 |
29.19 |
22.93 |
22.44 |
26.04 |
| t -value, diff(%) |
6.603, 9.85% |
-3.690, -16.47% |
8.375, 21.45% |
-4.144, -16.04% |
| DeltaS(high) |
19.84 |
25.96 |
24.6 |
36.98 |
19.41 |
25.95 |
16.93 |
25.02 |
| t -value, diff(%) |
-25.500, -30.85% |
-12.686, -50.33% |
-21.296, -33.69% |
-19.264, -47.78% |
| DR(low) |
-13.51 |
-22.49 |
-19.18 |
-18.2 |
-12.48 |
-14.68 |
-14.84 |
-25.89 |
| t -value, diff(%) |
3.823, -66.47% |
-0.071 |
0.930 |
3.105, -74.46% |
| DR(med) |
-12.5 |
-17.68 |
-13.13 |
-20.62 |
-12.23 |
-12.76 |
-13.34 |
-19.29 |
| t -value, diff(%) |
6.480, -41.44% |
1.540 |
0.737 |
3.785, -44.60% |
| DR(high) |
-15.87 |
-16.49 |
-15.8 |
-19.31 |
-16.39 |
-12.53 |
-13.96 |
-20.72 |
| t -value, diff(%) |
1.183 |
1.511 |
-6.503, 23.55% |
6.731, -48.42% |
| MaxD(low) |
-15.96 |
-29.65 |
-20.63 |
-29.99 |
-13.85 |
-23.49 |
-21.93 |
-32 |
| t -value, diff(%) |
4.765, -85.78% |
0.674 |
2.393, -69.60% |
1.800 |
| MaxD(med) |
-15.38 |
-25.48 |
-15.6 |
-37.45 |
-14.34 |
-16.42 |
-20.45 |
-28.06 |
| t -value, diff(%) |
8.483, -65.67% |
3.552, -140.06% |
1.687 |
2.856, -37.21% |
| MaxD(high) |
-28.6 |
-23.02 |
-21.21 |
-27.16 |
-30.7 |
-14.78 |
-27.74 |
-31.96 |
| t -value, diff(%) |
-6.750, 19.51% |
2.175, -28.05% |
-16.679, 51.86% |
2.148, -15.21% |
| MaxDeltaV(low) |
16.43 |
13.23 |
18.11 |
21.99 |
16.94 |
10.96 |
13.65 |
13.34 |
| t -value, diff(%) |
6.512, 19.48% |
-2.254, -21.42% |
6.037, 35.30% |
0.438 |
| MaxDeltaV(med) |
15.27 |
13.45 |
16.75 |
19.53 |
15.64 |
11.97 |
12.12 |
13.62 |
| t -value, diff(%) |
8.014, 11.92% |
-3.592, -16.60% |
9.300, 23.47% |
-3.240, -12.38% |
| MaxDeltaV(high) |
10.47 |
13.57 |
12.97 |
19.29 |
10.25 |
13.57 |
8.95 |
13.07 |
| t -value, diff(%) |
-24.556, -29.61% |
-12.356, -48.73% |
-20.164, -32.39% |
-18.456, -46.03% |
Note: Shaded cells indicate statistically significant differences between the two alternatives. The tan and blue colors indicate extreme values to the right and left columns respectively.
In general, the data in this table have some counter-indicative results. Most of the average surrogate measures of safety are better for the diamond interchange, although the severity of resulting collisions, measured by DeltaS and MaxDeltaV, are lower with the double roundabout. The other results generally indicate that a double roundabout contributes more total conflict events, and those that occur have a higher probability of resulting in a crash.
Correlations with Predicted Crash Frequency
The dual roundabout can be approximately considered as two three-approach single roundabouts. However, because all crash prediction models for roundabout are only valid for four-approach roundabout at current stage, no correlation test can be performed for this case.
Findings and Conclusions
Based on the above observations, the following conclusions can be drawn:
- When traffic volume is low, dual roundabout shows fewer total, crossing and rear-end conflicts. When traffic volume is increasing, dual roundabout generates more conflicts than diamond interchange.
- Double roundabouts have many more lane-change conflict events than conventional diamond interchanges.
- There are only a few crossing conflicts for both designs.
- Most of the average surrogate measures of safety are better for the diamond interchange.
SUMMARY
This chapter has detailed the effort to explore and validate the SSAM approach for discriminating the safety performance of two intersection designs. The SSAM approach is based on evaluating the statistical differences in the following:
- The average number of conflict events of various types that occur in both designs.
- The average value of several measures of severity and probability of collision of those conflict events that occur.
The goal of this validation effort was not to compare the results of the simulation model with traffic at a comparable real-world location. Hence, no "calibration" effort was necessary in this study (although, reasonable driver behavior was verified and appropriate control measures were used to avoid gridlock). No oversaturated conditions were included in any of the test cases. For all the intersection designs, default driving behavior models and parameters were applied for each simulation model.
Eleven comparison cases were executed, amongst the three simulation systems: TEXAS, VISSIM, and AIMSUN.
TEXAS Cases
- Signalized, four-leg intersection with permitted left turn versus protected left turn.
- Signalized, four-leg intersection with and without left-turn bay.
- Signalized, four-leg intersection with and without right-turn bay.
VISSIM Cases
- Signalized, four-leg intersection with leading left turns versus lagging left turns.
- Signalized, four-leg intersection versus offset T-intersection.
- Diamond interchange with three-phase timing versus four-phase timing.
- SPUI versus diamond interchange.
AIMSUN Cases
- Signalized, four-leg intersection with left turns versus signalized intersection with median U-turns.
- Signalized, four-leg intersection versus single roundabout.
- Signalized, three-leg T-intersection versus single roundabout with three legs.
- Diamond interchange versus double roundabout.
Three sets of traffic volumes (low, medium, and high volumes) were applied for each intersection design, and signal timing plans were designed to ensure no oversaturation would occur.
Table 78 summarizes the results from the validation studies for each test case.
- The first column lists the conventional safety indication—which of the two design types is expected to be safer than the other due to historical crash data.
- The second column lists a high-level assessment of the safety preference for one design or the other based on the statistical significance results for total as well as individual conflict types.
- The third column lists a general assessment of the safety preference indication by considering the average value of surrogate measures related to the probability of collision. These measures are PET and TTC.
- The fourth column lists a general assessment of the safety preference indication by considering the average values of surrogate measures related to the severity of resulting collision, would a collision have occurred. These measures are DeltaS, DR, MaxS, and MaxDeltaV.
- The fifth column lists a general assessment of the correlation between the ranking of the surrogate measures results (for total and individual conflict types) with the existing crash prediction model (if available).
- The final column lists an overall assessment of the result of the validation case.
Table 78. Summary of Theoretical Validation Case Studies.
| Scenario |
Conventional Safety Indication |
Surrogate Safety Indication (Conflicts) |
Probability Indicators:TTC/PET |
Severity Indicators:
Deltas, DR, Maxs, Maxdeltav |
Conflict Rate Correlation with Crash Prediction Models |
General Assessment |
| Permitted Versus Protected Left Turn |
Protected left |
Protected: more total conflicts, but fewer crossing conflicts |
Inconclusive |
Inconclusive |
Good |
Inconclusive; insightful |
| Left-Turn Bay |
With bay |
With bay: more crossing, fewer lane change, fewer rear ends |
Inconclusive |
Mostly better with bay |
Good, except for crossing conflicts |
Inconclusive; insightful |
| Right-Turn Bay |
With bay |
With bay |
TTC better with bay, PET worse with bay |
Without bay |
Very good |
As expected |
| Leading Versus Lagging Left Turn |
No conclusive difference |
Inconclusive |
Inconclusive |
Lane changes worse for lagging at high vol |
N/A |
As expected |
| Three-Phase Versus Four-Phase Diamond |
No conclusive difference |
Three-phase better at low volumes, worse at high volumes |
Four phase |
Four phase |
N/A |
Good insight |
| Cross Versus Offset T |
Offset T |
Cross (very few events) |
Offset T |
Offset T |
Poor (very few events) |
Inconclusive |
| Left Turn Versus Median U-Turn |
Median U turn |
Median U turn:
Less total and rear-end conflicts |
No difference |
Inconclusive |
N/A |
Inconclusive |
Table 78. Summary of Theoretical Validation Case Studies—continued.
| Scenario |
Conventional Safety Indication |
Surrogate Safety Indication (Conflicts) |
Probability Indicators:TTC/PET |
Severity Indicators:
Deltas, DR, Maxs, Maxdeltav |
Conflict Rate Correlation with Crash Prediction Models |
General Assessment |
| SPUI Versus Diamond (Three Phase) |
Diamond
low vol), SPUI (high vol) |
SPUI |
Three-phase diamond |
Three-phase diamond |
Poor |
Good insight |
| Roundabout Versus Four Leg |
Roundabout |
Roundabout: less total and rear end conflicts; more lane change conflicts |
Four-leg conventional intersection |
Inconclusive |
Poor |
Inconclusive |
| Roundabout Versus Three Leg |
Roundabout |
Roundabout: less total and rear end conflicts; more lane change conflicts |
Inconclusive |
Mostly better with three-leg intersection |
N/A |
Inconclusive |
| Diamond Versus Double Roundabout |
Double roundabout |
Roundabout: more conflicts at med/high volumes |
Diamond interchange |
Mostly better with diamond interchange |
N/A |
Diamond interchange |
The overall results from this study are mixed. For some scenarios, the surrogate measures data matches the trend of existing crash prediction models, and the results are consistent with the general understanding of the safety community of the effect of certain design treatments. In other cases, the indication from the simulation model does not match that of the crash prediction models and tends to indicate counterintuitive results.
In many of the test cases, the results fall into the following pattern:
- Design A has statistically fewer conflict events that occur, indicating that A will be a safer design than B.
- Design B has better performance on average values of surrogate measures, indicating that B will be a safer design than A.
In some cases, the following complexities are added to the results:
- The probability of collision indicators (PET, TTC) indicate one conclusion (B is better than A) when the severity of collision indicators (DeltaS, MaxS, DR, etc.) indicate another (A is better than B).
- The conclusions are not consistent for all types of conflict events.
Finally, in some cases the results are complicated by an additional factor:
- Results (either for average values of surrogate measures, number of conflict events, or both) change from one conclusion to the other based on the level of traffic volume.
As an effort in a largely unexplored area of analysis, these complications are not surprising. What the results do indicate is that a more sophisticated normalizing "index" or composite summary measure is needed for comparison of intersection designs (A to B) and comparison of designs in a more objective sense (design A versus all other possible designs, such as that offered by existing regression models for crashes).
Analysis of Conflict Rates by Design Type
To analyze the potential for a normalizing index, we first present the data for conflict rates by design type for the test cases executed in this study. As shown in table 79, the conflict rates by design type vary considerably and tend to increase for more complex intersection types, as expected. In addition, for all the design types, it appears that the (total) conflict rate either increases or remains constant when the traffic volume increases. This is reasonable as the physical proximity of the vehicles in the system increases, resulting in more events at higher levels of severity. However, this phenomenon means that the level of traffic volume needs to be included in a summary "index" measure, which will be explored further in the sensitivity analysis effort of the field validation study.
Table 79. Summary of Conflict Rates by Test Case (Conflicts/100 Entering Vehicles).
| Scenario |
Low Volumes (%) |
Medium Volumes (%) |
High Volumes (%) |
| Case1 |
Case2 |
Case1 |
Case2 |
Case1 |
Case2 |
| Texas Cases |
| Permitted Versus Protected Left Turn |
1.6 |
1.4 |
1.9 |
2.3 |
5.7 |
22.4 |
| Left-Turn Bay |
2.7 |
2.1 |
6.6 |
3.1 |
20.5 |
10.1 |
| Right-Turn Bay |
1.8 |
1.2 |
3.7 |
2.1 |
26.2 |
18.4 |
| Vissim Cases |
| Leading Versus Lagging Left Turn |
0.6 |
0.6 |
0.8 |
0.7 |
1.3 |
1.2 |
| Three-Phase Versus Four-Phase Diamond |
1.6 |
2.3 |
2.1 |
1.3 |
1.7 |
1.2 |
| SPUI Versus Diamond (Three Phase) |
1.8 |
4.0 |
2.2 |
4.9 |
2.2 |
2.6 |
| Cross Versus Offset T |
0 |
0 |
0.3 |
0.4 |
0.2 |
0.4 |
| Left Turn Versus Median U-Turn |
1.8 |
2.1 |
2.5 |
2.3 |
2.6 |
2.2 |
| Aimsun Cases |
| Roundabout Versus Four Leg |
0.7 |
3.4 |
2.9 |
4.1 |
5.6 |
3.9 |
| Roundabout Versus Three Leg |
1.0 |
5.9 |
3.9 |
6.4 |
9.6 |
15.3 |
| Diamond Versus Double Roundabout |
4.8 |
2.0 |
5.2 |
5.6 |
6.3 |
19.3 |
Analysis of Removed Crashes and Low-Speed Events
In most scenarios evaluated, crashes cannot be completely eliminated from the simulation without modifying driver behavior parameters or design geometry beyond reasonable limits. Table 80 presents some summary analysis of the average crash and low-speed event rates by scenario and traffic-volume level. For each design case, the table lists the percentage of total conflicts that were crashes or low-speed events (a sub-critical TTC value occurring at less than 16.1 km/h (10 mi/h) and not a crash with TTC = 0) and the absolute number of crashes and low-speed events (the average value for one replication of the scenario for 1 hour of simulated time, averaged over the 10 replications executed in the study).
Table 80. Summary of Removed Crash and Low-Speed Event Data.
| Scenario |
Low Volumes (%) |
Medium Volumes (%) |
High Volumes (%) |
| Case1 |
Case2 |
Case1 |
Case2 |
Case1 |
Case2 |
| Permitted Versus Protected Left Turn |
33/16*
65.8% |
4/13
42.4% |
99/23
69.3% |
28/5
23.3% |
649/629
80.5% |
306/1298
57.0% |
| Left-Turn Bay |
103/33
68.1% |
139/43
80.9% |
111/239
62.3% |
257/116
79.2% |
279/2078
70.5% |
863/960
78.9% |
| Right-Turn Bay |
17/17
48.9% |
17/13
55.0% |
34/91
51.4% |
38/56
58.4% |
373/1730
62.5% |
480/114
64.7% |
| Leading Versus Lagging Left Turn |
1 / 4
32.9% |
1 / 4
36.2% |
1/12
45.0% |
1/10
45.1% |
3/17
30.5% |
4/28
49.5% |
| Three-Phase Versus Four-Phase Diamond |
5/8
33.5% |
7/9
30.8% |
44/70
64.3% |
44/79
77.2% |
61/99
69.4% |
53/90
75.1% |
| SPUI Versus Diamond (Three Phase) |
5/8
26.9% |
4/15
19.3% |
9/19
30.4% |
11/27
21.0% |
47/94
54.6% |
25/94
45.9% |
Cross Versus
Offset T |
0/0
N/A |
0/3
36.6% |
2/1
43.5% |
0/2
8.3% |
½
38.9% |
0/3
25.4% |
| Left Turn Versus Median U-Turn |
3/5
17.5% |
4/7
20.9% |
8/23
24.3% |
5/50
38.7% |
20/61
41.2% |
11/55
39.6% |
| Roundabout Versus Four Leg |
0/0
0 |
0/0
0 |
1/1
3.1% |
0/0
0 |
1/3
3% |
0/2
1.8% |
| Roundabout Versus Three Leg |
1/0
5.1% |
2/2
5.8% |
1/1
2.4% |
7/10
10.9% |
2/10
33.6% |
90/331
43.4% |
| Diamond Versus Double Roundabout |
13/4
24.4% |
4/1
18.6% |
23/11
23.6% |
7/5
9.3% |
68/69
35.3% |
43/105
16.1% |
* 33/16 means that there was an average of 33 crashes removed and then another 16 low-speed events removed for each replication of the design case. 65.8% is the average percentage of the removed events of the total conflict events recorded in the replication. In this example, the average of 49 low-speed and crash events constitutes 65.8% of an average 74.5 total conflict events. This would result in an average of 25.5 total valid conflicts.
The results in this table are discouraging because the number of crashes and low-speed events constitutes a large percentage of the total conflict events that occur in most of the scenarios tested. This table also indicates, similarly to the results of table 79, that the percentage of crashes to valid conflicts rises as the traffic volume rises, rather than staying consistent. This is most likely due to the reduction in the physical proximity of all vehicles and thus the increased probability of critical conflict events.
Summary
Based on the results of these theoretical validation case studies, the surrogate safety assessment methodology has some promise, yet additional work is still necessary.
First, some limitations of current microsimulation modeling capabilities have been identified. Up to now, the applications of microsimulation models have been to replicate and predict the capacity and level of service of roadway networks. The level of behavioral analysis necessary for SSAM goes beyond these types of analyses to a level of "nanoscopic" modeling that has not been necessary to date. This is most notably manifested in the occurrence of the vehicle-vehicle "crashes" that are due to approximation logic in the simulation system. These approximations fail to consider the following:
- The full extent of the dimensions of vehicles surrounding the maneuvering vehicle.
- Realistic vehicle dynamics at high-resolution time steps (e.g. articulation in trucks, virtually lateral lane changing at low speeds).
Other phenomena appear to arise as the result of combinations of the approximation logic underlying the rules of driver behavior. One example of this is a reduction in capacity of an approach when certain driver behavior rules are enacted to eliminate the occurrence of crashes on that approach. Improvement of microsimulation systems to remove these undesirable phenomena will improve the credibility of SSAM. To the extent possible, both models (from each pair of design/operational options) utilized identical geometries, traffic conditions, and configuration of parameters/priority-rules to ensure a best possible comparison of the relative safety.
Second, considering the "raw" results of the comparison of two design cases using the SSAM data does not typically result in a set of measures that clearly indicate the superiority of one design over another, at least for the test cases and design parameters exercised in this study. This clearly indicates that a multidimensional "index" is necessary to compare designs in some objective manner based on their performance of the following:
- Conflict occurrence rate.
- Conflict severity (measures of probability of collision).
- Resultant crash severity.
Comparison of two design cases on any one of the above "axes" can result in differing conclusions.
Previous | Table of Contents | Next
|


