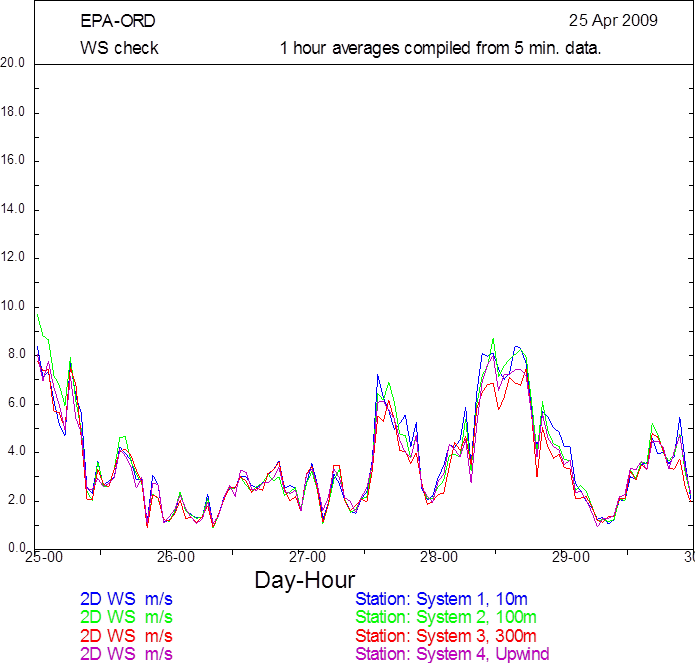
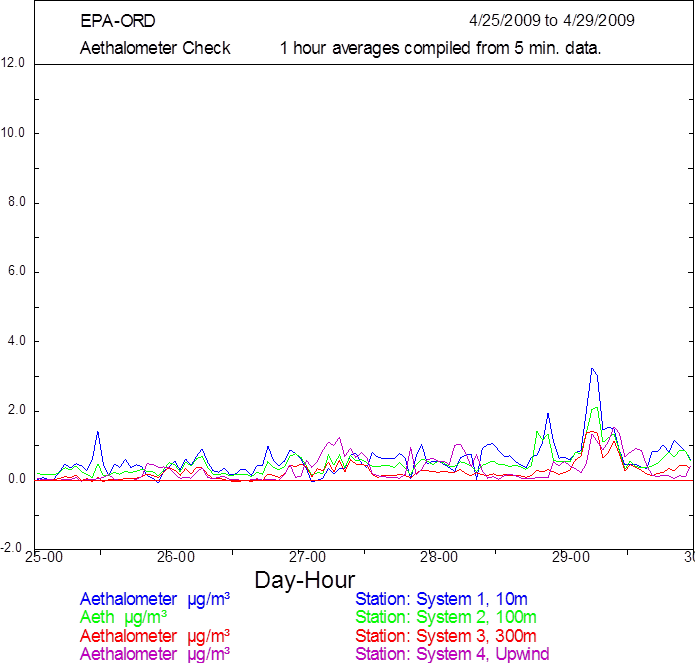
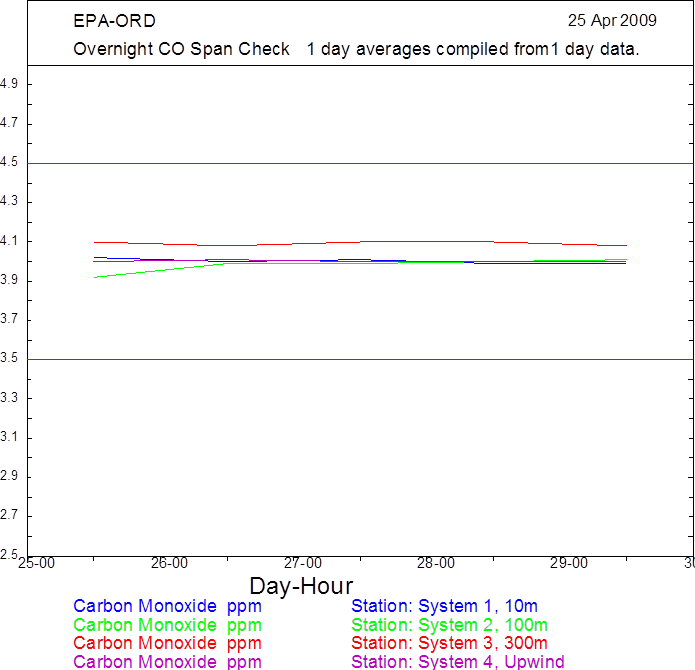
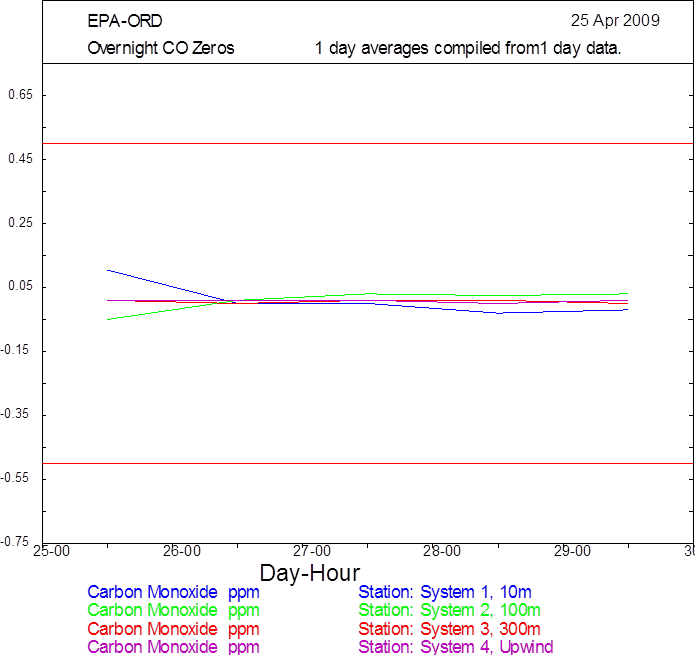
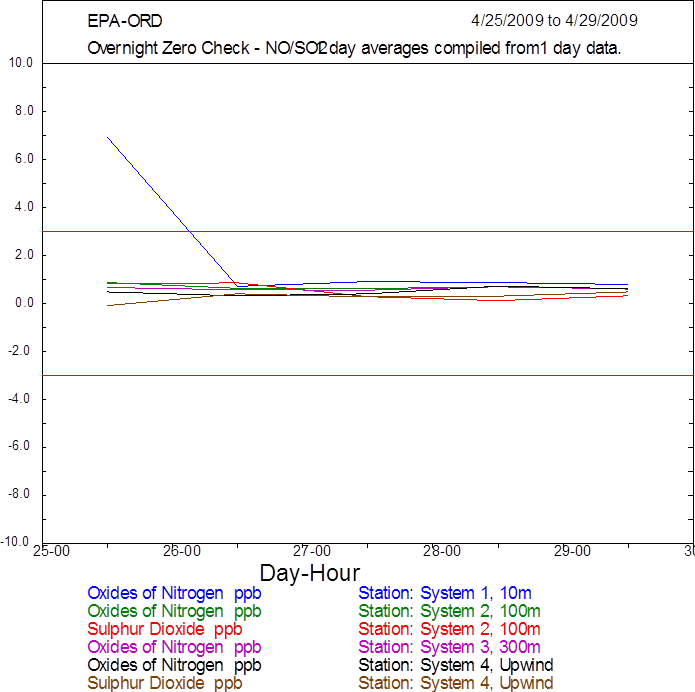
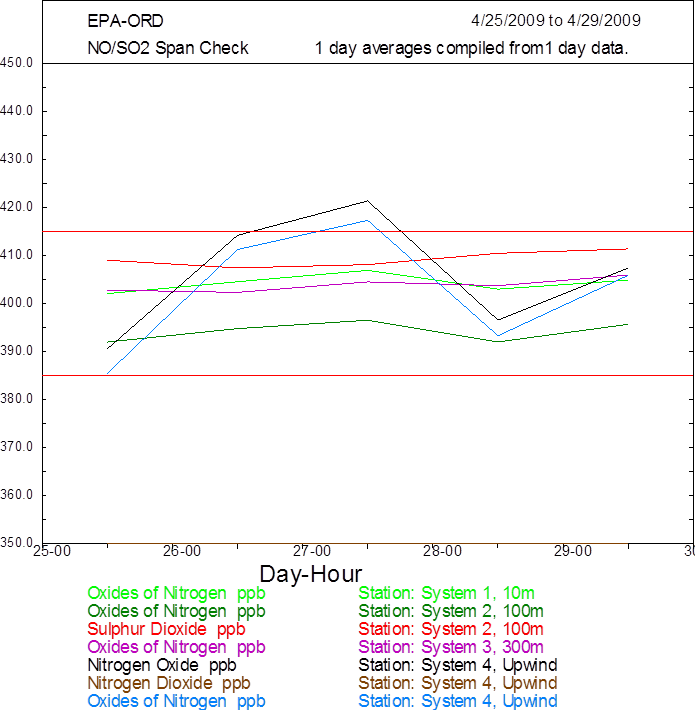
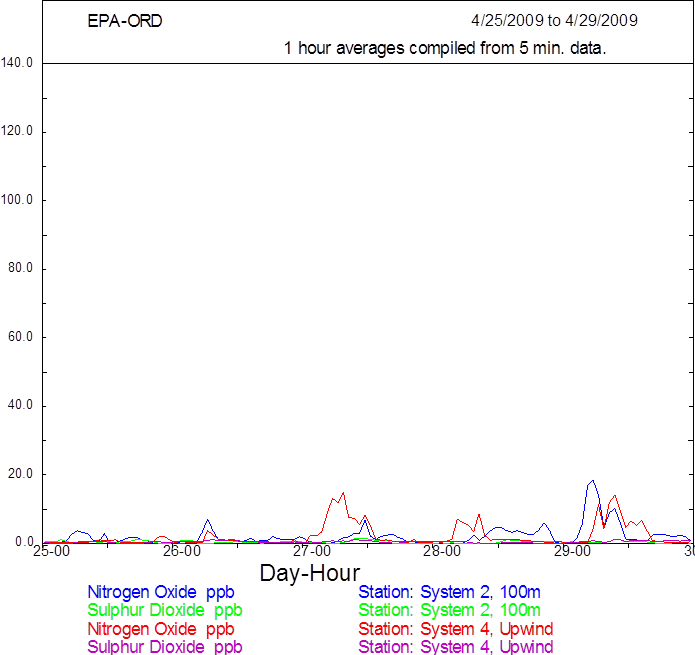
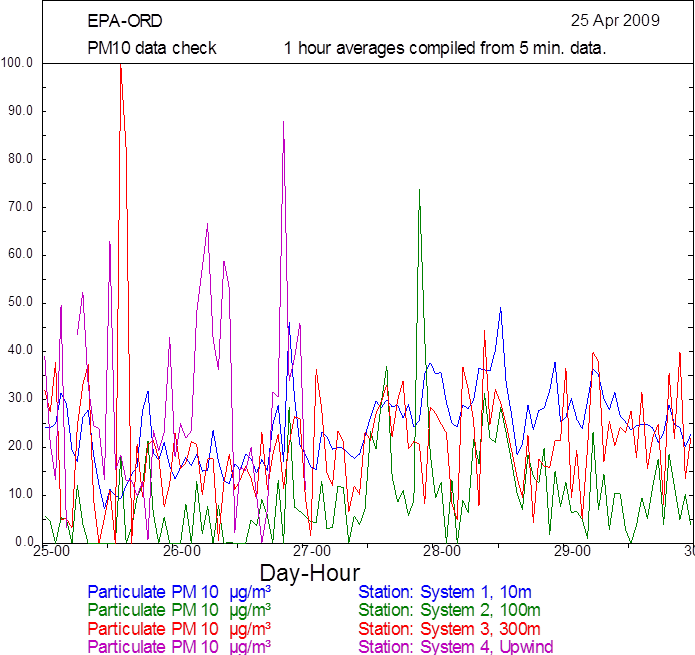
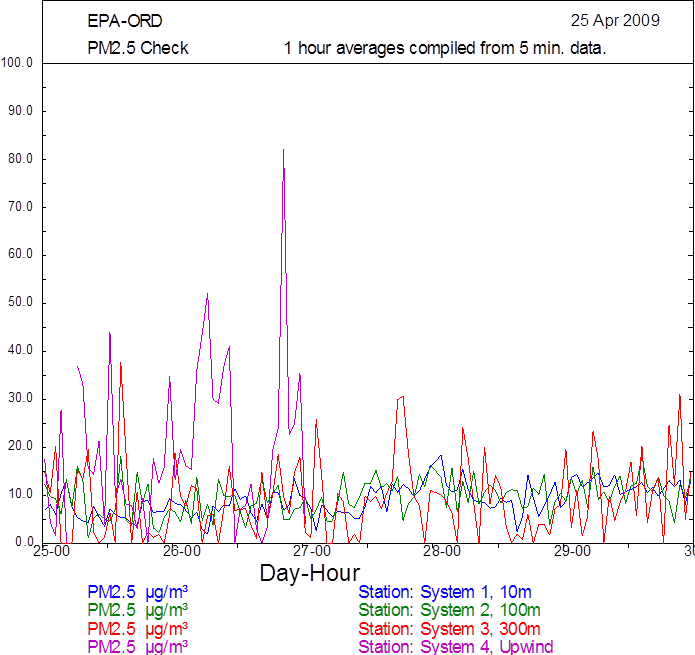
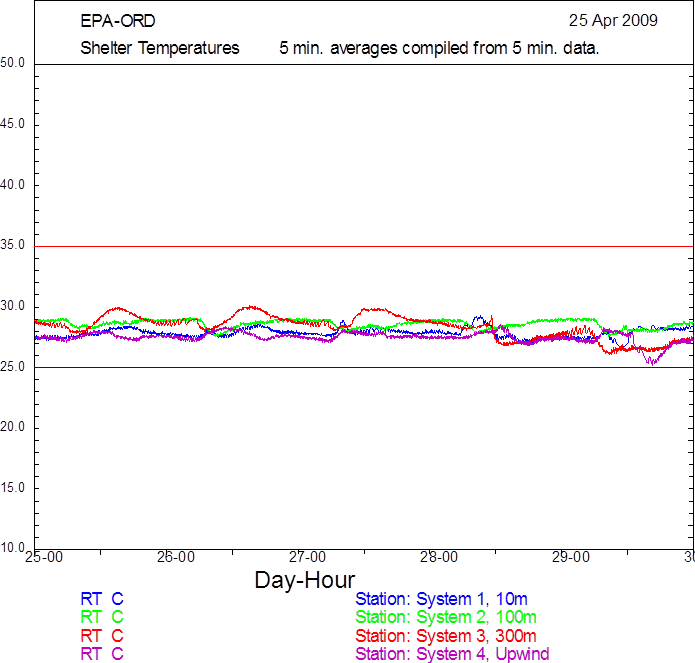
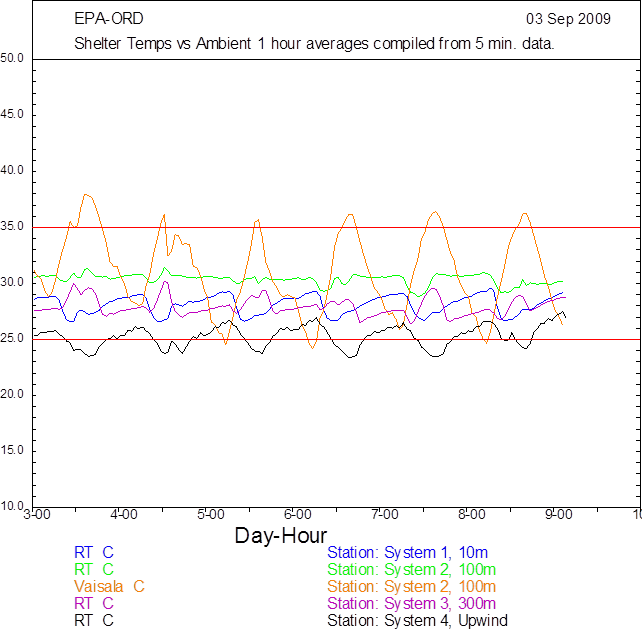
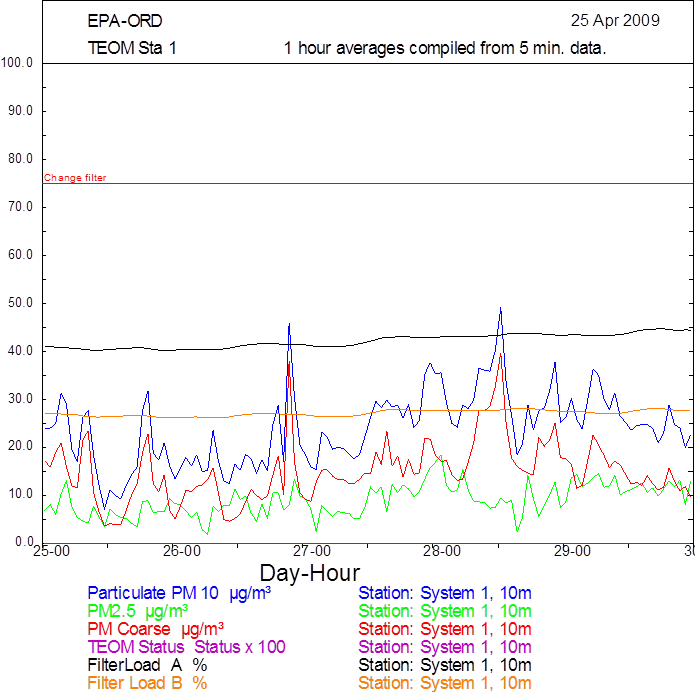
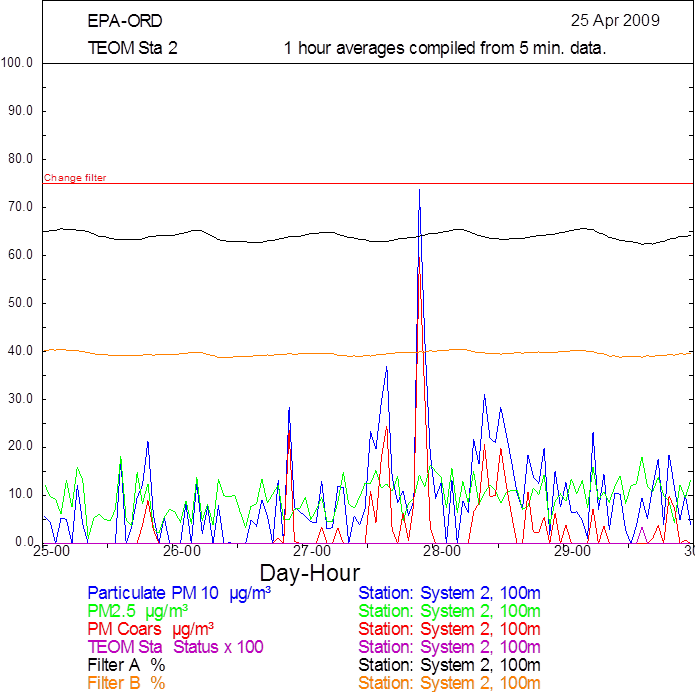
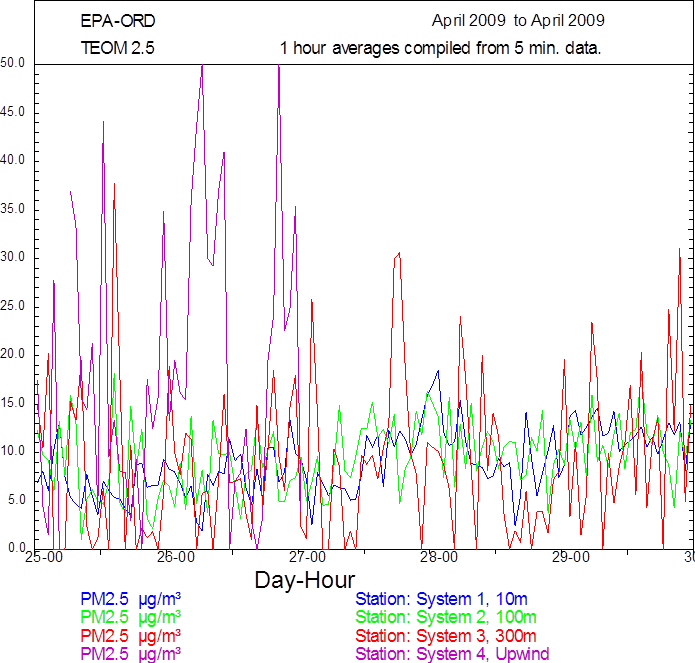
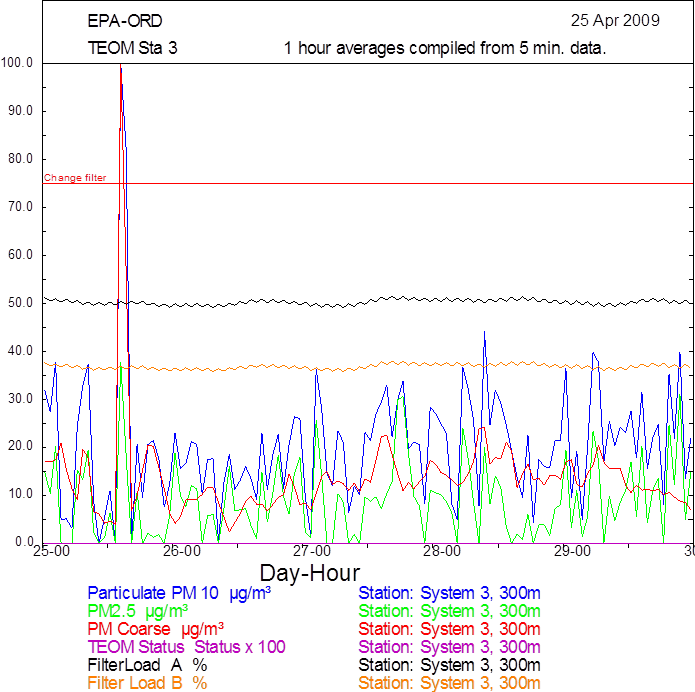
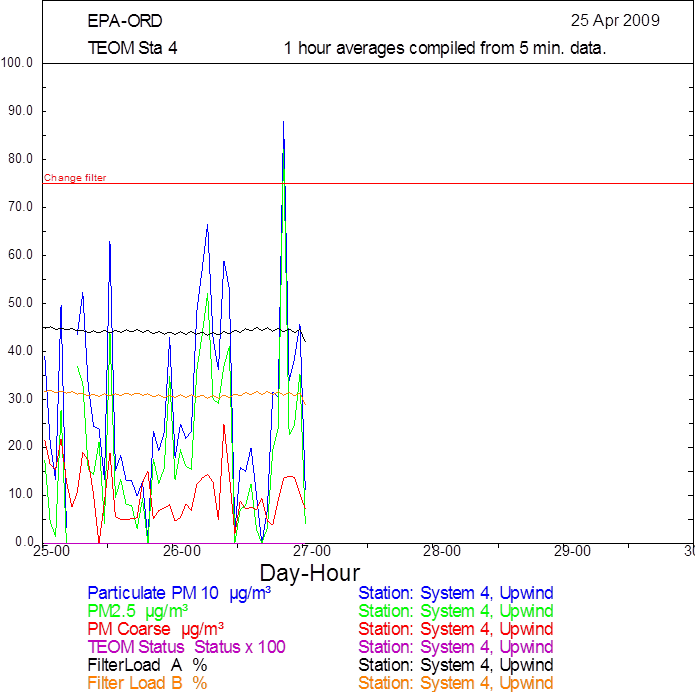
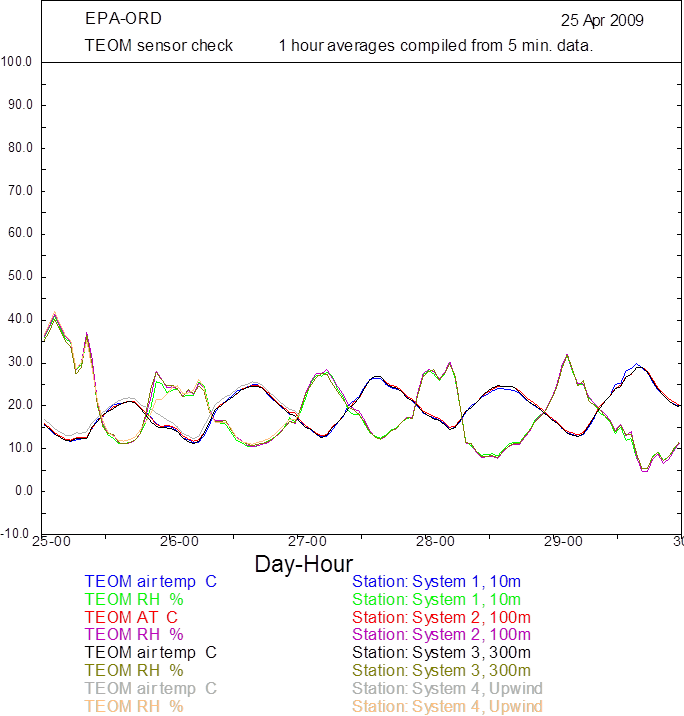
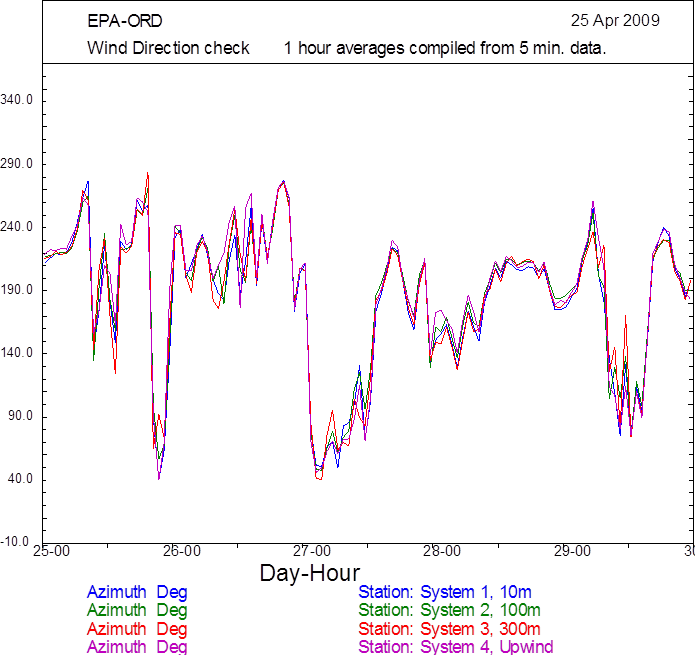
Each day, data was accessed using WinCollect. Graphical reports were run to determine instrument status and data validity. Examples of these graphical reports are shown on the following pages. Instrument issues were identified and noted in a logbook at the computer being used to run WinCollect. The graphs and any instrument issues were noted in an email to the site operator, EPA and contractor staff.