
Carbon monoxide (CO) was measured continuously at each station using Ecotech 9830 analyzers. Data logging software reported the data in 5-minute intervals. Data from all sites were reviewed as a part of the quality assurance (QA) process. During this review, it was noted that Site 4 exhibited a baseline shift in the data for the time period of September 29, 2010 through December 6, 2010. We reviewed the multi-point calibration worksheets for Site 4 and determined that the instrument during this period of time did indicate a linear response to the calibration points but the instrument did indicate higher than expected response values. In other words measured values were higher than expected values. From these multi-point calibration worksheets, it was determined that the following correction factors should be applied to specific time periods.
The appropriate linear regression equations are as follows:
1. y = 0.84x +0.81
2. y = 0.8373x +0.2135
where y = measured concentration and x = expected concentration.
For our purposes we need to solve for x. Therefore we have the following two equations for the relevant time periods:
1. corCO = |(0.81-CO)/0.84 |for September 29, 2010 12:00:00 AM thru December 3, 2010 8:10:00 AM
2. corCO = |(0.2135-CO)/0.8373| for December 3, 2010 10:35:00 AM thru December 3, 2010 1:35:00 PM
where: corCO = corrected CO concentration and CO = original measured concentration.
The following graph (Figure 59) show the results of correcting Site 4 (100 m upwind) CO values for the relevant time periods. The first is a time series graph showing uncorrected and corrected CO values for Site 4. Sites 1, 2 and 3 are show for comparative purposes. No corrections were made to Sites 1, 2, and 3 CO values
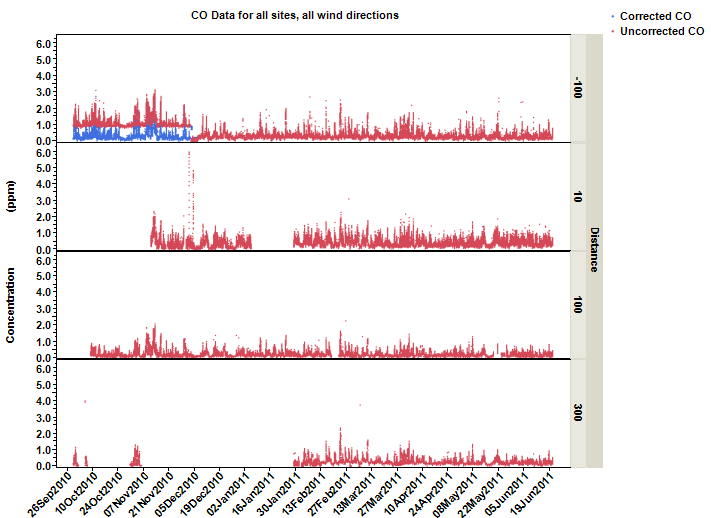
Figure 59 Time series - CO data for all sites, all wind conditions. Baseline shift is obvious for Site 4 (100 m upwind); uncorrected and corrected data are shown.

