This chapter describes a sample analysis of some emission reduction strategy options for the port terminals operated by the Port Authority of New York and New Jersey. This analysis was performed primarily using a recent origin-destination study which was performed during 2004 and 2005. Some relevant statistics from the Port Authority of New York and New Jersey Container Terminal Truck O-D survey are provided below, which may be useful for comparing with another port of interest.
Since some of the inputs required to perform the MOVES runs described in this section used data from the Port Authority of New York and New Jersey, it is important that users compare the data provided in Tables VI-1 and VI-2 below, to those of their port of interest in order to develop appropriate MOVES inputs.
Table VI-1 below summarizes key data from the Port Authority of New York and New Jersey for 2009. This data was taken from the Port Authority 2009 Annual Report12.
Activity |
Port Authority NY & NJ |
|---|---|
Total Containers (TEUs - Twenty-foot Equivalent Units) |
4,561,527 |
Total Cargo Tonnage (Metric Tons) |
28,240,770 |
Surface (Acres) |
1,340 |
Employment |
6,977 |
Operating Revenue ($ Thousands) |
3,552,243 |
Operating Income ($ Thousands) |
529,603 |
Table VI-2 shows the daily gate movements in and out of all container terminals surveyed. Based on findings from the two-day surveys taken during December 2004 in New York and one-day surveys taken during May 2005 in New Jersey, approximately 9,600 trucks enter and exit the marine container terminals on a typical day. Truck volumes to and from the Port Newark and Elizabeth Port Authority Marine Terminal were approximately 78 percent of the regional total, with approximately 7,490 trucks entering and exiting. Truck volumes to and from the marine container terminals are dependent upon the shipping line schedules and, therefore, daily volumes of trucks are variable.
|
|
Entering |
Leaving |
Total |
|---|---|---|---|---|
Loaded Containers |
|
2,324 |
5,410 |
7,734 |
|
Percent |
24% |
56% |
40% |
Empty Containers |
|
3,575 |
973 |
4,548 |
|
Percent |
37% |
10% |
24% |
Bobtails & Chassis |
|
3,733 |
3,249 |
6,982 |
|
Percent |
39% |
34% |
36% |
Total Daily Trucks |
|
9,632 |
9,632 |
19,264 |
|
Percent |
100% |
100% |
100% |
For the Port Authority of New York and New Jersey port terminals, the general practice is to open the gates at 6:00 a.m. and close at 4:00 p.m.
Overall, 74 percent of the survey respondents said that they typically spend about 2 hours or less at the seven container terminals surveyed which included queuing and processing time at the gates and the time spent inside the terminal for drop off or pick-up.
Time Interval |
Percentage |
|---|---|
½ hour or less |
10% |
About 1 hour |
21 |
About 1.5 hours |
17 |
About 2 hours |
26 |
About 3 hours |
15 |
About 4 hours |
6 |
Over 4 hours |
4 |
Do not know |
1 |
Total |
100 |
Using the basic information shown above for the Port Authority of New York and New Jersey ports, several emission control strategies that could be used to reduce emissions at ports were analyzed. The strategies evaluated included idling reduction, diesel retrofits, truck replacements, and freight diversion to rail. These are not intended to be an all-inclusive list of control strategies for reducing emissions at ports, but rather to demonstrate how such analyses can be conducted at the project level using the VSP profiles developed as discussed in Chapter II. The primary reductions from the freight diversion to rail strategy come from significant reductions in truck VMT. Thus, this strategy was not evaluated at the project level, but was an evaluation comparing the reduced truck emissions to the corresponding increase in rail emissions.
This section provides an overview of methodologies presented in Chapter VI.
Several states have laws that affect ports and marine terminals. They prohibit the idling of heavy-duty diesel trucks at marine terminals for more than 30 minutes (California, Illinois, Massachusetts, New Jersey, Texas, and Washington)13. A wide variety of idling reduction technologies exist; most of these are designed to provide services (e.g., heat, air conditioning, and/or electricity) to a vehicle that would otherwise require the operation of the main drive engine while the vehicle is temporarily parked or remains stationary. The following truck idling reduction technologies are verified by EPA14:
The impact of an idling reduction control strategy can be modeled in MOVES by adjusting the off-network link. As described in the MOVES user guide,16 the off-network provides information about vehicles which are not driving on the project links, but still contribute to the project emissions (while idling or starting for instance). For each vehicle type, the off-network input includes:
In order to model an idling reduction control strategy, the fraction of trucks idling (while waiting at the gate) was reduced; this fraction of trucks for which idling was reduced was added to the fraction of parked trucks and to the start fraction. For demonstration purposes, the case of an automatic shut-down system was selected; it was assumed that such a system does not have associated emissions. It is important to note that (when modeling other idling reduction technologies) emissions associated with the idling reduction control strategy need to be taken into account. Indeed, although overall emissions may decrease, emissions from the idling reduction technology itself need to be taken into account. The following section explains how the original off network link was created and how it was modified to model the idling reduction control strategy.
Source Type ID |
Vehicle |
Start |
Extended |
Parked |
|---|---|---|---|---|
61 |
625 |
0.64 |
0.35 |
0.64 |
Source Type ID |
Vehicle |
Start |
Extended |
Parked |
|---|---|---|---|---|
61 |
625 |
0.9025 |
0.0875 |
0.9025 |
Original off-network link (no idling reduction):
Modified off-network link (with idling reduction):
As mentioned above, the case of an automatic shut-down system was selected. Engines were modeled to turn-off after 30 minutes of idling. This threshold was selected based on the state laws affecting ports described earlier. The fraction of trucks idling (while waiting at the gate) was reduced; this fraction of trucks for which idling was reduced was added to the fraction of parked trucks and to the start fraction.
Various retrofit technologies are available and verified by EPA. A list of the diesel retrofit technologies that EPA has approved for use in engine retrofit programs can be found on EPA's website, along with each system's expected efficiency21. The Continuously Regenerating Technology 3 (CRT3) Particulate Filter was selected in this example (it is one of the most efficient systems verified by EPA). The expected emissions reductions from the Diesel Particulate Filters (DPF) are listed in the table below:
Emissions Reductions (%) |
|||
|---|---|---|---|
PM |
Carbon Monoxide |
Oxides of Nitrogen (NOx) |
Hydrocarbon |
90 |
72 |
n/a |
93 |
MOVES has the capability to model on-road vehicle retrofit strategies for all exhaust pollutants for diesel trucks. A retrofit input file was created to model the impact of using the CRT3 Particulate Filter. This retrofit input file is provided in Appendix B. Some of the parameters in that input file include:
The impact of a truck replacement control strategy can be modeled in MOVES by adjusting the vehicle age distribution input. E.H. Pechan & Associates, Inc. used the New York and New Jersey Regional Truck Replacement Program guidelines to develop the MOVES inputs (replacement of trucks that have engines model year 1993 or older with newer trucks model year 2004 to 2008). The original age distribution input was created based on data in "The Port Authority of New York and New Jersey Drayage Truck Characterization Survey." To model the truck replacement strategy, the fractions of trucks from 1993 and older were assumed to be zero and the original fractions were added to the newer truck fractions. The older trucks were modeled as being replaced with an even distribution of newer trucks that meet the New York and New Jersey Regional Truck Replacement Program criteria (20 percent of 2004, 20 percent of 2005, 20 percent of 2006, 20 percent of 2007, and 20 percent of 2008). With this method, it is possible to scale down the impact of the Truck Replacement Program by pro-rating the emissions reduction (x percent of the emissions reduction would be achieved if only x percent of the trucks were replaced with an even distribution of newer trucks). The table below shows the original age distribution and how it was modified to model the truck replacement.
Source |
Year ID |
Age ID |
Age Fraction |
|---|---|---|---|
61 |
2008 |
0 |
0.005 |
61 |
2008 |
1 |
0.0095 |
61 |
2008 |
2 |
0.026 |
61 |
2008 |
3 |
0.026 |
61 |
2008 |
4 |
0.035 |
61 |
2008 |
5 |
0.026 |
61 |
2008 |
6 |
0.039 |
61 |
2008 |
7 |
0.045 |
61 |
2008 |
8 |
0.069 |
61 |
2008 |
9 |
0.129 |
61 |
2008 |
10 |
0.129 |
61 |
2008 |
11 |
0.07 |
61 |
2008 |
12 |
0.05 |
61 |
2008 |
13 |
0.07 |
61 |
2008 |
14 |
0.07 |
61 |
2008 |
15 |
0.05 |
61 |
2008 |
16 |
0.049 |
61 |
2008 |
17 |
0.0029 |
61 |
2008 |
18 |
0.018 |
61 |
2008 |
19 |
0.016 |
61 |
2008 |
20 |
0.016 |
61 |
2008 |
21 |
0.0095 |
61 |
2008 |
22 |
0.016 |
61 |
2008 |
23 |
0.0030125 |
61 |
2008 |
24 |
0.0030125 |
61 |
2008 |
25 |
0.0030125 |
61 |
2008 |
26 |
0.0030125 |
61 |
2008 |
27 |
0.0030125 |
61 |
2008 |
28 |
0.0030125 |
61 |
2008 |
29 |
0.0030125 |
61 |
2008 |
30 |
0.0030125 |
Source |
Year ID |
Age ID |
Age Fraction |
|---|---|---|---|
61 |
2008 |
0 |
0.0453 |
61 |
2008 |
1 |
0.0498 |
61 |
2008 |
2 |
0.0663 |
61 |
2008 |
3 |
0.0663 |
61 |
2008 |
4 |
0.0753 |
61 |
2008 |
5 |
0.026 |
61 |
2008 |
6 |
0.039 |
61 |
2008 |
7 |
0.045 |
61 |
2008 |
8 |
0.069 |
61 |
2008 |
9 |
0.129 |
61 |
2008 |
10 |
0.129 |
61 |
2008 |
11 |
0.07 |
61 |
2008 |
12 |
0.05 |
61 |
2008 |
13 |
0.07 |
61 |
2008 |
14 |
0.07 |
61 |
2008 |
15 |
0 |
61 |
2008 |
16 |
0 |
61 |
2008 |
17 |
0 |
61 |
2008 |
18 |
0 |
61 |
2008 |
19 |
0 |
61 |
2008 |
20 |
0 |
61 |
2008 |
21 |
0 |
61 |
2008 |
22 |
0 |
61 |
2008 |
23 |
0 |
61 |
2008 |
24 |
0 |
61 |
2008 |
25 |
0 |
61 |
2008 |
26 |
0 |
61 |
2008 |
27 |
0 |
61 |
2008 |
28 |
0 |
61 |
2008 |
29 |
0 |
61 |
2008 |
30 |
0 |
Another option would be to replace an uneven distribution of trucks instead of replacing all trucks 1993 and older. For instance, another rule could be: the older the truck, the larger the proportion of trucks replaced. The table below shows how the age distribution can be modified to model such a program (it also lists the percentage of trucks replaced per model year). It was still assumed that trucks were replaced with 20 percent of 2004, 20 percent of 2005, 20 percent of 2006, 20 percent of 2007, and 20 percent of 2008. With this scenario, it is possible to scale down the impact of the program by pro-rating the emissions reduction (y percent of the emissions reduction would be achieved if instead of replacing 10 percent of 1993 trucks, 20 percent of 1992…, 100 percent of 1984, only (10*y) percent 1993, (20*y) percent of 1992…, (100*y) percent of 1984 trucks were replaced). Additional MOVES runs would be needed to evaluate the emission reduction, if the truck replacement followed a different pattern.
Source |
Year ID |
Age ID |
Age Fraction |
|---|---|---|---|
61 |
2008 |
0 |
0.02174375 |
61 |
2008 |
1 |
0.02624375 |
61 |
2008 |
2 |
0.04274375 |
61 |
2008 |
3 |
0.04274375 |
61 |
2008 |
4 |
0.05174375 |
61 |
2008 |
5 |
0.026 |
61 |
2008 |
6 |
0.039 |
61 |
2008 |
7 |
0.045 |
61 |
2008 |
8 |
0.069 |
61 |
2008 |
9 |
0.129 |
61 |
2008 |
10 |
0.129 |
61 |
2008 |
11 |
0.07 |
61 |
2008 |
12 |
0.05 |
61 |
2008 |
13 |
0.07 |
61 |
2008 |
14 |
0.07 |
61 |
2008 |
15 |
0.045 |
61 |
2008 |
16 |
0.0392 |
61 |
2008 |
17 |
0.00203 |
61 |
2008 |
18 |
0.0108 |
61 |
2008 |
19 |
0.008 |
61 |
2008 |
20 |
0.0064 |
61 |
2008 |
21 |
0.00285 |
61 |
2008 |
22 |
0.0032 |
61 |
2008 |
23 |
0.00030125 |
61 |
2008 |
24 |
0 |
61 |
2008 |
25 |
0 |
61 |
2008 |
26 |
0 |
61 |
2008 |
27 |
0 |
61 |
2008 |
28 |
0 |
61 |
2008 |
29 |
0 |
61 |
2008 |
30 |
0 |
Model Year |
% of Truck Replaced |
|---|---|
2008 |
0% |
2007 |
0% |
2006 |
0% |
2005 |
0% |
2004 |
0% |
2003 |
0% |
2002 |
0% |
2001 |
0% |
2000 |
0% |
1999 |
0% |
1998 |
0% |
1997 |
0% |
1996 |
0% |
1995 |
0% |
1994 |
0% |
1993 |
10% |
1992 |
20% |
1991 |
30% |
1990 |
40% |
1989 |
50% |
1988 |
60% |
1987 |
70% |
1986 |
80% |
1985 |
90% |
1984 |
100% |
1983 |
100% |
1982 |
100% |
1981 |
100% |
1980 |
100% |
1979 |
100% |
1978 |
100% |
Another strategy that can be employed to reduce port-related emissions is to divert freight from trucks to rail. Diversion of freight is an alternative that is currently being considered for the Port Authority of New York and New Jersey ports.22 Based on this current study, the diversion of long-haul truck trips (defined as trips of 500 miles or more) could reduce approximated 10 percent of the truck tonnage transported to or from these ports. When freight is diverted from trucks to rail over long distances, there is generally a significant emissions savings.
EPA has estimated the average emission factors for locomotives by calendar year, factoring in the emission standards applicable by model year and the populations of locomotives of each model year expected to be in place in a given calendar year.23 EPA converted the emission factors in grams per brake horsepower-hour to grams per gallon by using a horsepower-hour per gallon conversion factor. These resulting emission factors in grams per gallon are shown in the table below. EPA has also noted that based on data collected by the Association of American Railroads, approximated one gallon of fuel is consumed when hauling 400 ton-miles of freight. Using this conversion factor, the table below shows the resulting emission factor by pollutant in grams per ton-mile of freight hauled by a large line-haul locomotive in 2008.
Pollutant |
Calendar Year 2008 Large Line Haul Average Emission Factor |
Calendar Year 2008 Large Line Haul Average Emission Factor |
2008 Emissions to Carry 25 Tons of Freight 500 Miles by Rail (grams) |
|---|---|---|---|
NOx |
169 |
0.423 |
5,281 |
HC |
9.0 |
0.023 |
281 |
PM10 |
5.1 |
0.013 |
159 |
While there is no standard weight of a container moved by rail or freight truck, for this analysis, we have assumed a weight of 50,000 pounds or 25 tons. The resulting rail emissions for hauling one 25 ton container 500 miles by rail are shown in the table above. These emissions were then compared to the emissions from one combination long-haul truck driving the same distance.
To estimate comparable truck emissions, MOVES was used to estimate the emission rate in grams per mile of a combination long-haul truck traveling through the New York area. This run was made at the county level of MOVES, using county-level defaults. This was done because the emissions from the 500-mile trip will greatly outweigh the emissions in the port area, so the operating mode profiles developed under this project were not relevant to this strategy. The table below shows the resulting truck emissions and the percentage reduction in emissions from one trip diverted from truck travel to rail.
Pollutant |
2008 Emissions to Carry 25 Tons of Freight 500 Miles by Rail (grams) |
Calendar Year 2008 Emissions for a Long-Haul Truck Traveling 500 miles (grams) |
Percentage Reduction in Emissions per Trip (%) |
|---|---|---|---|
NOx |
5,281 |
10,632 |
50 |
Volatile Organic Compounds (VOCs) |
281 |
400 |
30 |
PM10 |
159 |
506 |
68 |
Three of the VSP profiles that were developed by microsimulation were tested in MOVES:
For each one of these VSP profiles, emissions24 were estimated for four control strategies:
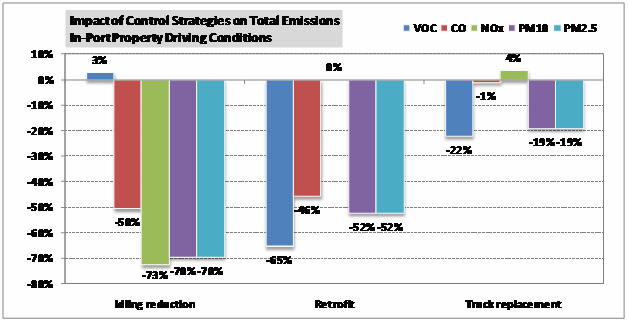
Figures VI-1, VI-2, and VI-3 present the results of the MOVES runs for the scenarios described above (total emissions). Figures VI-4, VI-5, and VI-6 illustrate the emissions reduction obtained from the idling reduction, diesel retrofits, and truck replacement strategies, compared to the baseline. Those results are shown numerically in Tables VI-3, VI-4, and VI-5.
Figure VI-1. MOVES Emissions Output - Port Gate 10 Trucks per Hour Scenario
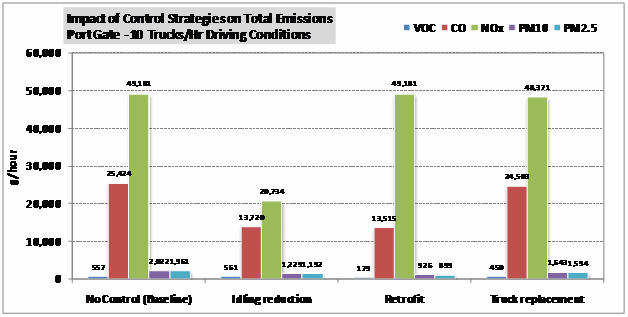
Figure VI-2. MOVES Emissions Output - Port Gate 60 Trucks per Hour Scenario
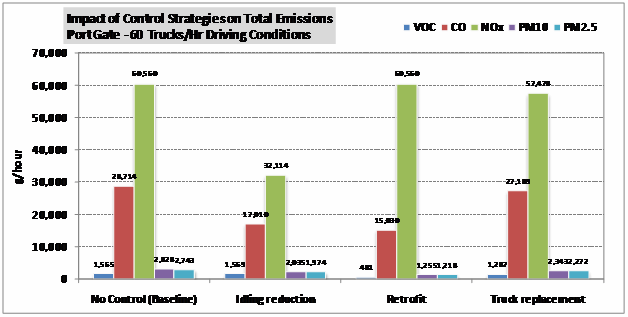
Figure VI-3. MOVES Emissions Output - In Port Property Scenario
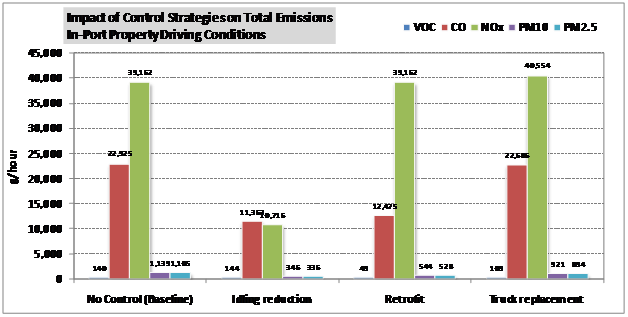
Figure VI-4. MOVES Emissions Reductions - Port Gate 10 Trucks per Hour Scenario
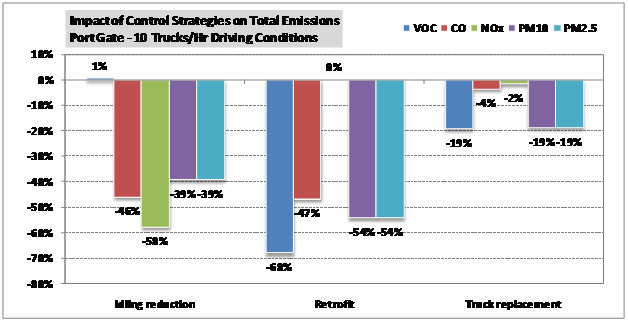
Figure VI-5. MOVES Emissions Reductions - Port Gate 60 Trucks per Hour Scenario
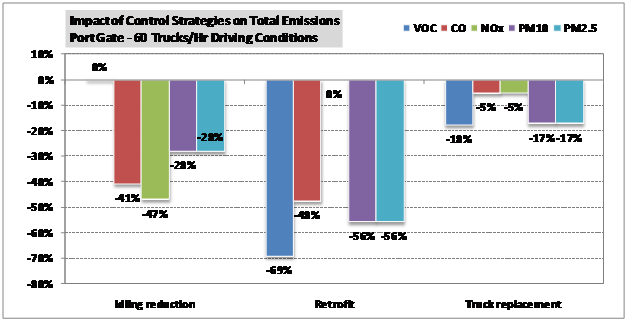
Figure VI-6. MOVES Emissions Reductions - In Port Property Scenario
Scenario |
Control Strategy |
VMT |
# of Vehicles |
# of Starts |
Hours Idling Extended |
Pollutant |
Total Output (g) |
Comparison with Baseline |
|---|---|---|---|---|---|---|---|---|
Port Gate 10 Trucks/Hour |
No Control (Baseline) |
531 |
2,978 |
400 |
219 |
VOC |
557 |
Baseline |
CO |
25,424 |
|||||||
NOx |
49,181 |
|||||||
PM10 |
2,022 |
|||||||
PM2.5 |
1,961 |
|||||||
Idling Reduction |
531 |
2,978 |
564 |
55 |
VOC |
561 |
1% |
|
CO |
13,720 |
-46% |
||||||
NOx |
20,734 |
-58% |
||||||
PM10 |
1,229 |
-39% |
||||||
PM2.5 |
1,192 |
-39% |
||||||
Retrofit |
531 |
2,978 |
400 |
219 |
VOC |
179 |
-68% |
|
CO |
13,515 |
-47% |
||||||
NOx |
49,181 |
0% |
||||||
PM10 |
926 |
-54% |
||||||
PM2.5 |
899 |
-54% |
||||||
Truck Replacement |
531 |
2,978 |
400 |
219 |
VOC |
450 |
-19% |
|
CO |
24,503 |
-4% |
||||||
NOx |
48,371 |
-2% |
||||||
PM10 |
1,643 |
-19% |
||||||
PM2.5 |
1,594 |
-19% |
Scenario |
Control Strategy |
VMT25 |
# of Vehicles26 |
# of Starts |
Hours Idling Extended |
Pollutant |
Total Output (g)27 |
Comparison with Baseline |
|---|---|---|---|---|---|---|---|---|
Port Gate 60 Trucks/Hour |
No Control (Baseline) |
574 |
3,075 |
400 |
219 |
VOC |
1,565 |
Baseline |
CO |
28,714 |
|||||||
NOx |
60,560 |
|||||||
PM10 |
2,828 |
|||||||
PM2.5 |
2,743 |
|||||||
Idling Reduction |
574 |
3,075 |
564 |
55 |
VOC |
1,569 |
0% |
|
CO |
17,010 |
-41% |
||||||
NOx |
32,114 |
-47% |
||||||
PM10 |
2,035 |
-28% |
||||||
PM2.5 |
1,974 |
-28% |
||||||
Retrofit |
574 |
3,075 |
400 |
219 |
VOC |
481 |
-69% |
|
CO |
15,030 |
-48% |
||||||
NOx |
60,560 |
0% |
||||||
PM10 |
1,255 |
-56% |
||||||
PM2.5 |
1,218 |
-56% |
||||||
Truck Replacement |
574 |
3,075 |
400 |
219 |
VOC |
1,287 |
-18% |
|
CO |
27,189 |
-5% |
||||||
NOx |
57,478 |
-5% |
||||||
PM10 |
2,343 |
-17% |
||||||
PM2.5 |
2,272 |
-17% |
Scenario |
Control Strategy |
VMT |
# of Vehicles |
# of Starts |
Hours Idling Extended |
Pollutant |
Total Output (g) |
Comparison with Baseline |
|---|---|---|---|---|---|---|---|---|
In-Port Property |
No Control (Baseline) |
22 |
638 |
400 |
219 |
VOC |
140 |
Baseline |
CO |
22,925 |
|||||||
NOx |
39,162 |
|||||||
PM10 |
1,139 |
|||||||
PM2.5 |
1,105 |
|||||||
Idling Reduction |
22 |
638 |
564 |
55 |
VOC |
144 |
3% |
|
CO |
11,363 |
-50% |
||||||
NOx |
10,716 |
-73% |
||||||
PM10 |
346 |
-70% |
||||||
PM2.5 |
336 |
-70% |
||||||
Retrofit |
22 |
638 |
400 |
219 |
VOC |
49 |
-65% |
|
CO |
12,475 |
-46% |
||||||
NOx |
39,162 |
0% |
||||||
PM10 |
544 |
-52% |
||||||
PM2.5 |
528 |
-52% |
||||||
Truck Replacement |
22 |
638 |
400 |
219 |
VOC |
109 |
-22% |
|
CO |
22,686 |
-1% |
||||||
NOx |
40,554 |
4% |
||||||
PM10 |
921 |
-19% |
||||||
PM2.5 |
894 |
-19% |
Before discussing the findings for the three control strategies modeled, it is interesting to note that the percent reductions for PM2.5 and PM10 in the above tables are the same. This stems from the fact that the MOVES PM10 emissions are a product of PM2.5 emissions (for each emissions process) and a PM10 emission ratio. This PM10 emission ratio is a unitless factor for the amount of PM10 created per unit of PM2.5 (this factor varies by the output pollutant, the source type, and the fuel type)28.
The idling reduction strategy decreases CO, NOx, and PM emissions significantly. For instance, for the Port Gate 10 Trucks per Hour Scenario, emissions reductions are -56 percent, -58 percent, and -39 percent, respectively. It is important to note that in this particular example, idling emissions account for a large portion of the total baseline emissions (with no control strategy). This is due to the fact that driving distances are short (approach to gate only) and thus emissions from the "running" processes are comparatively low. Therefore, a drop in idling emissions translates into a drop in total emissions. VOC emissions are not affected by idling reduction because MOVES does not consider that any VOC emissions are generated during idling.
The retrofit control strategy has a significant impact on VOCs, CO, and PM. For the Port Gate 10 Trucks per Hour Scenario, the emissions reductions are -68 percent, -48 percent, and -56 percent, respectively. These reductions are directly correlated with the efficiency of the retrofit technology (in this case the CRT3 Particulate Filter); the chosen system does not have the capability of decreasing NOx, which is why those emissions remained constant.
Finally, the truck replacement strategy is the only one that leads to a change in the emissions of all pollutants. For the Port Gate 10 Trucks per Hour Scenario, those reductions were -19 percent for VOC, -19 percent for PM, -2 percent for NOx, and -4 percent for CO. The impact on emissions was not as significant as the one observed with other control strategies. The comment above about short driving distances (and thus low emissions from the "running" processes) is at the root of this phenomenon. If the emissions from the entire trip were to be taken into account, the drop in emissions would be more significant (the reductions in emissions from the "running" processes only range from -18 percent to -24 percent). One surprising result is the increase of NOx emissions with the truck replacement strategy for the In Port Property Scenario. Below is a possible explanation for this phenomenon:
In order to assess if the impact of control strategies varies depending on the driving conditions, a MOVES-generated "Default" VSP profile was modeled in MOVES 30. Emissions from this "Default" VSP profile were estimated for the same four control strategies:
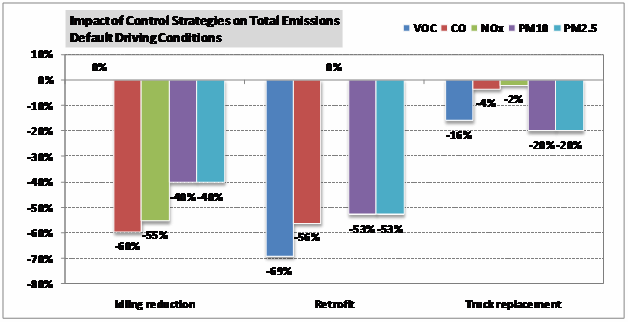
Figure VI-7 presents the results of the MOVES run for the scenarios described above (total emissions). Figure VI-8 illustrates the emissions reduction obtained from the idling reduction, diesel retrofit, and truck replacement strategies, compared to the baseline. Those results are shown numerically in Table VI-6.
Figure VI-7. MOVES Emissions Output - "Default" VSP Profile
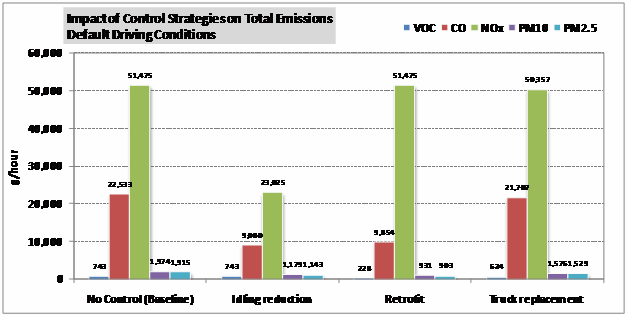
Figure VI-8. MOVES Emissions Reductions - "Default" VSP Profile
Scenario |
Control Strategy |
VMT31 |
# of Vehicles32 |
# of Starts |
Hours Idling Extended |
Pollutant |
Total Output (g)33 |
Comparison with Baseline |
|---|---|---|---|---|---|---|---|---|
Default Driving Conditions |
No Control (Baseline) |
531 |
2,978 |
400 |
219 |
VOC |
743 |
Baseline |
CO |
22,533 |
|||||||
NOx |
51,475 |
|||||||
PM10 |
1,974 |
|||||||
PM2.5 |
1,915 |
|||||||
Idling Reduction |
531 |
2,978 |
564 |
55 |
VOC |
743 |
0% |
|
CO |
9,080 |
-60% |
||||||
NOx |
23,025 |
-55% |
||||||
PM10 |
1,179 |
-40% |
||||||
PM2.5 |
1,143 |
-40% |
||||||
Retrofit |
531 |
2,978 |
400 |
219 |
VOC |
228 |
-69% |
|
CO |
9,854 |
-56% |
||||||
NOx |
51,475 |
0% |
||||||
PM10 |
931 |
-53% |
||||||
PM2.5 |
903 |
-53% |
||||||
Truck Replacement |
531 |
2,978 |
400 |
219 |
VOC |
624 |
-16% |
|
CO |
21,707 |
-4% |
||||||
NOx |
50,357 |
-2% |
||||||
PM10 |
1,576 |
-20% |
||||||
PM2.5 |
1,529 |
-20% |
Table VI-7 summarized the results from the control strategy analyses when using the MOVES default operating mode profiles with the comparable results when using the operating mode profiles developed based on port conditions. This table shows that the results differ most significantly for the idling reduction strategy. For the retrofit control strategy, CO showed fairly significant differences in emission reduction percentages when the port-specific profiles were used compared to the MOVES defaults. However, for VOC and PM, the results were relatively similar. The truck replacement strategy showed only minor differences in emission reduction percentages for all pollutants when the default operating modes were used as opposed to the port-specific profiles.
Overall, the differences between default drive cycles and VSP profiles are rather small. One reason is that whether a VSP profile is provided or not, "extended" idling emissions are the same (because the off network input which is applied in both cases, does not change). However, as described earlier (in Chapter VI section C), idling emissions account for a large portion of the total baseline emissions in this particular example (because driving distances are short and thus emissions from the "running" processes are low comparing to idling emissions). Therefore, a significant portion of the baseline emissions are exactly the same for default drive cycles and input VSP profiles. This can explain limited differences among the scenarios, even if VSP profiles are different. If only running emissions were modeled (and/or if different off network inputs were developed), then larger differences between VSP profiles would likely be observed. Another possible reason is that while no operating mode was input for the default drive cycles, the links average speed was provided. This average speed was the same as the one used in the Port Gate 10 trucks per hour scenario.
|
|
Emissions Reductions of 3 Control Strategies for 4 Different Scenarios |
|||
|---|---|---|---|---|---|
Control Strategy |
Pollutant |
Default Driving Conditions |
Port Gate 10 Trucks/Hour |
Port Gate 60 Trucks/Hour |
In-Port Property |
No Control (Baseline) |
VOC |
Baseline |
|||
CO |
|||||
NOx |
|||||
PM10 |
|||||
PM2.5 |
|||||
Idling Reduction |
VOC |
0% |
1% |
0% |
3% |
CO |
-60% |
-46% |
-41% |
-50% |
|
NOx |
-55% |
-58% |
-47% |
-73% |
|
PM10 |
-40% |
-39% |
-28% |
-70% |
|
PM2.5 |
-40% |
-39% |
-28% |
-70% |
|
Retrofit |
VOC |
-69% |
-68% |
-69% |
-65% |
CO |
-56% |
-47% |
-48% |
-46% |
|
NOx |
0% |
0% |
0% |
0% |
|
PM10 |
-53% |
-54% |
-56% |
-52% |
|
PM2.5 |
-53% |
-54% |
-56% |
-52% |
|
Truck Replacement |
VOC |
-16% |
-19% |
-18% |
-22% |
CO |
-4% |
-4% |
-5% |
-1% |
|
NOx |
-2% |
-2% |
-5% |
4% |
|
PM10 |
-20% |
-19% |
-17% |
-19% |
|
PM2.5 |
-20% |
-19% |
-17% |
-19% |
|