
This program will evaluate highway traffic noise reduction benefits gained from the use of asphalt-rubber asphalt concrete friction courses (ARFCs) in Arizona. While highway pavement selection has historically been based upon safety and durability, recent interest in quiet pavements requires that noise characteristics also be considered. This study is intended to demonstrate the effectiveness of quiet pavement strategies and to evaluate any changes in their noise mitigation properties with time.
During the early and mid 1990s ADOT received input from the public regarding noise generated by the current PCCP textures employed in the Phoenix Metropolitan area. This input often included a comparison to the ARFC sections that had been placed as experimental features. ADOT's own internal observations also supported the reduced noise characteristics of ARFCs.
To address this issue, ADOT initiated a research project in 1995 to compare traffic noise levels generated by ARFCs and PCCP surfaces. The study, conducted by JHK and Associates, was originally developed to provide baseline measurements to enable observation of selected pavement noise characteristics over time. To accomplish this, both roadside measurements and vehicle-based measurements were obtained. The vehicle-based approach was a low budget attempt to provide network level capability for measuring the change in noise generation characteristics.
The results of the 1995 testing indicated that: "Roadside noise levels near a tined PCCP surface were 3.3-5.7 dBA greater than the levels measured near an adjoining ARFC surface. Based on four separate hourly measurements, the average difference between the two surfaces was 4.7 dBA.
The study also reported differences in properties between ARFC of different ages and dramatic differences between PCCP surfaces with different texture properties (i.e. grinding, grooving, and tining). Unfortunately, the study was quite limited and most of the issues were not addressed in a comprehensive manner.
In 1998 an attempt was made to resurvey the sections evaluated in the 1995 study using the vehicle-based system. As was originally feared, the very modest approach to a vehicle-based measurement system proved inadequate to re-survey the sections and was subsequently abandoned.
ADOT continued to pursue the development of a near field measurement system. Finally, in 2002 ADOT had an ISO standard Close Proximity (i.e. CPX) trailer constructed. This trailer complied with the ISO standard in every way except for the tire types used in testing. The European community uses smaller diameter and narrower tires than used on US highways. So more representative tires were selected for the near-field testing.
During the summer of 2002 ADOT conducted a network level survey (i.e. CPX testing) of ARFCs ranging in age between 3 years and 12 years. Several projects were sampled for each age category. The results of this testing are shown in Figure 1. The results indicated that ARFC surfaces typically produced CPX noise levels between 94 and 99 dBA throughout their ten-year design period. The data further suggested that there was approximately a 5-dBA reduction in noise attenuation characteristics with time.
ARFC Noise Levels Versus Pavement Age
Figure 1: Graph of CPX Noise Levels for ARFC as a Function of Pavement Age
In the summer of 2002, additional testing was conducted on selected PCCP tining textures to evaluate whether additional noise reduction could be achieved by modifying the current PCCP tining procedures. Three tining textures were evaluated on a newly constructed PCCP and existing PCCP section on SR 202 between Gilbert and Higley road. The textures included ADOT's current uniform transverse tining, a one-inch uniformly spaced longitudinal tining, and the Wisconsin DOT random transverse tining. The results of this effort are shown in Figure 2. As evident in Figure 2, the FHWA promoted Wisconsin random texture did not produce a quieter pavement texture. It was actually the noisiest surface. Subsequent narrow band analysis indicated that the tonal spikes were removed by the random texture as purported, but the resulting total noise levels were still higher. This is presumably due to the wider effective spacing of the Wisconsin specification. At that time ADOT began change ordering longitudinal tining as a replacement for the uniform random tining on active construction projects.
Uncorected CPX dBA Levels as a Function of Texture Type and Speed
Figure 2: Graph of CPX Noise Level as a Function of Pavement Speed and Texture Type
An additional observation at that time was that the standard ADOT uniform transverse texture produced a CPX noise level of approximately 101 dBA at 60 MPH. This was 2-3 dBA higher than attained by ARFCs at the end of their design life. This indicated that current PCCP construction technology could not achieve the noise reduction benefits of ARFCs. Even though ADOT changed its PCCP tining to longitudinal tining, it was realized that the longitudinal tining could not compete with ARFC noise reduction qualities.
Due to the surprising findings regarding PCCP texture types, additional testing was pursued. This involved conducting pass-by testing alongside each of the tining types.
The results of that testing are shown in Figure 3. As evident in Figure 3, the random tining was the noisiest, followed by the ADOT uniform transverse followed by the uniform longitudinal tining. The relationship between the texture types was similar to what was found with CPX measurements.
During this same time period, citizen complaints were on the rise regarding the noise generation characteristics of PCCP in the Phoenix area. The recent overlay of the US 60 design build project with ARFC further fueled complaints as the ARFC surfacing dramatically reduced in-vehicle noise levels making motorists more aware of the differences between pavement types and the effectiveness of quiet pavements.
ADOT PCC Pavement Study
Figure 3: Graph of Pass-by Noise Levels Versus Vehicle Speed and Pavement Tining Type
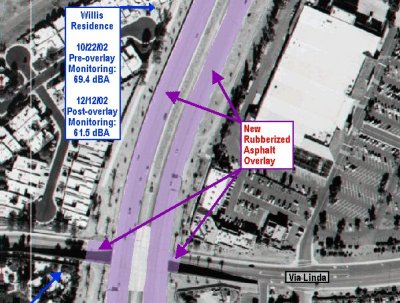
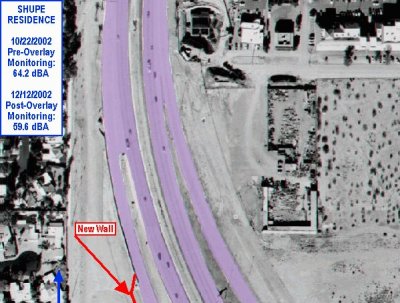
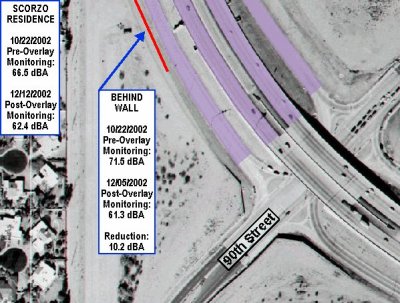
Based on citizen input in the Scottsdale area regarding a section of SR 101, a one-mile long section of PCCP was overlaid with ARFC to demonstrate the effectiveness of the quiet pavement strategy. Before and after close proximity testing indicated that there was approximately an 11-dBA difference in noise levels.
Far field test results taken at the residence locations are shown in Figure 4. The pre and post overlay noise levels are indicated at each monitored location.
As a result of the previous studies discussed above, ADOT will utilize a noise reduction adjustment factor of - 4 dBA for ARFC in the Quiet Pavement Pilot Program.
ADOT requests the application of this pilot program to all of the projects listed in Table 1. The projects represent 27 segments, which will be completed through six separate construction projects over the next three years. All pilot program projects will be Type I projects, as defined in 23 CFR Part 772 - Procedures for Abatement of Highway Traffic Noise and Construction Noise.
When conducting traffic noise analyses for projects in the above locations (where ARFCs will be utilized), ADOT will apply a pavement adjustment factor to reduce the overall A-weighted predicted noise levels by 4 dBA. ADOT will apply the adjustment to predicted traffic noise levels, both to identify highway traffic noise impacts and to design highway noise barriers. When walls are to be constructed, the combination of the noise reduction due to pavement and the noise reduction resulting from the barrier's insertion loss must result in a substantial noise reduction, i.e. at least a 5-dBA noise reduction.
NOTE: When using STAMINA 2.0/OPTIMA, a "shielding factor" of 4 will be applied in the calculations. When using FHWA TNM, "average pavement" and an "adjustment factor" of - 4 will be applied in the calculations. Prior to applying the 4-dBA reduction, either model must be calibrated to the existing condition by comparisons of the modeled noise level results to high quality noise level measurements obtained at existing pavement sites using video recorded traffic counts and classifications as input. Noise barriers should also be designed to allow for additional height to be added to the barriers, if necessary.
If measurements after ARFC construction determine that a reduction of at least 4 dBA is not being achieved, ADOT agrees to the following to provide necessary measures to abate highway traffic noise levels in perpetuity:
If quiet pavements are used as a noise mitigation strategy in the noise modeling, and it is determined the pavement has not achieved the assumed level of mitigation, ADOT will resurface the roadway to achieve the assumed level of noise reduction or provide a similar level of noise mitigation through more conventional techniques, like barrier walls or berms.
ADOT will collect data through actual field measurements for each pilot project with an intention to collect data necessary to accomplish the following:
For the purposes of this workplan, each construction project will be evaluated as a pilot project. For each pilot project (i.e. construction project), ADOT will develop an evaluation plan for submission to the FHWA for approval. This plan will identify the location and description of all Site 2 measurement sites; the measurement methodology, including specific instrumentation type and test procedures. The Site 1 test locations will be as described in Table 2. The Site 3 locations will be submitted to the FHWA for approval along with the test plan for these locations.
The proposed plan is shown in Table 2. The definition of each of the site types (ie. 1, 2 & 3) are described below:
The test plan begins with a column designated as category to distinguish the categories of testing. Test type provides additional clarity. Test method is the referenced standard for the testing. Test duration indicates the period of time that the respective test would occur over. The test frequency indicates how many times a year the test will be conducted. The before and after columns refer to pre-overlay and post-overlay testing. The site type column will be explained in greater detail below. The evaluation period indicates how many years each of the specific tests will be conducted.
This plan is based upon three different site conditions, referred to as site type in Table 2.
Site 1 designates ADOT's typical pavement management system data collection activity. That is, at each milepost, the specified pavement attribute is measured in the travel lane. This testing would occur for all milepost locations included within the construction of the quiet pavement overlays. Minimal environmental data would be collected at these sites. Simply, air and pavement temperatures.
In addition to the Site 1 locations, the near-field testing will be conducted at both the Site 2 and 3 locations.
Site 2 designates the sites that would typically be called conformance or compliance testing in ADOT's current program. These sites are where ADOT would conduct before and after studies to evaluate how the residences are impacted. As previously mentioned it is anticipated at this time that approximately 6 construction projects will be used to construct all the overlays. This test plan assumes a minimum of three Site 2 locations per construction project for an approximate total of 18 locations. It should be emphasized however; that the Site 2 locations are extremely specific to the particular project and, in deed, have to be established project by project due to complexity and impacts. A minimum of three per project has been established to provide a minimal guaranteed representation. As mentioned in the Volpe document, a 50 ft measurement would be attempted at each of these locations whenever possible. However, it is not likely that this can be done at all locations due to obstructions or reflecting surfaces interfering. Environmental data would be collected at the same time as the acoustic data at these locations. The Site 2 locations would be approved for each project in a project specific workplan. It should be noted that at a location where the 50 ft measurement can be obtained, that location would consist of both Site 2 and Site 3 locations.
Site 3 designates the research grade sites. These are the locations that most closely resemble the "Ideal Conditions". These are also the sites where relationships between near field and far field correlations will be attempted and are the highest quality field measurement sites. At Site 3 locations, acoustical, meteorlogical, traffic, and pavement data will be collected.
Site 3 will include all way-side testing within 50 feet of the roadway. Data collected at Site 3 locations will be used to evaluate the general performance of the pavement acoustical properties, including the evaluation of the applied 4-dBA reduction.
Figure 4 SR 101 Residence Test Locations and Pre and Post Overlay Noise Levels
| Route | Section | Miles | Residential Density * | Existing Noise Walls | Hot Spots ** |
|---|---|---|---|---|---|
| 101 PM | Raintree - Mt. View | 3 | H | Y | N |
| 101AF | Union Hills - 31st Ave | 6.5 | H | Y | N |
| 101PM | 21st Ave - Tatum | 7 | H | Y | Y |
| 143 | Bellview - Van Buren | 1 | M | N | N |
| 101 PM | McDonald - McKellips | 5 | L | N | Y |
| 101 PR | 8th St. - US60 | 3 | H | Y | N |
| 202 RM | 20th St. - VanBuren | 4 | M | Y | N |
| 51 | Shea - Bell | 4 | H | Y | N |
| 101 PR | US60 - Chandler Blvd | 5.5 | M | Y | Y |
| 202 RM | Alma School - Mesa | 2.5 | M | Y | Y |
| 202 RM | Gilbert - Val Vista | 2.5 | M | Y | Y |
| 202 RM | Mesa Dr. - Gilbert | 2 | L | Y | Y |
| 101 PM | Tatum - Raintree | 8 | N | N | N |
| 101 PM | 90th St. - McDonald | 3 | N | N | N |
| 202 RM | Val Vista - Higley | 2 | N | N | N |
| 101 AF | McDowell - Thomas | 1 | M | N | N |
| 101 AF | Thomas - Campbell | 1.5 | N | N | N |
| 101 AF | Campbell - Northern | 3.5 | N | N | N |
| 101 AF | Northern - Olive | 1 | L | N | N |
| 101 AF | Olive - Grand | 2 | H | N | N |
| 101 AF | Grand - Thunderbird | 1.5 | L | N | N |
| 101 AF | Thunderbird - Union Hills | 3 | M | Y | N |
| I-10 | 67th - 51st | 2 | M | Y | N |
| I-10 | 51st - 27th Ave | 3 | M | Y | N |
| I-10 | 15th Ave - Van Buren | 4 | H | Y | N |
| I-10 | Baseline - Ray | 4 | M | Y | N |
| I-17 | Greenway - Utopia | 2.5 | M | N | N |
| 101 | 31st Ave - 21st Ave | 1 | N | N | N |
| 101 | McKellips - 8th St | 1.5 | N | N | N |
| 101 PM | Mt. View - 90th St | 0.7 | NA | NA | N |
| 202 RM | Van Buren - Alma School | 7.5 | N | N | N |
* H=High Density, M= Medium Density, L=Low Density, N= No Residential, N.A.= No Action
** Hot Spots - Areas where ADOT has measured noise levels that exceeded 64 dBA and qualify for additional mitigation under the ADOT Noise Abatement Policy.
The monitoring period will continue for the service life of the first overlay, whether that be 10 or 15 years. No additional monitoring is proposed for subsequent overlays. However, if the first overlay functionally fails, within six years or less, the department would monitor the replacement overlay for the period necessary to have provided a minimum of ten years of evaluation for that segment of roadway. That is, if the first overlay lasted six years, four additional years of monitoring would occur for the replacement overlay.
ADOT will submit an annual report that summarizes the data from all pilot projects to the FHWA Arizona Division Office.
ADOT will document public reactions on the noise benefits of ARFCs throughout the life of each pilot project. Comments will be collected by various methods, such as letters, e-mails, telephone calls (possibly a hotline), newspaper articles, surveys, or public meetings. ADOT will include the public comments in the annual report for each pilot project.
As additional knowledge and experience is gained regarding the use of ARFCs in Arizona, ADOT or FHWA may request changes to the Quiet Pavement Pilot Program. This may include changes in the areas of application or changes to the data acquisition plan or the termination of data acquisition or portions of the data acquisition for specific projects. Both ADOT and the FHWA Arizona Division Office must mutually agree upon requests for changes.
| Test Type | Test Method | Test Duration | Test Frequency | Test Location | Before Test | After Test | Site ** Type | Evaluat Period |
|---|---|---|---|---|---|---|---|---|
| Near Field | ||||||||
| Close Proximity | ISO 11819-2* | 7 second | Twice/Yr | MP | X | X | 1,2,3 | 5+L Yrs |
| Noise Intensity | Caltrans Meth | 7 second | Same as CPX | Same as CPX | X | X | 1,2,3 | " |
| Far Field (FF) | --See Note | 2 Five Hr | Twice/Yr | Selected Residences | X*** | X | 2 | 3+L |
| --See Note | 2 Five Hr | Twice/Yr | 50, 200, Distant | X*** | X | 3 | 5+L | |
| Volume | --See Note - | SA FF | Twice/Yr | Rep. FF Testing | X | 2, 3 | SA FF | |
| Speed | --See Note | SA FF | Twice/Yr | Rep. FF Testing | X | 2, 3 | SA FF | |
| Surface Characteristics | ||||||||
| Outflow Meter | NA | Annually | Selected Location | X | 3 | 5+L Yrs | ||
| CT Meter | ASTM E 2157 | NA | Annually | Selected Location | X | 3 | 5+L Yrs | |
| Dynamic Fric Test | ASTM E 1911 | NA | Annually | Selected Location | X | 3 | 5+L Yrs | |
| Runway Fric Test | ASTM E1859 | NA | Annually | MP | X | 1,3 | 5+L Yrs | |
| Inertial Profiler | ASTM E950 | NA | Annually | MP | X | 1,3 | 5+L Yrs | |
| Properties | ||||||||
| Complex Modulus | **** | NA | 3 Times | Site 3 Locations5 | X | X | 35 | 0,3,8 yrs |
| Impedance Tube | ASTM E1050 | NA | 3 Times | Site 3 Locations5 | X | X | 35 | 0,3,8 yrs |
| Air Flow | ASTM C522 | NA | 3 Times | Site 3 Locations5 | X | X | 35 | 0,3,8 yrs |
| Void Content | ASTM D3203 | NA | 3 Times | Site 3 Locations5 | X | X | 35 | 0,3,8 yrs |
| Asphalt Content | ASTM D2172 | NA | 3 Times | Site 3 Locations5 | X | X | 35 | 0,3,8 yrs |
| Gradation | ASTM C 136 | NA | 3 Times | Site 3 Locations5 | X | X | 35 | 0,3,8 yrs |
| Environmental | ||||||||
| Weather Station | SA FF | SA FF | X | X | 2,3 | SA FF | ||
|
** Site Type Number 1= Annual Test at Milepost in Travel Lane Lane of Each Roadway Direction *** Before Testing would be consists of Passby Testing Using Controlled Fleet (Three Vehicle Types) |
||||||||
Copies of Applicable Test Procedures to be Included Later

