Chapter 1. Literature Review (continued)
A two-part Web-based survey was formulated and posted on the Internet to capture the state-of-the-practice in the United States. A link to the survey was sent to 103 transportation officials, and their responses were stored in a specially designed database. Various sources were utilized in order to retrieve similar past experiences and facilitate the formulation of the survey, the database, and the subsequent Web-based program. The questions were as specific as possible in order to gain insight on current practices and also to avoid confusion in terms used and the actual information requested from the survey recipients.
The first part of the survey, "General Agency Information on Asset Management," contained questions on the following:
- Asset Management endorsement and implementation by the State DOTs.
- Existing or planned individual management systems.
- Existing levels of decisionmaking within State DOTs.
- Identification and rating of existing Asset Management decision processes and functions within State DOTs.
- Identification and rating of existing criteria used by the agencies for project selection.
The second part of the survey, "Roadway Asset Management," required more specialized and detailed input on current agency practices of data collection and project selection and contained questions on the following:
- Data management, collection methods, and integration.
- Rationale behind existing or future planned data collection.
- Evaluation of roadway asset data used for project selection.
- Identification of formally documented links between data collection and project selection or Asset Management decision processes in general.
The questions were prepared by using various formats, such as radio buttons, check-all-that-apply boxes, and short essay question fields. Some questions asked recipients to elaborate on their selections in essay fields or to provide supplementary information on answers of "other." Furthermore, a prompt and email link were included to encourage participants to send the survey team helpful documents.
The Web page of the survey was developed using Macromedia Dreamweaver MX 2004 and was uploaded to the server. Access to it could only be granted by entering a valid email address at the survey's home page. The email addresses of all the survey recipients and administrators were used as a security control, so that only invited participants could login. An email was then sent to provide the recipients with the survey's Web page address link and also to explain the purpose of the research and its anticipated importance. The survey was open to responses for 3 weeks. All responses were stored in a project-specific database. The database was created using the MySQL tool.
The contents of the survey were refined several times by the research team for suitability of the contents, wording of the questions, and suitability of the format used for the various questions. In complementary form, the research team also sent the survey to the Statistics and Survey Departments of Virginia Tech for review and comment, and the team made various changes based on their feedback.
Finally, as an ultimate quality control effort, the survey was sent to the American Association of State Highway and Transportation Officials (AASHTO) expert task group, who supervised the project, to receive comments on the content of the questions and to provide feedback on the usefulness of the survey and its anticipated importance. The feedback validated the structure and contents of the questions, and further refinements were completed.
Results
A total of 48 completed surveys from 40 States were received. Therefore, the response percentage was 78 percent in terms of individual States and 47 percent of individual respondents. The obtained responses were downloaded from the database and stored in Microsoft Excel spreadsheets.
Seven States received responses from more than one transportation official. Furthermore, whereas some questions were State-specific and required only one valid answer per responding State, others inquired about the personal opinions of the responding State transportation officials. Because of this difference, two approaches were followed for processing the responses from the States that provided more than one response:
- In the first case, the various answers within the same State were compared and discrepancies were resolved so that only one answer, as complete as possible, would be kept based on the following criteria:
- Priority was given to the most complete responses. For example, in a case in which one transportation official reported that the State agency possessed two individual management systems and another official reported the possession of these two and an additional system, the final response would contain all three individual management systems from the second response.
- Priority was given to the responses of transportation officials whose areas of expertise most closely coincided with that of the survey's questions and input fields (according to the above criteria, the State response ultimately considered consisted of excerpts from responses provided by different officials).
- In the remaining cases, in which the survey questions asked for individual opinions, all 48 answers were considered valid and were utilized in the analysis.
Answers to essay questions were not considered in the statistical analysis but were used as a guide for the resolution of discrepancies and also as a compass for the overall status of the responding State in relation to the researched topics. Information from the essay questions utilized to identify candidates for the second phase of the investigation.
Asset Management Implementation
The responses to the first question concerning the implementation stage of an Asset Management system revealed that most of the responding States (24) are still in the planning phase. Only one quarter (11) of the respondents indicated that they have already implemented an Asset Management system.
The responses also revealed that most of the responding States have been utilizing individual management systems, the most predominant among them being pavement (39), bridge (39), and maintenance (34) management systems. Other systems include safety (SMS), congestion (CMS), public transportation (PTMS), and intermodal transportation (ITMS) management.
However, for most of these States, the level of integration of these individual systems within an overall Asset Management framework is still in the planning phase. Pavement and bridge management systems seem to be one step ahead of the remaining systems in terms of integration.
Decision Levels and Processes
When asked to report on their defined decisionmaking levels, most of the responding transportation agencies indicated that they have explicitly defined levels that coincide with the ones found in the literature (figure 5). The main levels identified were programming, budgeting, and project selection. This confirms that the correct transportation officials were selected because they were familiar with these levels of decisionmaking. It also confirms that the agencies had focused their attention to these intermediate levels connecting the generic strategic decisions of the strategic level to the actual project implementation at the project level.
Further in the survey, the State transportation officials were asked to rank a list of identified Asset Management decision processes in terms of relative importance. As mentioned, all 48 responses for this question were considered in the analysis. Figure 6 summarizes the responses and shows that most of the listed decision processes fall in the "very important" and "somewhat important" categories.
Figure 5. Defined decisionmaking levels. 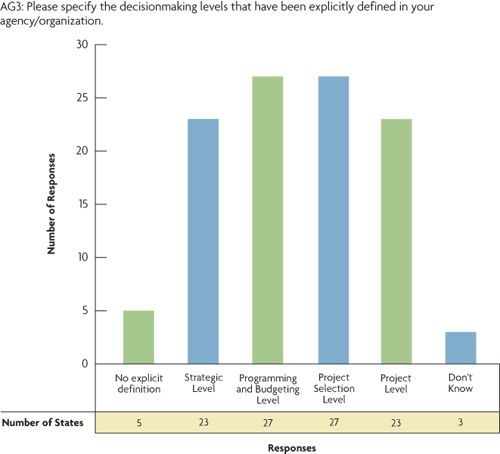 |
The relative importance of the decision processes was determined by computing the average importance rating for each decision process using a score from 1 (not very important at all) to 4 (very important). Table 5 shows that the most important decision process turned out to be performance evaluation and monitoring with fiscal planning following closely behind. Project selection, which is the main interest of this investigation, ranked third, along with resource allocations, which denotes the anticipated significance of this business decision process to the responding transportation officials.
Figure 7 summarizes the relative importance assigned by the State transportation officials to a list of specific project selection criteria. As expected, the variability of opinions is more significant in this question. However, the criterion of available budgets/earmarked funds stands out as the most important criterion, followed closely by engineering parameters and public demands/user opinions. Table 6 shows the average rankings for all the listed criteria.
Figure 6. Asset Management decision processes and their relative importance. 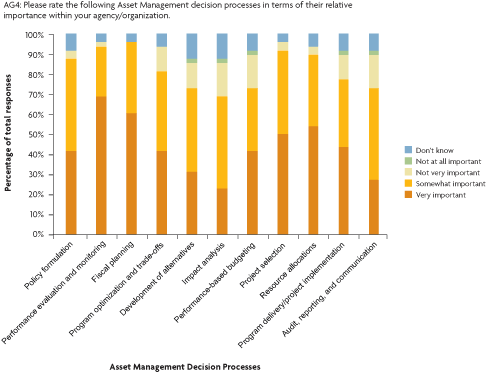 |
| Asset Management Decision Processes | Average Ranking |
|---|---|
| Performance evaluation and monitoring | 3.54 |
| Fiscal planning | 3.48 |
| Project selection | 3.33 |
| Resource allocations | 3.31 |
| Policy formulation | 3.13 |
| Program optimization and tradeoffs | 3.10 |
| Program delivery/project implementation | 3.02 |
| Performance-based budgeting | 2.96 |
| Audit, reporting, and communication | 2.81 |
| Development of alternatives | 2.77 |
| Impact analysis | 2.65 |
Figure 7. Project selection criteria and their relative importance. 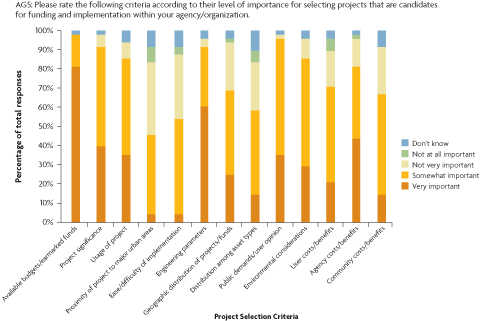 |
| Project Selection Criteria | Average Ranking |
|---|---|
| Available budgets/earmarked funds | 3.75 |
| Engineering parameters | 3.44 |
| Public demands/user opinion | 3.27 |
| Project significance | 3.27 |
| Agency costs/benefits | 3.19 |
| Usage of project | 3.08 |
| Environmental considerations | 3.06 |
| Geographic distribution of projects/funds | 2.83 |
| User costs/benefits | 2.77 |
| Community costs/benefits | 2.65 |
| Distribution among asset types | 2.46 |
| Ease/difficulty of implementation | 2.38 |
| Proximity of project to major urban areas | 2.25 |
| 1 = not at all important, 2 = not very important, 3 = somewhat important, 4 = very important | |
An interesting finding is that public demands/user opinions rank in third place, which shows the increased interest of transportation agencies in public satisfaction from the selection and implementation of projects. To the surprise of the research team, the vast majority (80 percent) of the responding officials agreed that the criteria used for project selection cannot or should not be uniform and consistent for all types of roadway assets.
Data Collection Procedures
Most of the responding State agencies (75 percent) had already invested time and money in developing Asset Management roadway inventories and databases. The majority of the remaining agencies reported that they were planning for it. Most agencies have also been collecting data predominantly for their pavements and bridges. Traffic items and roadside assets were also reported to have been collected to a great extent.
Figure 8 summarizes the data collection methods used for the acquisition of such data. Whereas for some assets (e.g., drainage) the collection was reported to have been performed by mostly manual methods, there is a trend toward using a combination of manual and automatic methods. This is consistent with what was reported recently by Flintsch et al. (2004).
Figure 8. Roadway asset data collection types and methods. 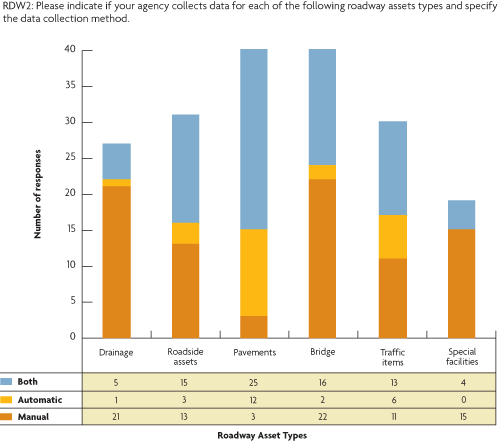 |
Data Collection Rationale
The officials were also asked to provide information about their rationale behind data collection. These results are summarized in figure 9. The responses confirmed that most agencies still base their data collection decisions on past practices and staff experience. However, many respondents also noted that data collection practices have been based on data collection standards and input needs of utilized management systems or other defined decision processes.
The next question asked officials to rate the importance of identified roadway asset data for the selection between two competitive projects. The ratings are summarized in figure 10 and table 7. As expected, the most important data are the assets' structural and functional conditions, with usage of the assets following in third place. The results conform to common sense and also show that the responding officials had predominantly the same perception of the data that would prioritize project selection between different assets.
Figure 9. Agency data collection rationale 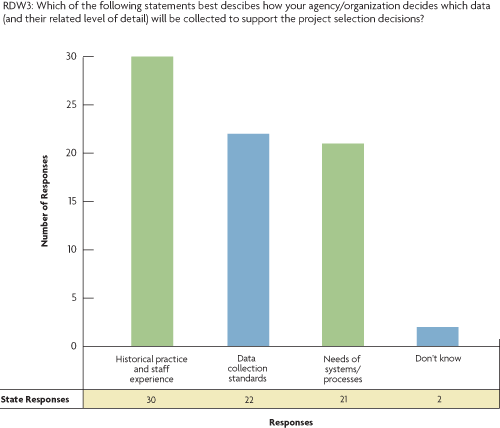 |
Finally, the last question of the survey investigated the level at which State transportation agencies are conscious about the existence of links between their data collection activities and project selection. From the responses, it was determined that most agencies have identified (32.5 percent) or identified and documented in a formal way (52.5 percent) the existence of such links. This is an important finding because it shows that most agencies have been trying to rationalize their data collection according to specific decisions to be supported, as least for the project selection level.
Figure 10. Roadway asset data types and their relative importance for project selection. 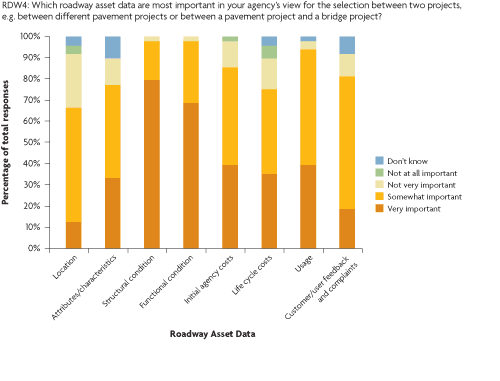 |
| Roadway Asset Data | Average Ranking |
|---|---|
| Structural condition | 3.77 |
| Functional condition | 3.67 |
| Usage | 3.29 |
| Initial agency costs | 3.23 |
| Life cycle costs | 2.96 |
| Attributes/characteristics | 2.90 |
| Customer/user feedback and complaints | 2.83 |
| Location | 2.67 |
Summary of Survey Findings
The most important findings from the literature review and Web survey are the following:
- Transportation Asset Management implementation in the United States and around the world is still in its initial steps. Most of the surveyed transportation agencies, however, are planning the integration of currently used individual management systems toward this end. The same is true for roadway inventories and databases.
- The most important criteria used for project selection are available budgets/earmarked funds, engineering parameters, and the public demands/user opinions.
- Asset Management practitioners in general agree that project selection criteria cannot or should not be uniform and consistent for all asset types considered.
- U.S. transportation agencies' data collection decisions are still predominantly based on past agency practices and personnel experience. There is, however, a significant trend toward use of data collection standards and input needs of management systems or processes behind the rationalization of data collection.
- Most U.S. transportation officials consider the roadway assets' structural and functional conditions as the most important that data they use to support project selection between competing roadway projects. The usage of the assets is the third most influential data item.
- Most of the U.S. transportation agencies seem to have formally identified and documented existing links between the data they collect and the project selection decisions they wish to support.


