

Appendix B: Transportation Asset Management Survey Analysis
Introduction
A total of 48 answers from 40 different States were received. Therefore, the response percentage resulted in 78 percent in terms of individual States and 47 percent in terms of individual respondents. The obtained responses were downloaded from the database and stored in Excel spreadsheets. The responses were statistically analyzed, and charts and tables were created. A discussion of the results follows hereafter.
Answers to essay questions were not considered in this statistical analysis, but rather used as a guide for the resolution of discrepancies and also as a compass for the overall status of the responding State in relation to the researched topics. Information from the essay questions can and will be utilized in the future for the determination of champions for the second phase of the investigation.
Part 1: General Agency Information on Asset Management, Decision Levels, and Decision Processes
This part required transportation officials to give information regarding the following:
- Asset Management endorsement and implementation by the State DOTs.
- Existing and future planned other transportation and infrastructure management systems.
- Existing levels of decisionmaking within State DOTs.
- Identification and rating of existing Asset Management decision processes and functions within State DOTs.
- Identification and rating of existing criteria used by the agencies for project selection.
Question 1: Has your agency/organization implemented, or plan to implement an Asset Management system?
The responses to the first question concerning the implementation stage of an Asset Management system revealed that most of the responding States (24) are still in the phase of planning. Only one quarter (11) of the respondents indicated that they have already implemented an Asset Management System. The responses are summarized in figure 1.
Figure 1. Asset Management implementation. 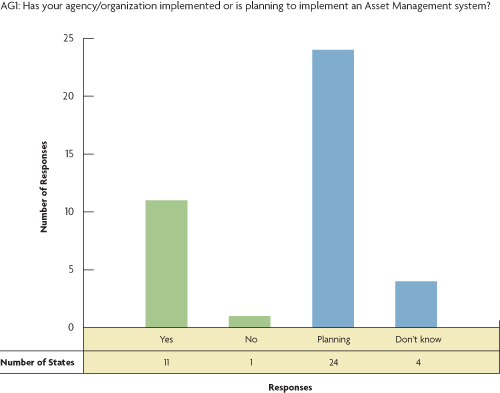 |
| PMS | BMS | SMS | CMS | PTMS | ITMS | MMS |
|---|---|---|---|---|---|---|
| 39 | 39 | 23 | 20 | 13 | 16 | 34 |
Question 2: Please indicate the management system(s) your agency/organization currently has, along with the status of each system within an overall Asset Management framework.
The responses to this question revealed that most of the responding States have been using individual management systems with the most predominant among them being pavement (39), bridge (39), and maintenance management systems (34) shown by the aggregated results in table 1. Other systems include highway safety (SMS), traffic congestion (CMS), public transportation (PTMS), and intermodal transportation management systems (ITMS).
However, for most of these States, the level of integration of individual systems within an overall Asset Management framework is still in the planning phase. Pavement and bridge management systems seem to be one step ahead of the remaining ones in terms of this integration. The attained responses are summarized in figure 2.
Figure 2. Use of individual management systems and integration within Asset Management. 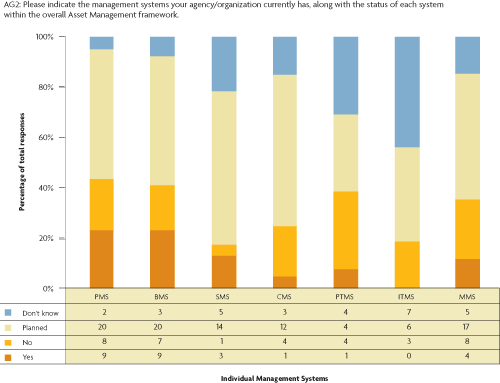 |
Question 3: Please specify the decisionmaking level(s) that are defined explicitly by your agency/organization.
When asked to report on their defined decisionmaking levels, most of the responding transportation agencies indicated that they have explicitly defined decisionmaking levels that coincide with the ones found in the literature (figure 3). Most of the answers were obtained for the programming and budgeting and the project selection levels. This confirms that the responding transportation officials were rightly selected because they were familiar with these levels of decisionmaking, and that the agencies have focused their attention to these intermediate levels of decisionmaking that connect the generic strategic decisions of the strategic level with the actual project implementation at the project level.
Figure 3. Defined levels of decisionmaking. 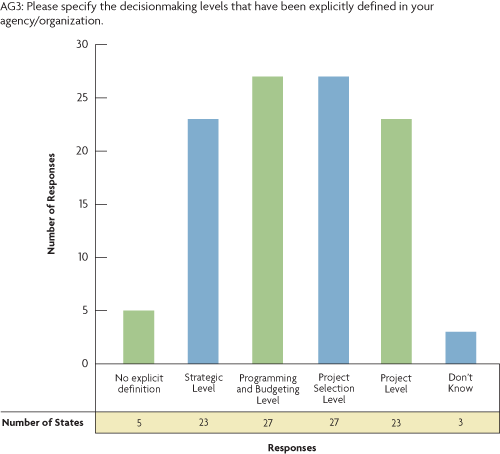 |
Question 4: Please rate the following Asset Management decision processes in terms of their relative importance within your agency/organization.
State transportation officials were asked to rate a list of identified Asset Management decision processes in terms of their relative importance. As mentioned before, all 48 responses for this question were considered in the analysis. Figure 4 summarizes the responses. This plot shows that most of the listed decision processes fall in the "very important" or "somewhat important" category.
Table 2 ranks the decision processes in terms of their normalized importance by importance category. The relative importance of the decision processes was determined by computing the average importance rating for each decision process using a score from 1 = not important at all to 4 = very important. Table 3 shows that the most important decision process turned out to be performance evaluation and monitoring with fiscal planning following closely behind. Project selection, which is the main interest of this study, ranked third along with resource allocations, which denotes the anticipated significance of the business decision process to the responding transportation officials.
| Ranking of normalized importance of Asset Management decision processes per importance category. | |||||||||
|---|---|---|---|---|---|---|---|---|---|
| Very important | Somewhat important | Not very important | Not at all important | Don't know | |||||
| 0.69 | Performance evaluation and monitoring | 0.46 | Policy formulation | 0.17 | Impact analysis | 0.02 | Development of alternatives | 0.13 | Development of alternatives |
| 0.60 | Fiscal planning | 0.46 | Impact analysis | 0.17 | Performance-based budgeting | 0.02 | Impact analysis | 0.13 | Impact analysis |
| 0.54 | Resource allocations | 0.46 | Audit, reporting and communication | 0.17 | Audit, reporting and communication | 0.02 | Performance-based budgeting | 0.08 | Policy formulation |
| 0.50 | Project selection | 0.42 | Development of alternatives | 0.13 | Program optimization and trade-offs | 0.02 | Program delivery / project implementation | 0.08 | Performance-based budgeting |
| 0.44 | Program delivery / project implementation | 0.42 | Project selection | 0.13 | Development of alternatives | 0.02 | Audit, reporting and communication | 0.08 | Program delivery / project implementation |
| 0.42 | Policy formulation | 0.40 | Program optimization and trade-offs | 0.13 | Program delivery / project implementation | 0.00 | Policy formulation | 0.08 | Audit, reporting and communication |
| 0.42 | Program optimization and trade-offs | 0.35 | Fiscal planning | 0.04 | Policy formulation | 0.00 | Performance evaluation and monitoring | 0.06 | Program optimization and trade-offs |
| 0.42 | Performance-based budgeting | 0.35 | Resource allocations | 0.04 | Project selection | 0.00 | Fiscal planning | 0.06 | Resource allocations |
| 0.31 | Development of alternatives | 0.33 | Program delivery / project implementation | 0.04 | Resource allocations | 0.00 | Program optimization and trade-offs | 0.04 | Performance evaluation and monitoring |
| 0.27 | Audit, reporting and communication | 0.31 | Performance-based budgeting | 0.02 | Performance evaluation and monitoring | 0.00 | Project selection | 0.04 | Fiscal planning |
| 0.23 | Impact analysis | 0.25 | Performance evaluation and monitoring | 0.00 | Fiscal planning | 0.00 | Resource allocations | 0.04 | Project selection |
Figure 4. Asset Management decision processes and their anticipated importance. 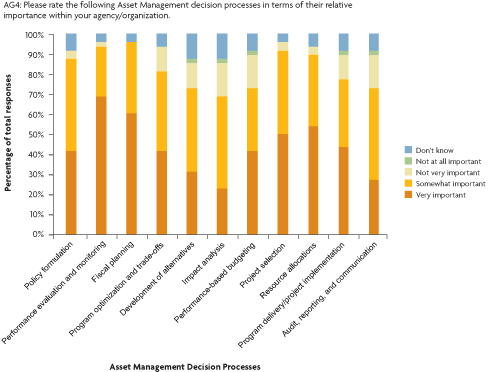 |
| Asset Management Decision Processes | Average Ranking |
|---|---|
| Performance evaluation and monitoring | 3.54 |
| Fiscal planning | 3.48 |
| Project selection | 3.33 |
| Resource allocations | 3.31 |
| Policy formulation | 3.13 |
| Program optimization and trade-offs | 3.10 |
| Program delivery/ project implementation | 3.02 |
| Performance-based budgeting | 2.96 |
| Audit, reporting and communication | 2.81 |
| Development of alternatives | 2.77 |
| Impact analysis | 2.65 |
| Key: 1 = not important at all, 2 = not very important, 3 = somewhat important, 4 = very important | |
Question 5: Please rate the following criteria according to their level of importance for selecting projects that are candidates for funding and implementation within your agency/organization.
In this question the transportation officials were asked to rate the importance of specific project selection criteria. Figure 5 summarizes the relative importance assigned by the State transportation officials to a list of the considered specific project selection criteria. As expected, the variability of opinions is more significant in this category than the others. However, the criterion of available budgets/earmarked funds stands out as the most important criterion, followed closely by engineering parameters and public demands/user opinions. The average rankings for all the listed criteria are presented in tables 4 and 5. An interesting finding is that public demands/user opinions rank in the third place, which shows the increased interest of transportation agencies in public satisfaction from the selection and implementation of projects.
Figure 5. Project selection criteria and their anticipated importance. 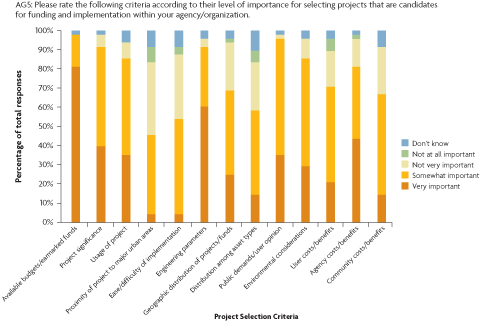 |
| Ranking of normalized importance of project selection criteria according per importance category. | |||||||||
|---|---|---|---|---|---|---|---|---|---|
| Very important | Somewhat important | Not very important | Not at all important | Don't know | |||||
| 0.81 | Available budgets / earmarked funds | 0.60 | Public demands / user opinion | 0.38 | Proximity of project to major urban areas | 0.08 | Proximity of project to major urban areas | 0.10 | Distribution among asset types |
| 0.60 | Engineering parameters | 0.56 | Environmental considerations | 0.33 | Ease / difficulty of implementation | 0.06 | Distribution among asset types | 0.08 | Proximity of project to major urban areas |
| 0.44 | Agency costs / benefits | 0.52 | Project significance | 0.25 | Geographic distribution projects / funds | 0.06 | User costs / benefits | 0.08 | Ease / difficulty of implementation |
| 0.40 | Project significance | 0.52 | Community costs / benefits | 0.25 | Distribution among asset types | 0.04 | Ease / difficulty of implementation | 0.08 | Community costs / benefits |
| 0.35 | Usage of project | 0.50 | Usage of project | 0.25 | Community costs / benefits | 0.02 | Geographic distribution projects / funds | 0.06 | Usage of project |
| 0.35 | Public demands / user opinion | 0.50 | Ease / difficulty of implementation | 0.19 | User costs / benefits | 0.02 | Agency costs / benefits | 0.04 | Engineering parameters |
| 0.29 | Environmental considerations | 0.50 | User costs / benefits | 0.15 | Agency costs / benefits | 0.00 | Available budgets / earmarked funds | 0.04 | Geographic distribution projects / funds |
| 0.25 | Geographic distribution projects / funds | 0.44 | Geographic distribution projects / funds | 0.10 | Environmental considerations | 0.00 | Project significance | 0.04 | Environmental considerations |
| 0.21 | User costs / benefits | 0.44 | Distribution among asset types | 0.08 | Usage of project | 0.00 | Usage of project | 0.04 | User costs / benefits |
| 0.15 | Distribution among asset types | 0.42 | Proximity of project to major urban areas | 0.06 | Project significance | 0.00 | Engineering parameters | 0.02 | Available budgets / earmarked funds |
| 0.15 | Community costs / benefits | 0.38 | Agency costs / benefits | 0.04 | Engineering parameters | 0.00 | Public demands / user opinion | 0.02 | Project significance |
| 0.04 | Proximity of project to major urban areas | 0.31 | Engineering parameters | 0.02 | Public demands / user opinion | 0.00 | Environmental considerations | 0.02 | Public demands / user opinion |
| 0.04 | Ease / difficulty of implementation | 0.17 | Available budgets / earmarked funds | 0.00 | Available budgets / earmarked funds | 0.00 | Community costs / benefits | 0.02 | Agency costs / benefits |
| Project Selection Criteria | Average Ranking |
|---|---|
| Available budgets/earmarked funds | 3.75 |
| Engineering parameters | 3.44 |
| Public demands/user opinion | 3.27 |
| Project significance | 3.27 |
| Agency costs/benefits | 3.19 |
| Usage of project | 3.08 |
| Environmental considerations | 3.06 |
| Geographic distribution of projects/funds | 2.83 |
| User costs/benefits | 2.77 |
| Community costs/benefits | 2.65 |
| Distribution among asset types | 2.46 |
| Ease/dificulty of implementation | 2.38 |
| Proximity of project to major urban areas | 2.25 |
| Key: 1 = not important at all, 2 = not very important, 3 = somewhat important, 4 = very important | |
Question 6: Do you think that the above criteria that are used by an agency in order to select between different projects or groups of projects are or should be uniform and consistent for all types of different roadway assets?
This question attempted to clarify whether the above-mentioned criteria for project selection would be suitable for use regardless of the asset type under consideration. To the surprise of the research team, the majority (80 percent) of the responding officials agreed that the criteria used for project selection cannot and should not be uniform and consistent for all types of roadway assets. The responses are summarized in figure 6.
Figure 6. Consistency of project selection criteria for different asset types. 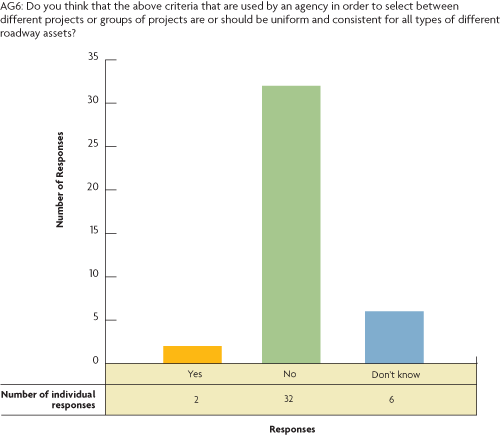 |
Questionnaire Part 2-Information Regarding Data Collection, Management, and Integration and Their Relation to the Project Selection Decision Level of Roadway Assets
This part required transportation officials to provide information on the following:
- Data management, collection methods, and integration.
- Rationale behind existing and future planned data collection.
- Evaluation of roadway asset data used for project selection.
- Identification of formally documented links between data collection and project selection or Asset Management decision processes in general.
Question 1: Does your agency/organization have an Asset Management roadway inventory/database, or is planning to develop one?
From this question it was clearly shown that most of the responding State agencies (75 percent) had already invested time and money in developing Asset Management roadway inventories and databases. The majority of the remaining responses indicated that they are in the planning stages. The responses are summarized in figure 7.
Figure 7. Existence of Asset Management inventory/database. 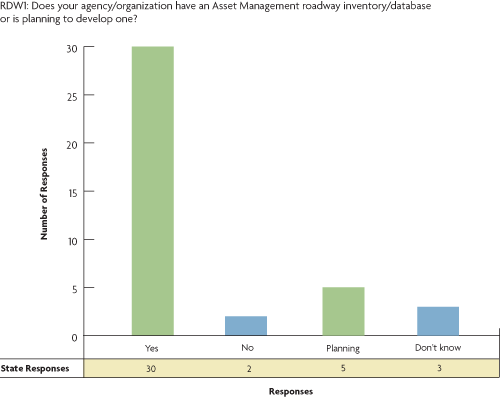 |
Question 2: Please indicate if your agency collects data for each of the following roadway asset types and specify the data collection method.
From this question it was revealed that most agencies have been collecting data predominantly for their pavements and bridges. To a great extent, traffic items and roadside assets also were reported to be collected. Figure 8 summarizes the data collection methods used for the acquisition of the above data. Whereas for some assets (e.g., drainage) the collection is reported to have been performed by mostly manual methods, there is a trend towards using a combination of manual and automatic methods.
Figure 8. Roadway asset type data collection and corresponding collection methods. 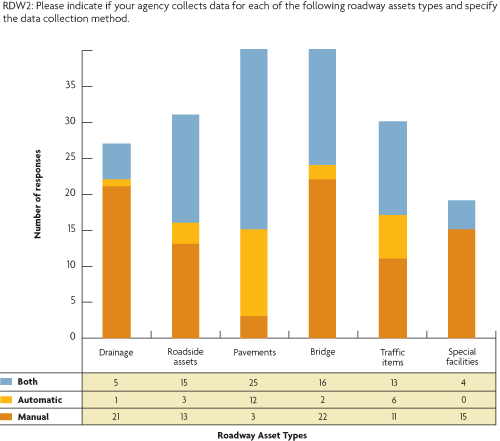 |
Question 3: Which of the following statements best describes how your agency/organization decides which data (and their related level of detail) will be collected to support the project selection decisions?
This question attempted to capture the agencies' culture and rationale behind data collection. These results are summarized in figure 9. The responses confirmed that most agencies still base their data collection decisions on past practices and staff experience. However, many respondents also indicated that data collection practices have been based on data collection standards and input needs of utilized management systems or other defined decision processes.
Figure 9. Agency data collection rationale. 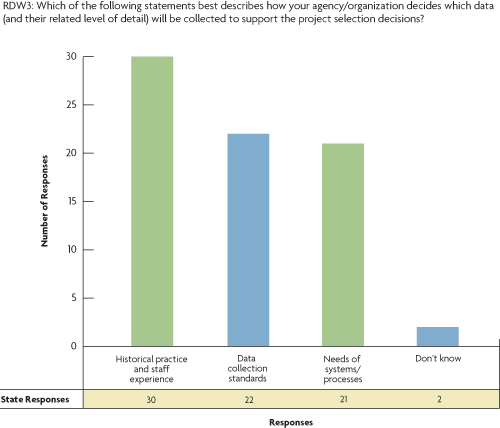 |
Question 4: Which roadway asset data are most important in your agency's view for the selection between two projects, e.g., between different pavement projects or between a pavement project and a bridge project?
State transportation officials were asked to rate the importance of identified roadway asset data for the selection between two competitive projects. The ratings are summarized figure 10 and tables 6 and 7. As expected, the most important data are the assets' structural and functional conditions, with usage of the assets following in the third place. The results conform to common sense and also show that the responding transportation officials had predominantly the same perception of the data that would prioritize project selection between different assets.
Figure 10. Roadway asset data and their anticipated importance for project selection. 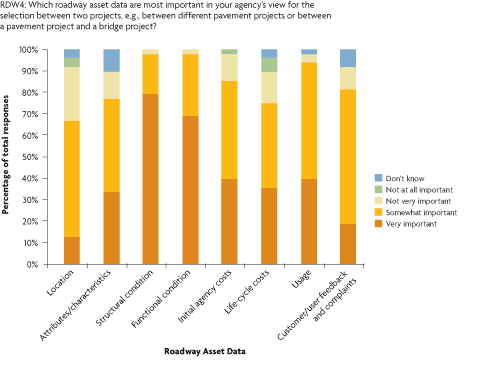 |
| Ranking of normalized importance of Asset Management decision processes per importance category. | |||||||||
|---|---|---|---|---|---|---|---|---|---|
| Very important | Somewhat important | Not very important | Not at all important | Don't know | |||||
| 0.79 | Structural condition | 0.63 | Customer/user feedback | 0.25 | Location | 0.06 | Life-cycle costs | 0.10 | Attributes / characteristics |
| 0.69 | Functional condition | 0.54 | Location | 0.15 | Life-cycle costs | 0.04 | Location | 0.08 | Customer/user feedback and complaints |
| 0.40 | Initial agency costs | 0.54 | Usage | 0.13 | Attributes / characteristics | 0.02 | Initial agency costs | 0.04 | Location |
| 0.40 | Usage | 0.46 | Initial agency costs | 0.13 | Initial agency costs | 0.00 | Attributes / characteristics | 0.04 | Life-cycle costs |
| 0.35 | Life-cycle costs | 0.44 | Attributes / characteristics | 0.10 | Customer/user feedback and complaints | 0.00 | Structural condition | 0.02 | Usage |
| 0.33 | Attributes / characteristics | 0.40 | Life-cycle costs | 0.04 | Usage | 0.00 | Functional condition | 0.00 | Structural condition |
| 0.19 | Customer/user feedback and complaints | 0.29 | Functional condition | 0.02 | Structural condition | 0.00 | Usage | 0.00 | Functional condition |
| 0.13 | Location | 0.19 | Structural condition | 0.02 | Functional condition | 0.00 | Customer/user feedback and complaints | 0.00 | Initial agency costs |
| Roadway Asset Data | Average Ranking |
|---|---|
| Structural condition | 3.77 |
| Functional condition | 3.67 |
| Usage | 3.29 |
| Initial agency costs | 3.23 |
| Life-cycle costs | 2.96 |
| Attributes/characteristics | 2.90 |
| Customer/user feedback and complaints | 2.83 |
| Location | 2.67 |
Question 5: Has your agency/organization identified and formally documented any relationship between the roadway data collected to support project selection and the decisions made?
The last question of the survey investigated the level at which State transportation agencies are conscious about the existence of links between their data collection activities and project selection. It was determined from the responses that most agencies have identified (32.5 percent) or identified and documented in a formal way (52.5 percent) the existence of such links. This is a very important finding because it shows that most agencies are trying to rationalize their data collection according to specific decisions to be supported at least for the particular level of project selection. The responses are summarized in figure 11.
Figure 11. Identification and documentation of links between data collection and project selection. 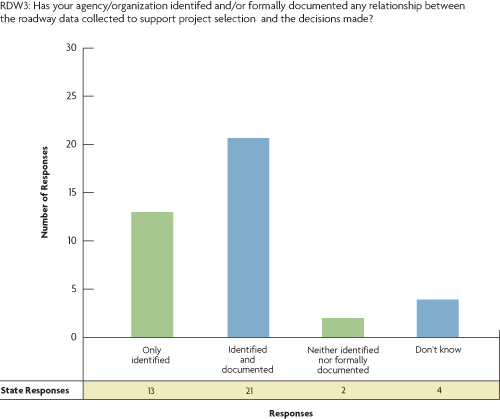 |