Comprehensive Design Example for Prestressed Concrete (PSC) Girder Superstructure Bridge
Design Step 4 Deck Slab Design
Design Step 4.1
In addition to designing the deck for dead and live loads at the strength limit state, the AASHTO-LRFD specifications require checking the deck for vehicular collision with the railing system at the extreme event limit state. The resistance factor at the extreme event limit state is taken as 1.0. This signifies that, at this level of loading, damage to the structural components is allowed and the goal is to prevent the collapse of any structural components.
The AASHTO-LRFD Specifications include two methods of deck design. The first method is called the approximate method of deck design (S4.6.2.1) and is typically referred to as the equivalent strip method. The second is called the Empirical Design Method (S9.7.2).
The equivalent strip method is based on the following:
A transverse strip of the deck is assumed to support the truck axle loads.
The strip is assumed to be supported on rigid supports at the center of the girders. The width of the strip for different load effects is determined using the equations in S4.6.2.1.
The truck axle loads are moved laterally to produce the moment envelopes. Multiple presence factors and the dynamic load allowance are included. The total moment is divided by the strip distribution width to determine the live load per unit width.
The loads transmitted to the bridge deck during vehicular collision with the railing system are determined.
Design factored moments are then determined using the appropriate load factors for different limit states.
The reinforcement is designed to resist the applied loads using conventional principles of reinforced concrete design.
Shear and fatigue of the reinforcement need not be investigated.
The Empirical Design Method is based on laboratory testing of deck slabs. This testing indicates that the loads on the deck are transmitted to the supporting components mainly through arching action in the deck, not through shears and moments as assumed by traditional design. Certain limitations on the geometry of the deck are listed in S9.7.2. Once these limitations are satisfied, the specifications give reinforcement ratios for both the longitudinal and transverse reinforcement for both layers of deck reinforcement. No other design calculations are required for the interior portions of the deck. The overhang region is then designed for vehicular collision with the railing system and for dead and live loads acting on the deck. The Empirical Design Method requires less reinforcement in the interior portions of the deck than the Approximate Method.
For this example, the Approximate Method (Strip Width Method) is used.
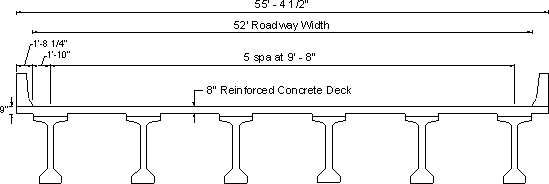
Figure 4-1 - Bridge Cross-Section
Required information:
| Girder spacing | = 9 ft.- 8 in |
| Top cover | = 2 ½ in. (S5.12.3) (includes ½ in. integral wearing surface) |
| Bottom cover | = 1 in. (S5.12.3) |
| Steel yield strength | = 4 ksi |
| Slab conc. compressive strength | = 4 ksi |
| Concrete density | = 150 pcf |
| Future wearing surface density | = 30 psf |
Design Step 4.2 - Deck Thickness
The specifications require that the minimum thickness of a concrete deck, excluding any provisions for grinding, grooving and sacrificial surface, should not be less than 7 in. (S9.7.1.1). Thinner decks are acceptable if approved by the bridge owner. For slabs with depths less than 1/20 of the design span, consideration should be given to prestressing in the direction of that span in order to control cracking.
Most jurisdictions require a minimum deck thickness of 8 in., including the ½ inch integral wearing surface.
In addition to the minimum deck thickness requirements of S9.7.1.1, some jurisdictions check the slab thickness using the provisions of S2.5.2.6.3. The provisions in this article are meant for slab-type bridges and their purpose is to limit deflections under live loads. Applying these provisions to the design of deck slabs rarely controls deck slab design.
For this example, a slab thickness of 8 in., including the ½ inch integral wearing surface, is assumed. The integral wearing surface is considered in the weight calculations. However, for resistance calculations, the integral wearing surface is assumed to not contribute to the section resistance, i.e., the section thickness for resistance calculations is assumed to be 7.5 in.
Design Step 4.3 - Overhang Thickness
For decks supporting concrete parapets, the minimum overhang thickness is 8 in. (S13.7.3.1.2), unless a lesser thickness is proven satisfactory through crash testing of the railing system. Using a deck overhang thickness of approximately ¾" to 1" thicker than the deck thickness has proven to be beneficial in past designs.
For this example, an overhang thickness of 9 in., including the ½ in. sacrificial layer is assumed in the design.
Design Step 4.4 Concrete Parapet
A Type-F concrete parapet is assumed. The dimensions of the parapet are shown in Figure 4-2. The railing crash resistance was determined using the provisions of SA13.3.1. The characteristics of the parapet and its crash resistance are summarized below.
Concrete Parapet General Values and Dimensions:
| Mass per unit length | = 650 lb/ft |
| Width at base | = 1 ft.- 8 ¼ in. |
| Moment capacity at the base calculated assuming the parapet acts as a vertical cantilever, Mc/length |
= 17.83 k-ft/ft |
| Parapet height, H | = 42 in. |
| Length of parapet failure mechanism, Lc | = 235.2 in. |
| Collision load capacity, Rw | = 137.22 k |
Notice that each jurisdiction typically uses a limited number of railings. The properties of each parapet may be calculated once and used for all deck slabs. For a complete railing design example, see Lecture 16 of the participant notebook of the National Highway Institute Course No. 13061.
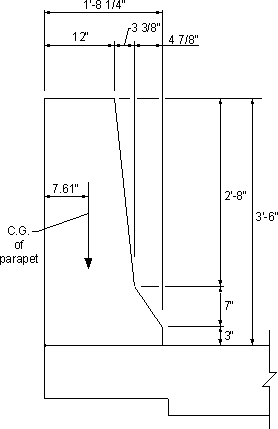
Figure 4-2 - Parapet Cross-Section
The load capacity of this parapet exceeds the minimum required by the Specifications. The deck overhang region is required to be designed to have a resistance larger than the actual resistance of the concrete parapet (SA13.4.2).
Design Step 4.5 Equivalent Strip Method (S4.6.2)
Moments are calculated for a deck transverse strip assuming rigid supports at web centerlines. The reinforcement is the same in all deck bays. The overhang is designed for cases of DL + LL at the strength limit state and for collision with the railing system at the extreme event limit state.
Design Step 4.5.1 - Design dead load moments:
Load factors (S3.4.1):
Slab and parapet:Minimum = 0.9Future wearing surface:
Maximum = 1.25
Minimum = 0.65
Maximum = 1.5
It is not intended to maximize the load effects by applying the maximum load factors to some bays of the deck and the minimum load factors to others. Therefore, for deck slabs the maximum load factor controls the design and the minimum load factor may be ignored.
Dead loads represent a small fraction of the deck loads. Using a simplified approach to determine the deck dead load effects will result in a negligible difference in the total (DL + LL) load effects. Traditionally, dead load positive and negative moments in the deck, except for the overhang, for a unit width strip of the deck are calculated using the following approach:
M = wl2/cwhere:
M = dead load positive or negative moment in the deck for a unit width strip (k-ft/ft)
w = dead load per unit area of the deck (ksf)
l = girder spacing (ft.)
c = constant, typically taken as 10 or 12
For this example, the dead load moments due to the self weight and future wearing surface are calculated assuming c = 10.
Self weight of the deck = 8(150)/12 = 100 psf
Unfactored self weight positive or negative moment = (100/1000)(9.66)2/10 = 0.93 k-ft/ft
Future wearing surface = 30 psf
Unfactored FWS positive or negative moment = (30/1000)(9.66)2/10 = 0.28 k-ft/ft
Design Step 4.6 - Distance from the center of the girder to the design section for negative moment
For precast I-shaped and T-shaped concrete beams, the distance from the centerline of girder to the design section for negative moment in the deck should be taken equal to one-third of the flange width from the centerline of the support (S4.6.2.1.6), but not to exceed 15 in.
Girder top flange width = 42 in.
One-third of the girder top flange width = 14 in. < 15 in. OK
Design Step 4.7 - Determining Live Load Effects
Using the approximate method of deck analysis (S4.6.2), live load effects may be determined by modeling the deck as a beam supported on the girders. One or more axles may be placed side by side on the deck (representing axles from trucks in different traffic lanes) and move them transversely across the deck to maximize the moments (S4.6.2.1.6). To determine the live load moment per unit width of the bridge, the calculated total live load moment is divided by a strip width determined using the appropriate equation from Table S4.6.2.1.3-1. The following conditions have to be satisfied when determining live load effects on the deck:
Minimum distance from center of wheel to the inside face of parapet = 1 ft. (S3.6.1.3)
Minimum distance between the wheels of two adjacent trucks = 4 ft.
Dynamic load allowance = 33% (S3.6.2.1)
Load factor (Strength I) = 1.75 (S3.4.1)
Multiple presence factor (S3.6.1.1.2):
Single lane = 1.20
Two lanes = 1.00
Three lanes = 0.85
(Note: the "three lanes" situation never controls for girder spacings up to 16 ft.)
Trucks were moved laterally to determine extreme moments (S4.6.2.1.6)
Fatigue need not be investigated for concrete slabs in multi-girder bridges (S9.5.3 and S5.5.3.1)
| Resistance factors, φ, for moment: | 0.9 for strength limit state (S5.5.4.2) 1.0 for extreme event limit state (S1.3.2.1) |
In lieu of this procedure, the specifications allow the live load moment per unit width of the deck to be determined using Table SA4.1-1. This table lists the positive and negative moment per unit width of decks with various girder spacings and with various distances from the design section to the centerline of the girders for negative moment. This table is based on the analysis procedure outlined above and will be used for this example.
Table SA4.1-1 does not include the girder spacing of 9'-8". It does include girder spacings of 9'-6" and 9'-9". Interpolation between the two girder spacings is allowed. However, due to the small difference between the values, the moments corresponding to the girder spacing of 9'-9" are used which gives slightly more conservative answers than interpolating. Furthermore, the table lists results for the design section for negative moment at 12 in. and 18 in. from the center of the girder. For this example, the distance from the design section for negative moment to the centerline of the girders is 14 in. Interpolation for the values listed for 12 in. and 18 in. is allowed. However, the value corresponding to the 12 in. distance may be used without interpolation resulting in a more conservative value. The latter approach is used for this example.
Design Step 4.8 - Design for positive moment in the deck
The reinforcement determined in this section is based on the maximum positive moment in the deck. For interior bays of the deck, the maximum positive moment typically takes place at approximately the center of each bay. For the first deck bay, the bay adjacent to the overhang, the location of the maximum design positive moment varies depending on the overhang length and the value and distribution of the dead load. The same reinforcement is typically used for all deck bays.
Factored loads
Live load
From Table SA4.1-1, for the girder spacing of 9'-9" (conservative):
Unfactored live load positive moment per unit width = 6.74 k-ft/ftMaximum factored positive moment per unit width = 1.75(6.74) = 11.80 k-ft/ft
This moment is applicable to all positive moment regions in all bays of the deck (S4.6.2.1.1).
Deck weight
1.25(0.93) = 1.16 k-ft/ft
Future wearing surface
1.5(0.28) = 0.42 k-ft/ft
Dead load + live load design factored positive moment (Strength I limit state)
MDL+LL = 11.8 + 1.16 + 0.42 = 13.38 k-ft/ft
Notice that the total moment is dominated by the live load.
Resistance factor for flexure at the strength limit state, φ = 0.90 (S5.5.4.2.1)
The flexural resistance equations in the AASHTO-LRFD Bridge Design Specifications are applicable to reinforced concrete and prestressed concrete sections. Depending on the provided reinforcement, the terms related to prestressing, tension reinforcing steel and/or compression reinforcing steel, are set to zero. The following text is further explanation on applying these provisions to reinforced concrete sections and the possible simplifications to the equations for this case.
For rectangular section behavior, the depth of the section in compression, c, is determined using Eq. S5.7.3.1.1-4:
where:
| Aps | = area of prestressing steel (in2) |
| fpu | = specified tensile strength of prestressing steel (ksi) |
| fpy | = yield strength of prestressing steel (ksi) |
| As | = area of mild steel tension reinforcement (in2) |
| A′s | = area of compression reinforcement (in2) |
| fy | = yield strength of tension reinforcement (ksi) |
| f′y | = yield strength of compression reinforcement (ksi) |
| b | = width of rectangular section (in.) |
| dp | = distance from the extreme compression fiber to the centroid of the prestressing tendons (in.) |
| c | = distance between the neutral axis and the compressive face (in.) |
| β1 | = stress block factor specified in S5.7.2.2 |
For reinforced concrete sections (no prestressing) without reinforcement on the compression side of the section, the above equation is reduced to:
The depth of the compression block, a, may be calculates as:
a = cβ1
These equations for "a" and "c" are identical to those traditionally used in reinforced concrete design. Many text books use the following equation to determine the reinforcement ratio, ρ and area of reinforcement, As:
k' = Mu/(φbd2)
As = ρde
A different method to determine the required area of steel is based on using the above equation for "a" and "c" with the Eq. S5.7.3.2.2-1 as shown below. The nominal flexural resistance, Mn, may be taken as:
Mn = Apsfps(dp - a/2) + Asfy(ds - a/2) - A′sf′y(d′s - a/2) + 0.85f′c(b - bw)β1hf(a/2 - hf/2) (S5.7.3.2.2-1)
where:
| fps | = average stress in prestressing steel at nominal bending resistance specified in Eq. S5.7.3.1.1-1 (ksi) |
| ds | = distance from extreme compression fiber to the centroid of nonprestressed tensile reinforcement (in.) |
| d's | = distance from extreme compression fiber to the centroid of compression reinforcement (in.) |
| b | = width of the compression face of the member (in.) |
| bw | = web width or diameter of a circular section (in.) |
| hf | = compression flange depth of an I or T member (in.) |
For rectangular reinforced concrete sections (no prestressing) without reinforcement on the compression side of the section, the above equation is reduced to:
From the equations for "c" and "a" above, substituting for:
| in the equation for Mn above yields: |
Only As is unknown in this equation. By substituting for b = 12 in., the required area of reinforcement per unit width can be determined by solving the equation.
Both methods outlined above yield the same answer. The first method is used throughout the following calculations.
For the positive moment section:
| de | = effective depth from the compression fiber to the centroid of the tensile force in the tensile reinforcement (in.) = total thickness - bottom cover - ½ bar diameter - integral wearing surface = 8 - 1 - ½ (0.625) - 0.5 = 6.19 in. |
| k′ | = Mu/(φbd2) = 13.38/[0.9(1.0)(6.19)2] = 0.388 k/in2 |
= 0.00688 |
|
Therefore,
Required As = ρde = 0.00688(6.19) = 0.0426 in2/in.
Required #5 bar spacing with bar area 0.31 in2 = 0.31/0.0426 = 7.28 in.
Use #5 bars at 7 in. spacing
Check maximum and minimum reinforcement
Based on past experience, maximum and minimum reinforcement requirements never control the deck slab design. The minimum reinforcement requirements are presented in S5.7.3.3.2. These provisions are identical to those of the AASHTO Standard Specifications. These provisions are illustrated later in this example.
Maximum reinforcement requirements are presented in S5.7.3.3.1. These requirements are different from those of the AASHTO Standard Specifications. Reinforced concrete sections are considered under-reinforced when c/de ≤ 0.42. Even though these requirements are not expected to control the design, they are illustrated below to familiarize the user with their application.
Check depth of compression block:
| T | = tensile force in the tensile reinforcement (k) = 0.31(60) = 18.6 k |
| a | = 18.6/[0.85(4)(7)] = 0.78 in. |
| β1 | = ratio of the depth of the equivalent uniformly stressed compression zone assumed in the strength limit state to the depth of the actual compression zone = 0.85 for f′c = 4 ksi (S5.7.2.2) |
| c | = 0.78/0.85 = 0.918 in. |
Check if the section is over-reinforced
| c/de | = 0.918/6.19 = 0.15 < 0.42 OK (S5.7.3.3.1) |
Check for cracking under Service I Limit State (S5.7.3.4)
Allowable reinforcement service load stress for crack control using Eq. S5.7.3.4-1:
fsa = Z/(dcA)1/3 ≤ 0.6fy = 36 ksi
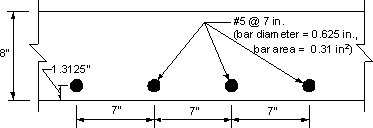
Figure 4-3 - Bottom Transverse Reinforcement
where:
| dc | = thickness of concrete cover measured from extreme tension fiber to center of bar located closest thereto (in.) = 1.3125 in. < (2 + ½ bar diameter) in. OK |
| A | = area of concrete having the same centroid as the principal tensile reinforcement and bounded by the surfaces of the cross-section and a straight line parallel to the neutral axis, divided by the number of bars (in2) = 2(1.3125)(7) = 18.375 in2 |
| Z | = crack control parameter (k/in) = 130 k/in. for severe exposure conditions |
By substituting for dc, A and Z:
fsa = 45 ksi > 36 ksi therefore, use maximum allowable fsa = 36 ksi
Notice that the crack width parameter, Z, for severe exposure conditions was used to account for the remote possibility of the bottom reinforcement being exposed to deicing salts leaching through the deck. Many jurisdictions use Z for moderate exposure conditions when designing the deck bottom reinforcement except for decks in marine environments. The rationale for doing so is that the bottom reinforcement is not directly exposed to salt application. The difference in interpretation rarely affects the design because the maximum allowable stress for the bottom reinforcement, with a 1 in. clear concrete cover, is typically controlled by the 0.6fy limit and will not change if moderate exposure was assumed.
Stresses under service loads (S5.7.1)
In calculating the transformed compression steel area, the Specifications require the use of two different values for the modular ratio when calculating the service load stresses caused by dead and live loads, 2n and n, respectively. For deck design, it is customary to ignore the compression steel in the calculation of service load stresses and, therefore, this provision is not applicable. For tension steel, the transformed area is calculated using the modular ratio, n.
Modular ratio for 4 ksi concrete, n = 8
Assume stresses and strains vary linearly
Dead load service load moment = 0.93 + 0.28 = 1.21 k-ft/ft
Live load service load moment = 6.74 k-ft/ft
Dead load + live load service load positive moment = 7.95 k-ft/ft
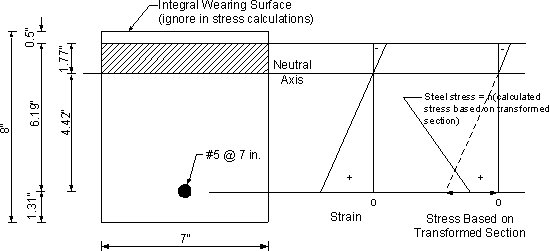
Figure 4-4 - Crack Control for Positive Moment Reinforcement Under Live Loads
The transformed moment of inertia is calculated assuming elastic behavior, i.e. linear stress and strain distribution. In this case, the first moment of area of the transformed steel on the tension side about the neutral axis is assumed equal to that of the concrete in compression. The process of calculating the transformed moment of inertia is illustrated in Figure 4-4 and by the calculations below.
For 4 ksi concrete, the modular ratio, n = 8 (S6.10.3.1.1b or by dividing the modulus of elasticity of the steel by that of the concrete and rounding up as required by S5.7.1)
Assume the neutral axis is at a distance "y" from the compression face of the section
Assume the section width equals the reinforcement spacing = 7 in.
The transformed steel area = (steel area)(modular ratio) = 0.31(8) = 2.48 in2
By equating the first moment of area of the transformed steel to that of the concrete, both about the neutral axis:
2.48(6.19 - y) = 7y(y/2)
Solving the equation results in y = 1.77 in.
| Itransformed | = 2.48(6.19 - 1.77)2 + 7(1.77)3/3 = 61.4 in4 |
Stress in the steel, fs = (Mc/I)n, where M is the moment acting on 7 in. width of the deck.
| fs | = [[(7.95(12/12)(7)(4.42)]/61.4]8 = 32.05 ksi |
Allowable service load stress = 36 ksi > 32.05 ksi OK
Design Step 4.9 - Design for negative moment at interior girders
a. Live load
From Table SA4.1-1, for girder spacing of 9'-9" and the distance from the design section for negative moment to the centerline of the girder equal to 12 in. (see Design Step 4.7 for explanation):
Unfactored live load negative moment per unit width of the deck = 4.21 k-ft/ft
Maximum factored negative moment per unit width at the design section for negative moment = 1.75(4.21) = 7.37 k-ft/ft
b. Dead load
Factored dead load moments at the design section for negative moment:
Dead weight
1.25(0.93) = 1.16 k-ft/ft
Future wearing surface
1.5(0.28) = 0.42 k-ft/ft
| Dead Load + live load design factored negative moment | = 1.16 + 0.42 + 7.37 = 8.95 k-ft/ft |
| d | = distance from compression face to centroid of tension reinforcement (in.) = total thickness - top cover - ½ bar diameter |
Assume #5 bars; bar diameter = 0.625 in., bar area = 0.31 in2
| d | = 8 - 2 ½ - ½ (0.625) = 5.19 in. |
Required area of steel = 0.0339 in2/in.
Required spacing = 0.31/0.0339 = 9.15 in.
Use #5 at 9 in. spacing
As indicated earlier, checking the minimum and maximum reinforcement is not expected to control in deck slabs.
Check for cracking under service limit state (S5.7.3.4)
Allowable service load stresses:
fsa = Z/(dcA)1/3 ≤ 0.6fy = 36 ksi
Concrete cover = 2 ½ in. - ½ in. integral wearing surface = 2 in.
(Note: maximum clear cover to be used in the analysis = 2 in.) (S5.7.3.4)
where:
| dc | = clear cover + ½ bar diameter = 2 + ½ (0.625) = 2.31 in. |
| A | = 2(2.31)(9) = 41.58 in2 |
| Z | = 130 k/in. for severe exposure conditions |
fsa = 28.38 ksi
As explained earlier, service load stresses are calculated using a modular ratio, n = 8.
Dead load service load moment at the design section for negative moment near the middle = -1.21 k-ft/ft.
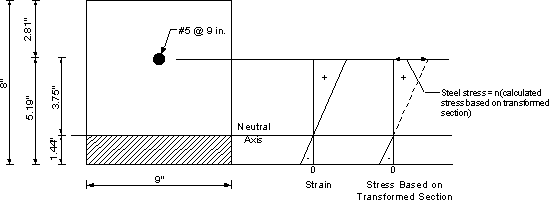
Figure 4-5a - Crack Control for Negative Moment Reinforcement Under Live Loads
Live load service load moment at the design section in the first interior bay near the first interior girder = -4.21 k-ft/ft.
Transformed section properties may be calculated as done for the positive moment section in Design Step 4.8. Refer to Figure 4-5a for the section dimensions and location of the neutral axis. The calculations are shown below.
Maximum dead load + live load service load moment = 5.42 k-ft/ft
n = 8
Itransformed = 43.83 in4
| Total DL + LL service load stresses | = [[5.42(9)(3.75)]/43.83](8) = 33.39 ksi > fsa = 28.38 ksi NG |
To satisfy the crack control provisions, the most economical change is to replace the reinforcement bars by smaller bars at smaller spacing (area of reinforcement per unit width is the same). However, in this particular example, the #5 bar size cannot be reduced as this bar is customarily considered the minimum bar size for deck main reinforcement. Therefore, the bar diameter is kept the same and the spacing is reduced.
Assume reinforcement is #5 at 8 in. spacing (refer to Figure 4-5b).
Itransformed = 42.77 in4
| Total DL + LL service load stresses | = [[5.42(8)(3.68)/42.77](8) = 29.85 ksi |
fsa = 29.52 ksi
Applied stress = 29.85 ksi ≈ fsa = 29.52 ksi
Use main negative moment reinforcement #5 at 8 in. spacing
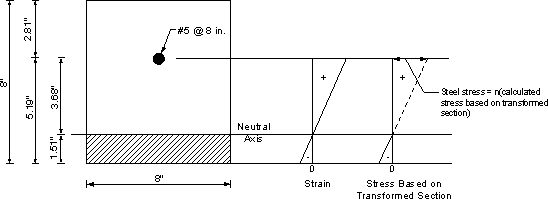
Figure 4-5b - Crack Control for Negative Moment Reinforcement Under Live Loads
Design Step 4.10 - Design of the overhang
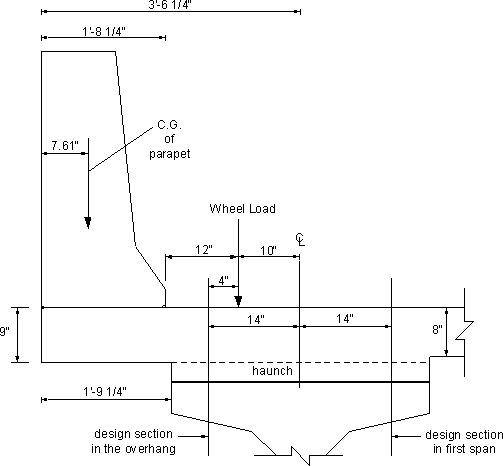
Figure 4-6 - Overhang Region, Dimensions and Truck Loading
Assume that the bottom of the deck in the overhang region is 1 inch lower than the bottom of other bays as shown in Figure 4-6. This results in a total overhang thickness equal to 9 in. This is usually beneficial in resisting the effects of vehicular collision. However, a section in the first bay of the deck, where the thickness is smaller than that of the overhang, must also be checked.
Assumed loads
Self weight of the slab in the overhang area = 112.5 lb/ft2 of the deck overhang surface area
Weight of parapet = 650 lb/ft of length of parapet
Future wearing surface = 30 lb/ft2 of deck surface area
As required by SA13.4.1, there are three design cases to be checked when designing the deck overhang regions.
Design Case 1: Check overhang for horizontal vehicular collision load (SA13.4.1, Case 1)
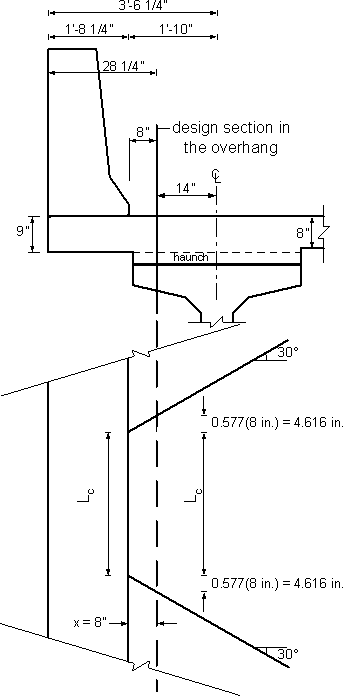
Figure 4-7 - Design Sections in the Overhang Region
The overhang is designed to resist an axial tension force from vehicular collision acting simultaneously with the collision + dead load moment.
The resistance factor, φ = 1.0 for extreme event limit state (S1.3.2.1). The Specification requires that load effects in the extreme event limit state be multiplied by ηi ≥ 1.05 for bridges deemed important or ηi ≥ 0.95 for bridges deemed not important. For this example, a value of ηi = 1.0 was used.
a. At inside face of parapet (Section A-A in Figure 4-7)
(see Design Step 4.4 for parapet characteristics)
| Mc | = moment capacity of the base of the parapet given as 17.83 k-ft/ft. For a complete railing design example that includes sample detailed calculations of railing parameters, see Lecture 16 of the participant notebook of the National Highway Institute Course No. 13061. |
| MDL, slab | = 0.1125(20.25/12)2/2 = 0.16 k-ft/ft |
| MDL, parapet | = 0.65(20.25 - 7.61)/12 = 0.68 k-ft/ft |
Design factored moment = -17.83 - 1.25(0.16 + 0.68) = -18.88 k-ft/ft
| Design axial tensile force (SA13.4.2) | = RW/(Lc + 2H) = 137.22/[(235.2 + 2(42)/12] = 5.16 k/ft |
h slab = 9 in.
Assuming #5 reinforcement bars,
| d | = overhang slab thickness - top cover - ½ bar diameter = 9 - 2 ½ - ½(0.625) = 6.19 in. |
Assume required area of steel = 0.70 in2/ft (1)
The over-reinforced section check is not expected to control. However, due to the additional reinforcement in the overhang, it is prudent to perform this check using the provisions of S5.7.3.3.1.
Effective depth of the section, h = 6.19 in.
(Notice that the overhang has 1 inch additional thickness at its bottom)
For a section under moment and axial tension, P, the nominal resistance, Mn, may be calculated as:
Mn = T(d - a/2) - P(h/2 - a/2)
Tension in reinforcement, T = 0.70(60) = 42.0 k/ft
Compression in concrete, C = 42.0 - 5.16 = 36.84 k/ft
| a | = C/bβ1f′c = 36.84/[12(0.85)(4)] = 0.90 in. |
| Mn | = 42.0[6.19 - (0.9/2)] - 5.16[(6.19/2) - (0.9/2)] = 227.43/12 = 18.95 k-ft/ft |
Notice that many designers determine the required reinforcement for sections under moment and axial tension, P, as the sum of two components:
the reinforcement required assuming the section is subjected to moment
P/fy
This approach is acceptable as it results in more conservative results, i.e., more reinforcement.
Resistance factor = 1.0 for extreme event limit state (S1.3.2.1)
| Mr | = φMn = 1.0(18.95) = 18.95 k-ft/ft > Mu = 18.88 k-ft/ft OK |
| c/de | = (0.9/0.85)/(6.19) = 0.17 < 0.42 steel yields before concrete crushing, i.e., the section is not over-reinforced |
b. At design section in the overhang (Section B-B in Figure 4-7)
Assume that the minimum haunch thickness is at least equal to the difference between the thickness of the interior regions of the slab and the overhang thickness, i.e., 1 in. This means that when designing the section in the overhang at 14 in. from the center of the girder, the total thickness of the slab at this point can be assumed to be 9 in. For thinner haunches, engineering judgment should be exercised to determine the thickness to be considered at this section.
At the inside face of the parapet, the collision forces are distributed over a distance Lc for the moment and Lc + 2H for axial force. It is reasonable to assume that the distribution length will increase as the distance from the section to the parapet increases. The value of the distribution angle is not specified in the specifications and is determined using engineering judgment. In this example, the distribution length was increased at a 30° angle from the base of the parapet (see Figure 4-8). Some designers assume a distribution angle of 45°, this angle would have also been acceptable.

Figure 4-8 - Assumed Distribution of Collision Moment Load in the Overhang
| Collision moment at the design section | = McLc/[Lc + 2(0.577)X] = -17.83(235.2)/[235.2 + 2(0.577)(8)] = -17.16 k-ft/ft |
Dead load moment at the design section:
| MDL, slab | = 0.1125(28.25/12)2/2 = 0.31 k-ft/ft |
| MDL, parapet | = 0.65(28.25 - 7.61)/12 = 1.12 k-ft/ft |
| MDL, FWS | = 0.03(8/12)2/2 = 0.007 k-ft/ft |
Factored design M = -17.16 - 1.25(0.31 + 1.12) - 1.5(0.007) = -18.96 k-ft/ft
| Design tensile force | = Rw/[Lc + 2H + 2(0.577)X] = 137.22/[[235.2 + 2(42) + 2(0.577)(8)]/12] = 5.01 k/ft |
h slab = 9 in.
By inspection, for Section A-A, providing an area of steel = 0.70 in2/ft resulted in a moment resistance of 18.95 k-ft/ft ≈ the design moment for Section B-B.
Therefore, the required area of steel for Section B-B = 0.70 in2/ft (2)
c. Check dead load + collision moments at design section in first span (Section C-C in Figure 4-7)
The total collision moment can be treated as an applied moment at the end of a continuous strip. The ratio of the moment M2/M1 (see Figure 4-9) can be calculated for the transverse design strip. As an approximation, the ratio M2/M1 may be taken equal to 0.4. This approximation is based on the fact that M2/M1 = 0.5 if the rotation at the first interior girder is restrained. Since this rotation is not restrained, the value of M2 will be less than 0.5M1. Thus, the assumption that M2/M1 = 0.4 seems to be reasonable. The collision moment per unit width at the section under consideration can then be determined by dividing the total collision moment by the distribution length. The distribution length may be determined using the 30° distribution as illustrated in Figure 4-8 except that the distance "X" will be 36 in. for Section C.
The dead load moments at the design section for negative moment to the inside of the exterior girder may be determined by superimposing two components: (1) the moments in the first deck span due to the dead loads acting on the overhang (see Figure 4-10), and (2) the effect of the dead loads acting on the first span of the deck (see Figure 4-11).

Figure 4-9 - Assumed Distribution of the Collision Moment Across the Width of the Deck
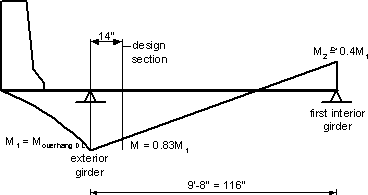
Figure 4-10 - Dead Load Moment at Design Section Due to Dead Loads on the Overhang
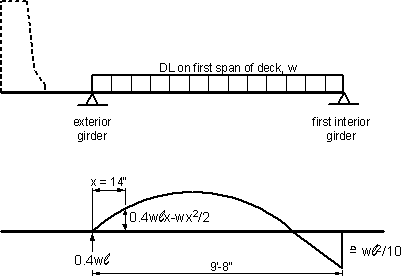
Figure 4-11 - Dead Load Moment at Design Section Due to Dead Loads on the First Deck Span
Collision moment at exterior girder, M1 = -17.83 k-ft/ft
Collision moment at first interior girder, M2 = 0.4(17.83) = 7.13 k-ft/ft
By interpolation for a section in the first interior bay at 14 in. from the exterior girder:
Total collision moment = -17.83 + 14(17.83 + 7.13)/116 = -14.81 k-ft/ft
Using the 30° angle distribution, as shown in Figure 4-8:
Design collision moment = -14.81Lc/[Lc + 2(0.577)(22 + 14)] = -12.59 k-ft/ft
where Lc = 235.2 in.
Dead load moment at the centerline of the exterior girder:
| MDL, Slab | = -0.1125(42.25/12)2/2 = -0.70 k-ft/ft |
| MDL, Parapet | = -0.65 (42.25 - 7.61)/12 = -1.88 k-ft/ft |
| MDL, FWS | = -0.03[(42.25 - 20.25)/12]2/2 = -0.05 k-ft/ft |
Factored dead load moment at the centerline of the exterior girder:
| MFDL | = 1.25(-0.70) + 1.25(-1.88) + 1.5(-0.05) = -3.3 k-ft/ft |
Based on Figure 4-10
The design factored dead load moment at the design section due to loads on the overhang is:
| MFDL,O | = 0.83(-3.3) = -2.74 k-ft/ft |
From Figure 4-11, the dead load design factored moment due to DL on the first deck span is:
| M | = 1.25[0.1125[0.4(9.66)(14/12) - (14/12)2/2]] + 1.5[0.03[0.4(9.66)(14/12) - (14/12)2/2]] = 0.71 k-ft/ft |
Total design dead load + collision moment:
| MDL + C | = -12.59 - 2.74 + 0.71 = -14.62 k-ft/ft |
Resistance factor = 1.0 for extreme event limit state (S1.3.2.1)
Assuming the slab thickness at this section equals 8 in. and the effective depth equals 5.19 in.;
Required area of steel = 0.62 in2/ft (3)
Design Case 2: Vertical collision force (SA13.4.1, Case 2)
For concrete parapets, the case of vertical collision never controls
Design Case 3: Check DL + LL (SA13.4.1, Case 3)
Except for decks supported on widely spaced girders (approximately 12 ft. and 14 ft. girder spacing for girders with narrow flanges and wide flanges, respectively), Case 3 does not control the design of decks supporting concrete parapets. Widely spaced girders allow the use of wider overhangs which in turn may lead to live load moments that may exceed the collision moment and, thus, control the design. The deck of this example is highly unlikely to be controlled by Case 3. However, this case is checked to illustrate the complete design process.
Resistance factor = 0.9 for strength limit state (S5.5.4.2.1).
a. Design section in the overhang (Section B-B in Figure 4-7)
The live load distribution width equations for the overhang (S4.6.2.1.3) are based on assuming that the distance from the design section in the overhang to the face of the parapet exceeds 12 in. such that the concentrated load representing the truck wheel is located closer to the face of the parapet than the design section. As shown in Figure 4-12, the concentrated load representing the wheel load on the overhang is located to the inside of the design section for negative moment in the overhang. This means that the distance "X" in the distribution width equation is negative which was not intended in developing this equation. This situation is becoming common as prestressed girders with wide top flanges are being used more frequently. In addition, Figure 4-6 may be wrongly interpreted as that there is no live load negative moment acting on the overhang. This would be misleading since the wheel load is distributed over the width of the wheels in the axle. Live load moment in these situations is small and is not expected to control design. For such situations, to determine the live load design moment in the overhang, either of the following two approaches may be used:
The design section may be conservatively assumed at the face of the girder web, or
The wheel load may be distributed over the width of the wheels as shown in Figure 4-12 and the moments are determined at the design section for negative moment. The distribution width may be calculated assuming "X" as the distance from the design section to the edge of the wheel load nearest the face of the parapet.
The latter approach is used in this example. The wheel load is assumed to be distributed over a tire width of 20 in. as specified in S3.6.1.2.5.
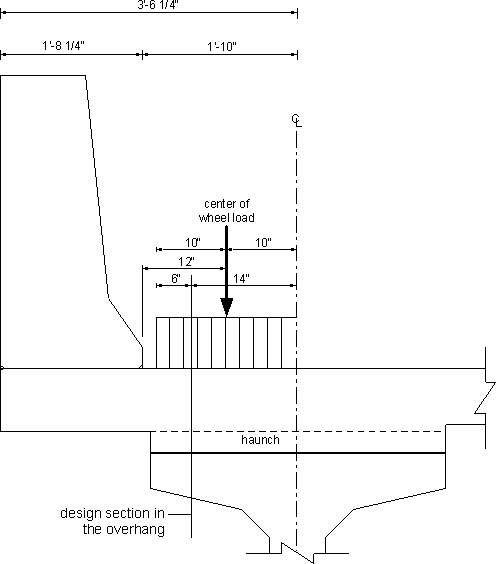
Figure 4-12 - Overhang Live Load - Distributed Load
Using the multiple presence factor for a single truck = 1.2 (S3.6.1.1.2) and dynamic load allowance for truck loading = 1.33 (S3.6.2.1), live load moment may be determined.
| Equivalent strip width for live load | = 45 + 10(6/12) = 50 in. (S4.6.2.1.3) |
Design factored moment:
| Mn | = -1.25(0.1125)[(42.25 - 14)/12]2/2 = -1.25(0.65)(42.25 - 14 - 7.61)/12 = -1.5(0.03)[(42.25 - 20.25 - 14)/12]2/2 = -1.75(1.33)(1.2)[16/(20/12)[((6/12)2/2)/(50/12)] = -2.60 k-ft/ft |
| d | = 6.19 in. |
Required area of steel = 0.09 in2/ft (4)
b. Check dead load + live load moments at design section in first span (Section C-C in Figure 4-7)
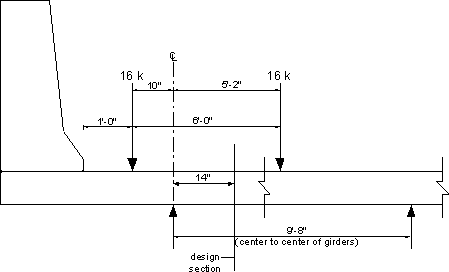
Figure 4-13 - Overhang Live Load
Assume slab thickness at this section = 8 in. (conservative to ignore the haunch)
Based on the earlier calculations for this section under collision + DL, DL factored moment at the section = -2.74 k-ft/ft.
Determining live load at this section may be conducted by modeling the deck as a beam supported on the girders and by moving the design load across the width of the deck to generate the moment envelopes. However, this process implies a degree of accuracy that may not be possible to achieve due to the approximate nature of the distribution width and other assumptions involved, e.g., the girders are not infinitely rigid and the top flange is not a point support. An approximate approach suitable for hand calculations is illustrated in Figure 4-13. In this approximate approach, the first axle of the truck is applied to a simply supported beam that consists of the first span of the deck and the overhang. The negative moment at the design section is then calculated. The multiple presence factor for a single lane (1.2) and dynamic load allowance (33%) are also applied. Based on the dimensions and the critical location of the truck axle shown in Figure 4-13, the unfactored live load moment at the design section for negative moment is 3.03 k-ft.
Live load moment (including the load factor, dynamic load allowance and multiple presence factor) = 3.03(1.75)(1.33)(1.2) = 8.46 k-ft
Since the live load negative moment is produced by a load on the overhang, use the overhang strip width at the girder centerline.
Equivalent strip width = 45 + 10(10/12) = 53.3 in. (S4.6.2.1.3)
Design factored moment (DL + LL) = 2.74 + 8.46/(53.3/12) = 4.65 k-ft/ft
Required area of steel = 0.19 in2/ft (5)
Design Step 4.11 - Detailing of Overhang Reinforcement
From the different design cases of the overhang and the adjacent region of the deck, the required area of steel in the overhang is equal to the largest of (1), (2), (3), (4) and (5) = 0.7 in2/ft
The provided top reinforcement in the slab in regions other than the overhang region is: #5 at 8 in. = 0.31(12/8) = 0.465 in2/ft
0.465 in2/ft provided < 0.7 in2/ft required, therefore, additional reinforcement is required in the overhang.
Bundle one #4 bar to each top bar in the overhang region of the deck.
Provided reinforcement = (0.2 + 0.31)(12/8) = 0.76 in2/ft > 0.7 in2/ft required OK.
Notice that many jurisdictions require a #5 minimum bar size for the top transverse reinforcement. In this case, the #4 bars used in this example would be replaced by #5 bars. Alternatively, to reduce the reinforcement area, a #5 bar may be added between the alternating main bars if the main bar spacing would allow adding bars in between without resulting in congested reinforcement.
Check the depth of the compression block:
| T | = 60(0.76) = 45.6 kips |
| a | = 45.6/[0.85(4)(12)] = 1.12 in. |
| β1 | = 0.85 for f′c = 4 ksi (S5.7.2.2) |
| c | = 1.12/0.85 = 1.32 in. |
Among Sections A, B and C of Figure 4-7, Section C has the least slab thickness. Hence, the ratio c/de is more critical at this section.
de at Section C-C = 5.19 in.
Maximum c/de = 1.32/5.19 = 0.25 < 0.42 OK (S5.7.3.3.1)
Cracking under service load in the overhang needs to be checked. The reinforcement area in the overhang is 65% larger than the negative moment reinforcement in the interior portions of the deck, yet the applied service moment (2.74 + 3.03 = 5.77 k-ft/ft) is 6% larger than the service moment at interior portions of the deck (5.42 k-ft/ft from Step 4.9). By inspection, cracking under service load does not control.
Determine the point in the first bay of the deck where the additional bars are no longer needed by determining the point where both (DL + LL) moment and (DL + collision) moments are less than or equal to the moment of resistance of the deck slab without the additional top reinforcement. By inspection, the case of (DL + LL) does not control and only the case of (DL + collision) needs to be checked.
Negative moment resistance of the deck slab reinforced with #5 bars at 8 in. spacing is 10.15 k-ft/ft for strength limit state (resistance factor = 0.9), or 11.27 k-ft/ft for the extreme event limit state (resistance factor = 1.0). By calculating the moments at different points along the deck first span in the same manner they were calculated for Section C-C for (DL + collision), it was determined that the design negative moment is less than 11.27 k-ft/ft at a point approximately 25 in. from the centerline of the exterior girder.
The theoretical termination point from the centerline of the exterior girder is 25 in.
Extend the additional bars beyond this point for a distance equal to the cut-off length. In addition, check that the provided length measured beyond the design section for moment is larger than the development length (S5.11.1.2.1).
Cut-off length requirement (S5.11.1.2.1)
Checking the three requirements of S5.11.1.2.1, the cut-off length is controlled by 15 times the bar diameter.
Cut-off length = 15(0.625) = 9.375 in.
Required length past the centerline of the exterior girder = 25 + 9.375 = 34.375 in.
Development length (S5.11.2)
The basic development length, ldb, is taken as the larger of:
OR
0.4dbfy = 0.4(0.625)(60) = 15 in.
OR
12 in.
Therefore, the basic development length = 15 in.
Correction factors:
| Epoxy-coated bars | = 1.2 (S5.11.2.1.2) |
| Two bundled bars | = 1.0 (S5.11.2.3) |
| Spacing > 6 in. | = 0.8 (S5.11.2.1.3) |
Development length = 15(1.2)(1.0)(0.8) = 14.4 in.
Required length of the additional bars past the centerline of the exterior girder = 14 + 14.4 = 28.4 in. < 34.375 in. (needed to be satisfy cut off requirements) OK
Extend the additional bars in the overhang a minimum of 34.375 in. (say 3 ft.) beyond the centerline of the exterior girder.
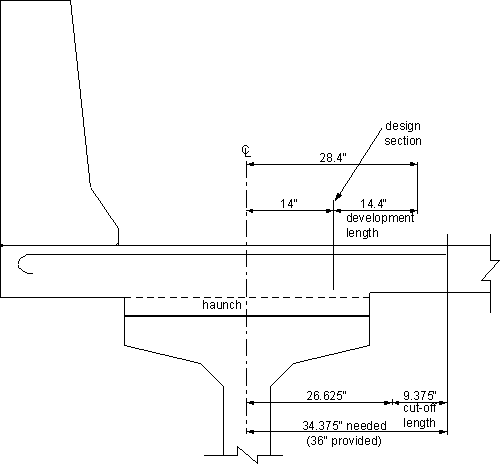
Figure 4-14 - Length of the Overhang Additional Bars
Design Step 4.12 - Longitudinal Reinforcement
Bottom distribution reinforcement (S9.7.3.2)
| Percentage of longitudinal reinforcement = |
where:
| S | = the effective span length taken as equal to the effective length specified in S9.7.2.3 (ft.); the distance between sections for negative moment and sections at the ends of one deck span = (116 - 14 - 14)(12) = 7.33 ft. |
| Percentage = |
Use 67% of transverse reinforcement
Transverse reinforcement = #5 at 7 in. spacing = 0.53 in2/ft
Required longitudinal reinforcement = 0.67(0.53) = 0.36 in2/ft
Use #5 bars; bar diameter = 0.625 in., bar area = 0.31 in2
Required spacing = 0.31/0.36 = 0.86 ft. (10.375 in.)
Use #5 bars at 10 in. spacing
Top longitudinal reinforcement
There are no specific requirements to determine this reinforcement. Many jurisdictions use #4 bars at 12 in. spacing for the top longitudinal reinforcement.
Design Step 4.13 - Deck top longitudinal reinforcement In the grinder negative moment region, i.e., over the intermediate supports of the girders
For simple span precast girders made continuous for live load: design according to S5.14.1.2.7
(Notice that for continuous steel girders, this reinforcement is designed according to S6.10.3.7.)
The required reinforcement area is determined during girder design. See Section 5.6 for the calculations for this reinforcement.
Provided reinforcement area = 14.65 in2
Use #6 bars at 5.5 in. spacing in the top layer
#6 bars at 8.5 in. spacing in the bottom layer
Design Step 4.14 - Check shrinkage and temperature reinforcement according to S5.10.8
Reinforcement for shrinkage and temperature stresses is provided near surfaces of concrete exposed to daily temperature changes. Shrinkage and temperature reinforcement is added to ensure that the total reinforcement on exposed surfaces is not less than the following:
As ≥ 0.11Ag/fy (S5.10.8.2-1)
where:
Ag = gross area of the section (in2)
= 12(7.5)
= 90 in2/ft. width of deckfy = specified yield strength of the reinforcing bars (ksi)
= 60 ksi
| As req | ≥ 0.11(90/60) ≥ 0.165 in2/ft. width of deck |
This area should be divided between the two surfaces, As req per surface = 0.0825 in2/ft. width of deck.
Assuming longitudinal reinforcement is #4 bars at 12 in. spacing:
As, provided = 0.2 in2/ft. width of deck > 0.0825 in2/ft. width of deck required OK
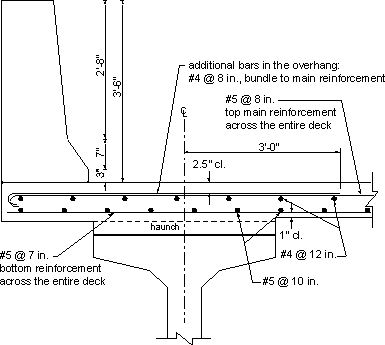
Figure 4-15 - Deck Reinforcement at Midspan of Girders
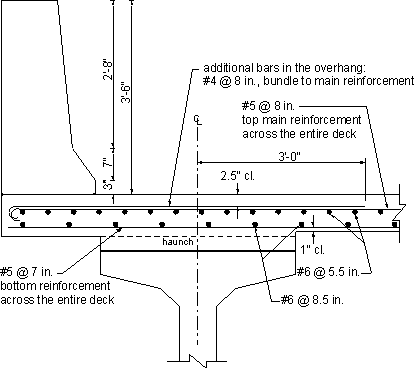
Figure 4-16 - Deck Reinforcement at Intermediate Pier


