
The study design, methods, and general data trends are the focus of this report. An assessment of one of the data quality indicator (DQI) goals as stated in the quality assurance project plan (QAPP) is shown in Table 11 for certain major parameters.
As shown in Figure 17, traffic activity exhibited a bi-modal distribution. This is typical of most cities in the U.S. Figures 18, 19, and 20 shows traffic activity by day of the week, box-whisker plot by weekday and weekend, and traffic volume by season for the study period.

Figure 17. Average Hourly Traffic Volume by Month at I-96 Site.

Figure 18. Average Daily Traffic Volume by Day-of-Week at I-96 Site.
Figure 19. Box-Whisker Plot -- average hourly traffic volume by weekday and weekend[1].

Figure 20. Box-Whisker Plot -- average hourly traffic volume by season.
Figure 4 shows the wind direction and wind speeds observed during the course of the study. As can be seen from the wind roses, there were strong northwesterly winds during the morning commute hours. One implication of these wind conditions is that the study sites may have been influenced by nearby sources such as roadway traffic from US-24, Telegraph Road. Telegraph Road is a 6-lane divided highway approximately 440 meters west of Station 2 and 380 meters west of Station 3. An additional nearby source of air pollutants emissions was the apartment complex immediately adjacent (west of Station 2 and 3). The source of emissions at the apartment complex was most probably cold-start emissions from passenger vehicles.
Figure 21 and Figure 22 show the mean concentrations by site from all wind directions and winds from the road, respectively. The mean CO concentration for the 10 m roadside site is approximately 46% higher than the 100 m downwind site for all wind conditions. The mean concentration for the 10 m roadside site is approximately 37% higher than the 300 m downwind site for all wind conditions. The mean concentration for the 10 m roadside site is approximately 11% higher than the 100 m upwind site for all wind conditions.
The mean CO concentration for the 10 m roadside site is approximately 76% higher than the 100 m downwind site for downwind conditions (winds from the road). The mean concentration for the 10 m roadside site is approximately 59% higher than the 300 m downwind site for downwind conditions (winds from the road). The mean concentration for the 10 m roadside site is approximately 89% higher than the 100 m upwind site for downwind conditions (winds from the road).

Figure 21. Box-Whisker Plot Mean CO Concentration by Site (all wind directions).

Figure 22. Box-Whisker Plot Mean CO Concentration by Site (winds from road).
Figure 23 shows the mean CO concentration by hour for all stations when winds are from the road. Figure 24 shows the mean CO concentration by hour for all four stations when the winds are from the road vs. hourly average traffic.

Figure 23. Mean CO Concentration by Hour: all stations (winds from road).

Figure 24. Mean CO Concentration and Traffic Volume by Hour: all stations (winds from road).
Figure 25 shows the normalized spatial gradient for NO2, CO and BC for all wind conditions. The spatial gradient for each pollutant has been normalized to the relevant pollutant for Site 1.

Figure 25. Mean NO2, CO, BC Normalized Concentrations - all wind conditions.
Figure 26 shows the normalized spatial gradient for NO2, CO and BC for downwind conditions (winds from road). The spatial gradient for each pollutant has been normalized to the relevant pollutant for Site 1.

Figure 26. Mean NO2, CO, BC Normalized Concentrations - winds from road (downwind).
Figure 27 and Figure 28 show the mean hourly NO concentrations by site from all wind directions and winds from road, respectively. The mean NO concentration for the 10 meter roadside site is approximately 243% higher than the 100 meter upwind site (Figure 27) for all wind directions. The mean NO concentration for the 10 meter road is approximately 100% higher than the 100 meter upwind site (Figure 28) for downwind conditions (winds from road). Figure 29 shows the mean NO concentration by hour for all stations when winds are from the road.

Figure 27. Box-Whisker Plot for NO by Station (all wind directions).

Figure 28. Box-Whisker Plot for NO by Station (winds from road).

Figure 29. Mean NO Concentration by Hour: all stations (winds from road).
Figure 30 and Figure 31 show the mean hourly NO2 concentrations by site from all wind directions and winds from road, respectively. The mean NO2 concentration for the 10 meter roadside site is approximately 15% higher than the 100 meter upwind site (Figure 30) for all wind directions. The mean NO2 concentration for the 10 meter roadside site is approximately 11 % higher than the 100 meter upwind site (Figure 31) for downwind conditions (winds from road). Figure 32 shows the mean NO2 concentration by hour for all stations when winds are from the road.

Figure 30. Box-Whisker Plot for NO2 by Station (all wind directions).

Figure 31. Box-Whisker Plot for NO2 by Station (winds from road).

Figure 32. Mean NO2 Concentration by Hour: all stations (winds from road).
Figure 33 and Figure 34 show the mean hourly NOX concentrations by site from all wind directions and winds from road, respectively. The mean NOX concentration for the 10 meter roadside site is approximately 41% higher than the 100 meter upwind site (Figure 33) for all wind directions. The mean NOX concentration for the 10 m roadside site is approximately 143 % higher than the 100 meter upwind site (Figure 34) for downwind conditions (winds from road). Figure 35 shows the mean NOX concentration by hour for all stations when winds are from the road.

Figure 33. Box-Whisker Plot for NOX by Station (all wind directions).

Figure 34. Box-Whisker Plot for NOX by Station (winds from road).

Figure 35. Mean NOX Concentration by Hour: all stations (winds from road).
Long term averages for NO, NO2, NOx, and CO for all wind directions are shown in Table 12 and Table 13. Figure 36 shows a polar plot for CO and Figure 37 show polar plots for NO, NO2, NOX. The radial dimension indicates wind speed and wind direction. The plots indicate relative air pollutant concentrations for all wind conditions. As may be seen in the figures, the higher air pollutant concentrations are observed during low wind speeds.

Figure 36 Polar plot for CO for all stations and all wind conditions- units = ppm.

Figure 37 Polar plot for NO, NO2 and NOX for all stations and all wind conditions- units = ppb.
Table 12. Long-term averages at near-road monitoring stations for NO, NO2, NOx, and CO - all wind directions.
CO (ppm) |
NO (ppb) |
NO2 (ppb) |
NOX (ppb) |
||||||||||
|---|---|---|---|---|---|---|---|---|---|---|---|---|---|
Location |
Time span |
N |
Avg |
95% CI |
N |
Avg |
95% CI |
N |
Avg |
95% CI |
N |
Avg |
95% CI |
-100 |
09/29/2010 to 06/20/2011 |
70197 |
0.37 |
0.36 - 0.37 |
65414 |
15.51 |
15.27 - 15.76 |
65414 |
18.83 |
18.75 - 18.91 |
65414 |
34.34 |
34.05 - 34.63 |
10 |
09/29/2010 to 06/20/2011 |
52834 |
0.41 |
0.40 - 0.41 |
51009 |
31.06 |
30.73 - 31.38 |
51009 |
17.41 |
17.32 - 17.50 |
51009 |
48.46 |
48.07 - 48.86 |
100 |
09/29/2010 to 06/20/2011 |
66761 |
0.28 |
0.27 - 0.28 |
66737 |
9.05 |
8.90 - 9.19 |
66737 |
15.17 |
15.09 - 15.25 |
66737 |
24.21 |
24.01 - 24.41 |
300 |
09/29/2010 to 06/20/2011 |
41068 |
0.30 |
0.30 - 0.30 |
20295 |
9.04 |
8.74 - 9.33 |
20295 |
18.31 |
18.14 - 18.48 |
20295 |
27.35 |
26.94 - 27.76 |
Table 13. Long-term averages a near-road monitoring stations for NO, NO2, NOx, and CO - winds from the South.
CO (ppm) |
NO (ppb) |
NO2 (ppb) |
NOX (ppb) |
||||||||||
|---|---|---|---|---|---|---|---|---|---|---|---|---|---|
Location |
Time span |
N |
Avg |
95% CI |
N |
Avg |
95% CI |
N |
Avg |
95% CI |
N |
Avg |
95% CI |
-100 |
09/29/2010 to 06/20/2011 |
11689 |
0.27 |
0.27 - 0.27 |
10339 |
2.89 |
2.79 - 2.99 |
10339 |
14.39 |
14.24 - 14.54 |
10339 |
17.28 |
17.06 - 17.50 |
10 |
09/29/2010 to 06/20/2011 |
11521 |
0.51 |
0.50 - 0.51 |
11519 |
51.86 |
51.15 - 52.58 |
11519 |
22.19 |
22.03 - 22.34 |
11519 |
74.05 |
73.23 - 74.86 |
100 |
09/29/2010 to 06/20/2011 |
17477 |
0.29 |
0.29 - 0.29 |
17477 |
10.49 |
10.29 - 10.69 |
17477 |
20 |
19.87 - 20.13 |
17477 |
30.49 |
30.20 - 30.79 |
300 |
09/29/2010 to 06/20/2011 |
9616 |
0.32 |
0.32 - 0.32 |
6869 |
6.02 |
5.68 - 6.36 |
6869 |
19.75 |
19.50 - 20.00 |
6869 |
25.77 |
25.25 - 26.29 |
Summaries of the annual BC averages and confidence intervals at each site are presented in Table 14 and shown in Figure 38. The data show that, on an average basis with winds from all directions, the BC annual average at 10 m from the highway is significantly higher than at further distances from the road. In addition, BC average values at 100 m in the predominant downwind direction (South of the highway) are significantly higher than at 100 m in the opposite direction, as well as higher than at 300 m on the downwind side of the road. Station 1 BC is approximately 65%, 115%, and 41% higher than Station 2 (100 m downwind), Station 3 (300 m downwind), and Station 4 (100 m upwind) sites, respectively.
Table 14. BC averages for all data (09/29/2010-06/15/2011)
Site name |
Distance from Road |
N |
Mean (µg/m-3) |
95% CI (µg/m-3) |
|---|---|---|---|---|
Station 4 |
100 Meter Upwind |
60,480 |
.61 |
0.61 - 0.62 |
Station 1 |
10 meter roadside |
71,771 |
.86 |
0.85 - 0.86 |
Station 2 |
100 Meter Downwind |
71,150 |
.52 |
0.52 - 0.53 |
Station 3 |
300 Meter Downwind |
69,981 |
.40 |
0.39 - 0.40 |
BC hourly values were also isolated for time periods with winds from the south, designated as 180 ± 60 degrees (Table 15). On the downwind side of the road, BC values at Station 1 are significantly higher than all other stations. Figure 39 and Figure 40 show the mean BC concentrations by site from all wind directions and winds from road, respectively. Station 1 BC is approximately 83%, 167%, and 137% higher than Station 2 (100 m downwind), Station 3 (300 m downwind), and Station 4 (100 m upwind) sites, respectively. Figure 41 shows the mean BC concentration by hour for all stations when winds are from the road.
Table 15. BC averages,wind from the South (09/29/2010-06/15/2011)
Site name |
Distance from Road |
N |
Mean (µg/m-3) |
95% CI (µg/m-3) |
|---|---|---|---|---|
Station 4 |
100 Meter Upwind |
14341 |
0.54 |
0.54 - 0.55 |
Station 1 |
10 meter roadside |
18184 |
1.28 |
1.26 - 1.29 |
Station 2 |
100 Meter Downwind |
18240 |
0.70 |
0.70 - 0.71 |
Station 3 |
300 Meter Downwind |
18356 |
0.48 |
0.47 - 0.48 |
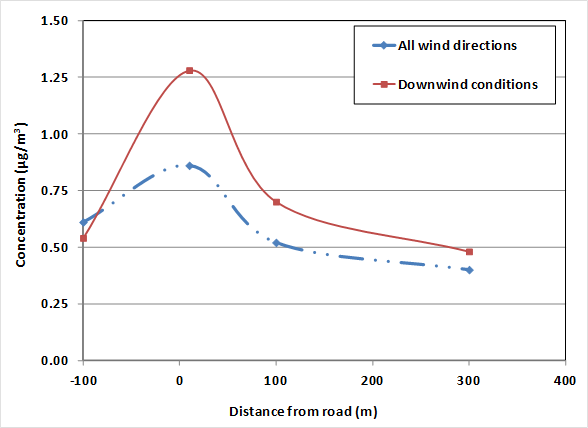
Figure 38. Average black carbon concentrations as a function of distance from the road for all data and during time periods with wind from the South (120-240 degrees).

Figure 39. Box-Whisker Plot for BC by Station (all wind directions).

Figure 40. Box-Whisker Plot for Hourly BC by Station (winds from road).

Figure 41. Mean BC Concentration by Hour: all stations (winds from road).
Table 16 and Table 17 and Figure 42 show data that were measured by a TEOM 1405 FDMS and are the five-minute data summarized over the period of the study. Most analyzers deployed for this study performed well with the exception of the TEOMs. This instrument had both design and manufacturing issues that only became apparent after the instruments had been deployed. The remedy for this situation was that the manufacturer performed an "in the field upgrade" by technical staff from ThermoScientific in late November 2009 and early December 200-during the Las Vegas study. While these upgrades improved instrument performance and stability, data collected over the course of the study is problematic.
Table 16. PM10, PM2.5 and PM Coarse averages for all wind directions (09/29/2010-06/15/2011)
Site name |
Distance from Road |
N |
Mean (µg/m3) |
95% CI (µg/m3) |
|---|---|---|---|---|
PM10 |
||||
Station 4 a |
100 Meter Upwind |
60196 |
15.71 |
15.60 - 15.82 |
Station 1 |
10 meter roadside |
30386 |
22.71 |
22.46 - 22.95 |
Station 2 |
100 Meter Downwind |
39704 |
18.67 |
18.54 - 18.79 |
Station 3 b |
300 Meter Downwind |
28934 |
20.99 |
20.50 - 21.48 |
PM2.5 |
||||
Station 4 a |
100 Meter Upwind |
57004 |
11.00 |
10.91 - 11.09 |
Station 1 |
10 meter roadside |
30185 |
13.89 |
13.73 - 14.04 |
Station 2 |
100 Meter Downwind |
39708 |
11.55 |
11.46 - 11.63 |
Station 3 b |
300 Meter Downwind |
28911 |
17.00 |
16.48 - 17.52 |
PM Coarse |
||||
Station 4a |
100 Meter Upwind |
61373 |
5.41 |
5.34 - 5.47 |
Station 1 |
10 Meter Roadside |
30646 |
8.95 |
8.81 - 9.10 |
Station 2 |
100 Meter Downwind |
39790 |
7.10 |
7.04 - 7.16 |
Station 3 b |
300 Meter Downwind |
30296 |
5.87 |
5.68 - 6.06 |
Table 17. PM10, PM2.5 and PM Coarse averages for winds from road (09/29/2010-06/15/2011)
Site Name |
Distance from Road |
N |
Mean (µg/m3) |
95% CI (µg/m3) |
|---|---|---|---|---|
PM10 |
||||
Station 4 |
100 Meter Upwind |
10453 |
17.26 |
17.02 - 17.50 |
Station 1 |
10 Meter Roadside |
7829 |
33.45 |
33.00 - 33.89 |
Station 2 |
100 Meter Downwind |
10270 |
25.72 |
25.50 - 25.95 |
Station 3 |
300 Meter Downwind |
6914 |
27.98 |
26.83 - 29.12 |
PM2.5 |
||||
Station 4 |
100 Meter Upwind |
9734 |
13.19 |
12.98 - 13.40 |
Station 1 |
10 Meter Roadside |
7819 |
19.84 |
19.60 - 20.08 |
Station 2 |
100 Meter Downwind |
10270 |
15.58 |
15.43 - 15.74 |
Station 3 |
300 Meter Downwind |
6913 |
22.20 |
20.94 - 23.47 |
PM Coarse |
||||
Station 4 |
100 Meter Upwind |
10692 |
4.77 |
4.66 - 4.87 |
Station 1 |
10 Meter Roadside |
7839 |
13.69 |
13.38 - 14.00 |
Station 2 |
100 Meter Downwind |
10279 |
10.13 |
10.00 - 10.26 |
Station 3 |
300 Meter Downwind |
7104 |
7.14 |
6.96 - 7.33 |
|
|
|
|
|
|
Figure 42 Box-Whisker Plots for PM10, PM2.5 and PM Coarse for all stations; all wind directions and winds from road.
Table 18. VOC -- averages for all wind directions (09/29/2010-06/15/2011)
Site name |
Distance from Road |
N (Obs.) |
Mean (ppb) |
95% CI (ppb) |
|---|---|---|---|---|
Acrolein |
||||
4 |
100 m upwind |
32 |
0.72 |
0.55 - 0.89 |
1 |
10 m roadside |
37 |
0.69 |
0.56 - 0.82 |
2 |
100 m downwind |
21 |
0.68 |
0.54 - 0.81 |
3 |
300 m downwind |
34 |
0.63 |
0.51 - 0.74 |
1,3-Butadiene |
||||
4 |
100 m upwind |
31 |
0.13 |
0.08 - 0.18 |
1 |
10 m roadside |
37 |
0.19 |
0.14 - 0.24 |
2 |
100 m downwind |
21 |
0.13 |
0.07 - 0.18 |
3 |
300 m downwind |
34 |
0.12 |
0.07 - 0.16 |
Benzene |
||||
4 |
100 m upwind |
32 |
0.36 |
0.27 - 0.44 |
1 |
10 m roadside |
37 |
0.46 |
0.36 - 0.55 |
2 |
100 m downwind |
21 |
0.29 |
0.19 - 0.40 |
3 |
300 m downwind |
34 |
0.32 |
0.24 - 0.40 |
NOTE: Data are for valid samples only.
All sample results are presented with no blank or recovery correction. This was deemed unnecessary as the field blank values were either zero, below the method detection limit, or not statistically significant. Blank and control values may be found in the SAS/JMP data sets.

Figure 43 Box-Whisker Plot for 1,3-Butadiene all stations, all sample times, all wind directions.

Figure 44 Box-Whisker Plot for 1,3-Butadiene all stations, all sample times, downwind conditions.

Figure 45 Box-Whisker Plot for Acrolein all stations, all sample times, all wind directions.

Figure 46 Box-Whisker Plot for Acrolein all stations, all sample times, downwind conditions.

Figure 47 Box-Whisker Plot for Benzene all stations, all sample times, all wind directions.

Figure 48 Box-Whisker Plot for Benzene all stations, all sample times, downwind conditions.
Table 19. Carbonyl -- averages for all wind directions (09/29/2010-06/15/2011)
Site name |
Distance from Road |
N |
Mean |
95% CI |
|---|---|---|---|---|
(Obs.) |
(ppb) |
(ppb) |
||
Acrolein |
||||
4 |
100 m upwind |
32 |
3.83 |
1.02 - 6.64 |
1 |
10 m roadside |
34 |
4.08 |
1.43 - 6.74 |
2 |
100 m downwind |
30 |
1.21 |
0.17 - 2.25 |
3 |
300 m downwind |
36 |
1.12 |
0.34 - 1.90 |
Acetaldehyde |
||||
4 |
100 m upwind |
32 |
2.16 |
1.38 - 2.94 |
1 |
10 m roadside |
34 |
2.67 |
1.10 - 4.23 |
2 |
100 m downwind |
30 |
2.05 |
1.24 - 2.87 |
3 |
300 m downwind |
36 |
1.68 |
0.90 - 2.45 |
Formaldehyde |
||||
4 |
100 m upwind |
32 |
3.14 |
1.93 - 4.35 |
1 |
10 m roadside |
34 |
3.27 |
2.02 - 4.53 |
2 |
100 m downwind |
30 |
2.6 |
1.30 - 3.89 |
3 |
300 m downwind |
36 |
3.13 |
1.94 - 4.32 |
NOTE: Data are for valid samples only.
Background corrections were not performed on the carbonyl data. This was deemed unnecessary as the field blank values were either zero, below the method detection limit, or not statistically significant. A field blank, as defined in the EPA Compendium TO-11A DNPH carbonyl method, is a DNPH cartridge that is treated in the same manner as a sample cartridge except no sample air is drawn through the field blank. These field blanks are sent back to the laboratory, analyzed and values were reported for carbonyls.

Figure 49 Box-Whisker Plot for Acetaldehyde all stations, all sample times, all wind directions.

Figure 50 Box-Whisker Plot for Acetaldehyde all stations, all sample times, downwind conditions.

Figure 51 Box-Whisker Plot for Formaldehyde all stations, all sample times, all wind directions.

Figure 52 Box-Whisker Plot for Formaldehyde all stations, all sample times, downwind conditions.

Figure 53 Box-Whisker Plot for Acrolein all stations, all sample times, all wind directions.

Figure 54 Box-Whisker Plot for Acrolein all stations, all sample times, downwind conditions.

Figure 55 Mean carbonyl and VOC concentration gradients-normalized to Station 1 for each pollutant: all sites and all wind conditions. Normalized means for each site shown in Figures 55 and 56 were calculated as follows: VPS/VPs1; where V = average value, p = pollutant, s = site, s1 = site 1.

Figure 56 Mean carbonyl and VOC concentration gradients-normalized to Station 1 for each pollutant: all sites for downwind conditions (winds from south). Normalized means for each site shown in Figures 55 and 56 were calculated as follows: VPS/VPs1; where V = average value, p = pollutant, s = site, s1 = site 1.
Acrolein results are presented for both TO-15 (VOCs) and TO-11a (carbonyls) methods and the results should be used with caution. Method TO-15 utilizes passivated stainless steel canisters under vacuum to be filled at a constant rate to near ambient pressure for a specified time period. The air collected in the canisters undergoes laboratory analysis using a GC/MS. Method TO-11a utilizes cartridges containing DNPH coated media. These cartridges are connected to a sampler that draws ambient air at a constant rate for a specified time period. These cartridges undergo laboratory analysis using High-Performance Liquid Chromatography (HPLC)
Both methods are considered problematic as both methods have issues with the measurement of acrolein. The TO-15 method is considered problematic due to the "growth" of acrolein inside cleaned canisters. Acrolein concentrations inside cleaned canisters containing zero humidified air have been shown to increase over time due to unknown reasons. The TO-11a method is considered inaccurate due to the retention instability on the DNPH coated absorbent and low acrolein capture efficiency.
Moreover, caution should be used when comparing Las Vegas acrolein measurements to Detroit acrolein measurements. Acrolein values for Las Vegas were reported using TO-11a, while acrolein values for Detroit are reported using TO-11a and TO-15. We observed "growth" of acrolein in canisters during the Las Vegas study and for this reason we had very low confidence in the data and did not report acrolein results using TO-15. We did not observe "growth" of acrolein in canisters during the Detroit study.
EPA is continuing to research acrolein measurement methods, specifically focusing on the TO-15 method. This research is currently identified as a priority in EPA ORD's research action plan.
A summary of PM2.5 averages and confidence intervals are shown in Table 20. Figure 57 shows box-whisker plots PM2.5 integrated filter samples. Figure 58 shows PM2.5 data by date and site.
Table 20. PM2.5 Filters -- averages for all wind directions (09/29/2010-06/15/2011)
Site name |
Distance from Road |
N |
Mean |
95% CI |
|---|---|---|---|---|
Station 4 |
100 m upwind |
17 |
11.46 |
8.14 - 14.78 |
Station 1 |
10 m roadside |
19 |
12.87 |
8.84 - 16.90 |
Station 2 |
100 m downwind |
16 |
12.12 |
8.53 - 15.71 |
Station 3 |
300 m downwind |
18 |
10.4 |
7.10 - 13.69 |
NOTE: Data are for valid samples only.

Figure 57 Box-Whisker Plot for PM2.5 for all stations, all sample times, all wind directions.

Figure 58 Bar chart for PM2.5 (µg/m3) for all stations, all sample times, all wind directions.


