

Final Report Phase 1 - Temporary Wet-weather Pavement Markings for Mork Zones
APPENDIX A-2: SELECTION AND INSTALLATION OF THREE CANDIDATE PAVEMENT MARKING SYSTEMS AT TTI
In summary, we have identified three candidate experimental pavement markings, installed them in the TTI Riverside facility alongside two other pavement markings as control conditions, collected retroreflectivity data on these markings, and conducted a pilot human factors experiment to finalize the experimental design for the Task 2 human factors experiment.
Retroreflectivity Data Analysis and Material Selection for the Field Experiment at TTI
Phase I - Task 1: Initial pre-screening of candidate pavement marking systems
The objective of this task was to pre-screen twenty-two (22) alternative prototypes constructions to identify the three (3) best performing all-weather work zone pavement marking systems with promising retroreflectivity characteristics under dry and wet weather conditions for further evaluation in Task 2. The prototype constructions and controls installed on the New Orleans test deck are listed in Table 4. The test markings were installed on November 28, 2008 and the ensuing initial measurements were conducted the next day. The 3M team made subsequent measurements on December 10-11, December 17-18 with the final measurement on January 8-9. These measurements were conducted effectively 1, 11, 18 and 41 days after installation. The purpose of these measurements was to determine the durability of retroreflectivity of each prototype in a customized field test.
The test and control markings were applied in a longitudinal CEN-style test deck configuration at four locations across the road: centerline, left wheel track, right wheel track, and right edge line. The criterion for evaluating the experimental prototype in Task 1 was the durability and more specifically retention of retroreflectivity under dry, wet and rainy conditions. In order to effectively provide clear nighttime delineation within a work zone over time it is necessary for the markings to maintain a relatively high level of retroreflective efficiency under all weather conditions. It is well established that pavement marking retroreflectivity deteriorates at different rates depending on their position on the road. The four locations used in the CEN-style test deck configuration represent both common in-use wear (i.e., centerline and edge line) as well as "accelerated" wear conditions (i.e., left and right wheel track). The wheel track positions are subjected to greater wear (i.e., significantly higher number of wheel hits) than the edge line or centerline positions thereby providing a rapid test of the durability of the test markings. Given the duration of testing, we concentrated our attention on the accelerated wear at the right wheel track location for all of the experimental prototypes.
Coefficient of retroreflected luminance (RL) was measured on the test pavement markings using a LTL-X portable retroreflectometer. Measurements were made using several test procedures simulating different conditions - dry, wet and rain. For the 'rain' and 'wet' conditions, the majority of measurements were made using a portable rain simulator designed by 3M Germany that fulfills the requirements of EN1436. This EN standard calls for "...artificial rainfall, without mist or fog, at an average intensity of (20 ± 2) mm/h...[0.8± 0.08 in./hr]." We were unable to make measurements of RL 'wet' or 'rain' for test markings 1-5 in the right wheel track position on the 41st day due to a natural rain event.
| Prototype Number | Wet Paint Film (mils) | Element Size | Drop Rate (g/lineal ft) |
2nd Drop beads | Drop rate (g/lineal ft) |
|---|---|---|---|---|---|
| Prototype All-weather Work Zone Pavement Markings | |||||
| 1 | 15 | Small | 4 | M247 Type 1 | 12 |
| 2 | 15 | Small | 8 | M247 Type 1 | 12 |
| 3 | 15 | Small | 12 | M247 Type 1 | 12 |
| 4 | 20 | Small | 4 | M247 Type 1 | 12 |
| 5 | 20 | Medium | 4 | M247 Type 1 | 12 |
| 6 | 20 | Medium | 8 | M247 Type 1 | 12 |
| 7 | 20 | Medium | 12 | M247 Type 1 | 12 |
| 8 | 15 | Medium | 4 | M247 Type 1 | 12 |
| 9 | 20 | Medium* | 4 | M247 Type 1 | 12 |
| 10 | 20 | Medium** | 4 | M247 Type 1 | 12 |
| 11 | 20 | Medium*** | 4 | M247 Type 1 | 12 |
| 12 | 20 | Medium | 4 | MO Type P | 12 |
| 13 | 20 | Medium | 4 | M247Type 3 | 12 |
| 14 | 20 | Medium | 4 | 1.9 index Type 1@ | 12 |
| 15 | 25 | Large | 4 | M247 Type 1 | 12 |
| 16 | 25 | Large | 8 | M247 Type 1 | 12 |
| 17 | 25 | Large | 12 | M247 Type 1 | 12 |
| 18 | 20 | Large | 4 | M247 Type 1 | 12 |
| 22 | 25 | Large | 4 | MO Type P | 12 |
| Control and Reference Pavement Markings | |||||
| 19 | 15 | -- | -- | M247 Type 1 | 12 |
| 20 | 20 | -- | -- | M247 Type 3 | 12 |
| 21 | 15 | -- | -- | 1.9 index Type 1@ | 12 |
| 23 | 3Mtm Stamarktm Wet Reflective Removable Tape Series 780 | ||||
| 24 | 3Mtm Stamarktm Extended Season Tape Series 380 | ||||
** = 50:50 blend of 2.4 index and 1.9 index elements;
*** = only 1.9 index elements;
@ = 1.9 index beads with the size distribution similar of M247 Type 1
As noted above the main criteria for assessing the performance of the experimental prototype markings is their durability in terms of maintained level of retroreflection. Higher retained retroreflection translates to higher retained luminance and better visibility for the nighttime driver especially under rainy conditions. Since visibility is typically worst under active rainfall at night, retroreflective efficiency in 'rain' conditions has been chosen as the primary consideration for ranking the performance of the various prototypes. Dry retroreflective properties are also considered, but within the scope of this project we considered them a secondary consideration as long their values were greater than 200 mcd/m2/lx, which is considered sufficient for good night visibility. Table 5 shows the 41 day results for the prototypes sorted by their RL-Rain values in 0.8 inch/hr simulated rain obtained using the EN 1436 rain simulator. We used this data as the basis for selection of three prototypes to take on to Task 2.
| Prototype Number | Wet Paint Film (mils) | Element size | Element Drop Rate | Dry | EN1436 rain simulator @0.8 in/hr | Recovery @ +45 sec |
|---|---|---|---|---|---|---|
| 7 | 20 | Medium | 12 | 517 | 175 | 283 |
| 16 | 25 | Large | 8 | 522 | 174 | 264 |
| 6 | 20 | Medium | 8 | 405 | 127 | 189 |
| 17 | 25 | Large | 12 | 574 | 124 | 194 |
| 14 | 20 | Medium | 4 | 622 | 105 | 171 |
| 12 | 20 | Medium | 4 | 428 | 103 | 143 |
| 13 | 20 | Medium | 4 | 427 | 98 | 126 |
| 9 | 20 | Medium* | 4 | 282 | 81 | 122 |
| 15 | 25 | Large | 4 | 433 | 67 | 96 |
| 22 | 25 | Large | 4 | 366 | 41 | 75 |
| 10 | 20 | Medium** | 4 | 454 | 36 | 54 |
| 8 | 15 | Medium | 4 | 351 | 34 | 55 |
| 18 | 20 | Large | 4 | 355 | 25 | 60 |
| 11 | 20 | Medium*** | 4 | 707 | 18 | 25 |
| 5 | 20 | Medium | 4 | 333 | 27a | 59a |
| 2 | 15 | Small | 8 | 257 | 23a | 69a |
| 1 | 15 | Small | 4 | 265 | 22a | 38a |
| 4 | 20 | Small | 4 | 278 | 22a | 32a |
| 3 | 15 | Small | 12 | 249 | 7a | 22a |
*= Only 2.4 index elements; ** = 50:50 blend of 2.4 index and 1.9 index elements; *** =only 1.9 index elements; a = 18 day values for reference.
The performance of the prototypes could be broken down into four groups based on these test results. First, it is clear that element size is significant with small elements exhibiting consistently poorer durability than medium or large elements. Therefore no prototypes with small elements are considered for Task 2. Second, among those with medium and large elements higher element drop rates performed better, with 4 gram/foot drop rate performing the worst. However the benefit tapered off at higher drop rates, in that, there was no significant performance increase observed in using 12 gram/foot over the 8 gram/foot rate. Therefore, for economic considerations, no formulations using 12 gram/foot of elements are carried over to Task 2. Third group is those prototypes with 'rain' values on the order of 100 mcd/m2/lx or greater. This leaves five (5) prototypes with relatively high performance under rain, recovery and dry conditions. Prototypes 12, 13 and 14 were found to be essentially equivalent in their rain performances. Prototype 12 employed MO Type P glass beads as the second drop optics, which gives it a cost advantage over the other two. Upon further inspection of the results, a clear durability benefit appeared in using MO Type P as the second drop optics with the medium elements. Based on our analysis, the three prototypes to carry on to Task 2 were prototypes 12, 6, and 16 as shown in Table 6.
| Marking | Base Prototype | Wet Film Paint@ thickness (mils) | 1st Drop Optics (drop rate/ 4 in line) |
2nd Drop Optics (drop rate/ 4 in line) |
|---|---|---|---|---|
| EXPT A | 12 | 20 | Medium 3M dual-optics elements (4g/lineal ft) | MODOT Type P glass beads (12g/lineal ft) |
| EXPT B | 6 | 20 | Medium 3M dual-optics elements (8g/lineal ft) | MODOT Type P glass beads (12g/lineal ft) |
| EXPT C | 16 | 25 | Large 3M dual-optics elements (8g/lineal ft) | M247 Type 1 glass beads (12g/lineal ft) |
@ = High-build waterborne paint
Kick-off meeting with state agency representatives and TTI research team
The kick-off meeting was held at the ATTSA annual meeting in New Orleans in early February. The candidate state representatives and the research team members were planning to attend to this meeting in New Orleans, which was also very timely to start discussions about the involvement of these states in the project. The PI made a short presentation to the state agency representatives explaining the Highways for LIFE Technology Partnership Program and the objectives and tasks of this project for their support. The states were receptive and supportive, and reiterated their intent to collaborate. Further action items identified in the meeting were to determine the criteria to be sent to the states for pre-screening work zones in respective states for the spring 2009 construction season.
Installation of Experimental Pavement Marking Materials at TTI
The five test pavement marking were installed in accordance with the Detailed Project Plan for Task 2. The markings consisted of the three experimental prototypes chosen based on the results of Task 1 plus two reference markings (Table 7). The test markings were installed at predetermined locations at the Texas A&M University Riverside Campus. Figure 7 shows a map illustrating where each marking was installed.
| Marking | Based on Task1 Prototype | Wet Film Paint@ thickness (mils) | 1st Drop Optics (drop rate/ 4 in line) |
2nd Drop Optics (drop rate/ 4 in line) |
|---|---|---|---|---|
| EXPT A | 12 | 20 | Medium 3M dual-optics elements (4g/lineal ft) | MODOT Type P glass beads (12g/lineal ft) |
| EXPT B | 6 | 20 | Medium 3M dual-optics elements (8g/lineal ft) | MODOT Type P glass beads (12g/lineal ft) |
| EXPT C | 16 | 25 | Large 3M dual-optics elements (8g/lineal ft) | M247 Type 1 glass beads (12g/lineal ft) |
| Ref. 1 | 19 | 15 | M247 Type 1 glass beads (12g/lineal ft) | NA |
| Ref. 2 | 23 | NA | 3Mtm Stamarktm Wet Reflective Removable Tape Series 780 | NA |
@ = High-build waterborne paint
In order to allow the test pavement marking lines to be easily removed from the roadway surface after completion of the experiments, a thin black polymer film with a pressure sensitive adhesive was laminated to the road ( Figure 8). The black film was laid out onto the roadway in the required configuration and tamped down to conform to the roadway surface. Four-inch wide painted lines were applied onto the black film using a self-propelled application cart with double drop capability manufactured by EZ Liner Industries ( Figure 9). Target paint film application was achieved through the appropriate choice of spray tip, distance between the spray tip and road surface and application ground speed. Paint wet film thickness was calibrated prior to installation for each experimental marking. Target application of the first drop and second drop optics was achieved by calibration of delivery rates and by adjustment of distribution across the surface of the paint line ( Figure 10). Calibrations for paint and optics application followed procedures used in the industry to set the application parameters on a full scale paint striping truck. For each painted line the 'stem' was painted and allowed to dry to a track free state, then the 'tails' were painted. Reference marking 2, a commercial all-weather pavement marking tape, was installed by hand and applied directly to the black polymer film, which was already on the road. This installation technique was used to insure that all markings were applied using the same protocol.
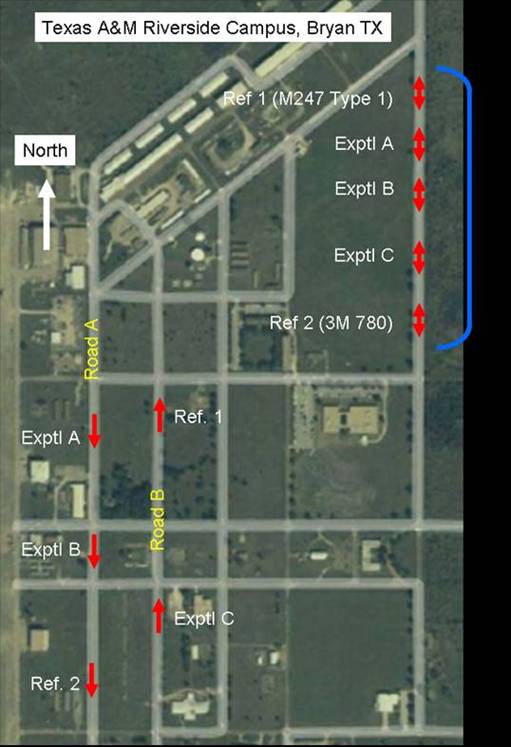
Figure 7. Map of test marking locations within the Texas A&M Riverside Campus
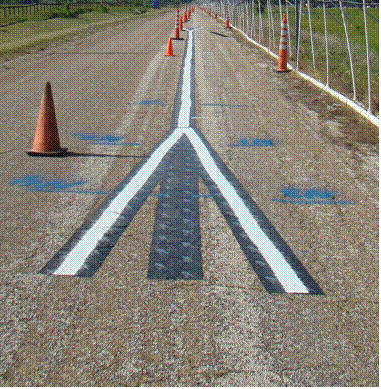
Figure 8. Experimental pavement marking applied to black polymer film to allow easy removal of the test markings after completion of the Task 2 experiment
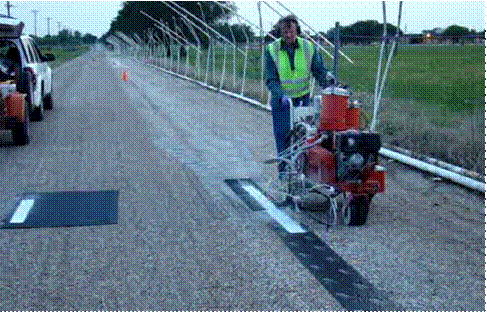
Figure 9. EZ Liner walk behind application cart used to apply painted lines
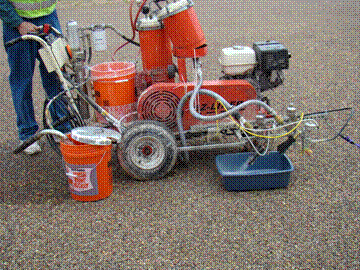

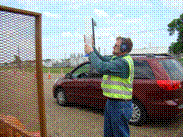
Figure 10. Calibration of Element and Glass bead application rates
Standard coefficient of retroreflected luminance (RL) measurements were conducted on the test markings at each location shortly after they were installed. Similar measurements are to be repeated periodically over the course of the experiment to account for any changes due to wear or other factors. Measurements of RL under rain and wet conditions were also conducted on the markings installed within the rain range. Finally, a set of nighttime luminance measurements on the experimental markings in the rain range were conducted as viewed from inside the test vehicle using a CCD photometer under dry and rain conditions. The analysis of that data will be reported on next quarter.
Meeting with TTI research team at College Station for the development of the detailed experimental plan
3M Research Team and the TTI research team met in College Station, TX on February 19th and 20th. The purpose of the meeting was to develop the detailed work plan for Task 2. The work plan was developed and sent to the FHWA AOTR.
Human Factors Pilot Study
A pilot human factors study was conducted following the installation of the pavement markings at the TTI Riverside Campus. The purpose of the pilot experiment was to identify:
- The timings, sequence, and lengths of each subtask during the experiment for the ground crew and experimenters
- The general visibility assessment of each test marking under rain
- Consistency of rain in the rain range
- Feasibility of using cones to simulate a work zone
- Any potential unforeseen issues
The general experimental setup and the pavement marking installations were found to be acceptable. Minor issues, such as slight variations in the pavement marking width in the stem sections of the markings were noticed, but the team had consensus on the minor variations as insignificant from the participant task point of view. It was also found that running each participant would take approximately one hour.
Planned Work for the Next Quarter
Within the next quarter, we have planned for the following tasks:
Task 2 and Task 3 had been completed.
Problems Encountered
No major problems were encountered during this quarter.