Asphalt Binder Cracking Device to Reduce Low-Temperature Asphalt Pavement Cracking
ASPHALT BINDER CRACKING DEVICE INTERLABORATORY STUDY
For the ABCD ILS, each laboratory received instructions and the ABCD test procedure to review before receiving the ABCD unit and binder samples. After a few practice tests, each laboratory performed 3 ABCD runs of 4 specimens each (a total of 12 specimens) on each of the 3 binder grades.
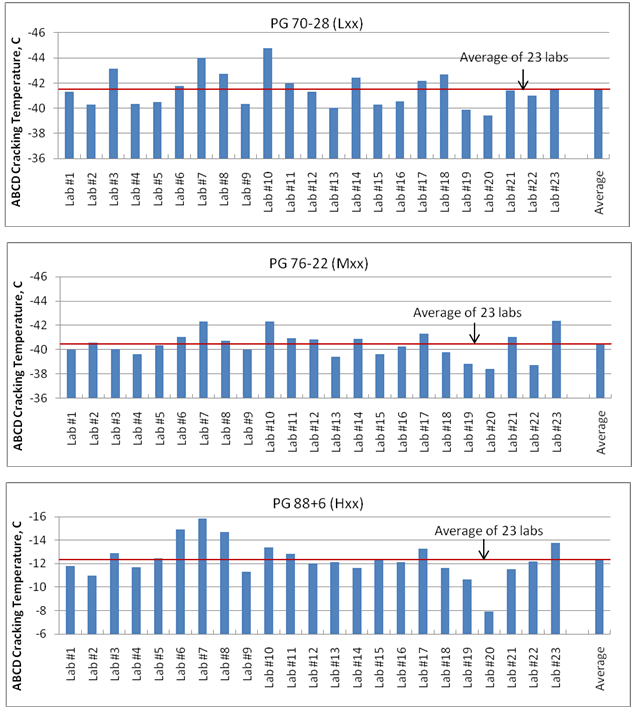
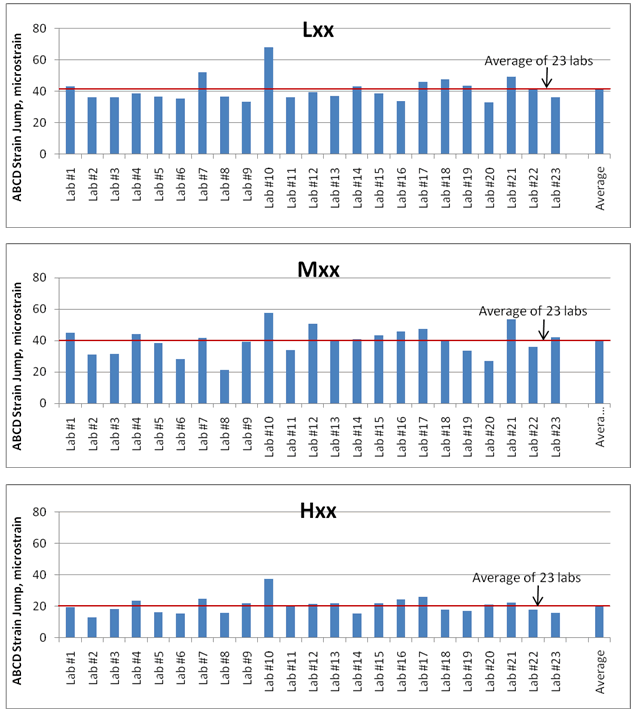
Average ABCD cracking temperature and strain jump for each binder and each laboratory are presented in tables 3 and 4 and figures 3 and 4. ABCD strain jump (e) at fracture may be converted into the fracture stress of the asphalt binder (σƒ) as follows:
σƒ = (K) ε•EABCD•AABCD/Abinder
where
- K = stress concentration factor, 2.02
- EABCD = Young’s modulus of ABCD ring, 140 GPa (20,305 ksi)
- AABCD = Cross-sectional area of ABCD ring, 22.6 x 10⁻⁶ m2 (27.0 x 10⁻⁶ yd2)
- Abinder = Cross-sectional area of asphalt binder, 40.3 x 10⁻⁶ m2 (48.2 x 10⁻⁶ yd2)
To use the ABCD for accurate strength measurement, each ring should be calibrated for load-strain relationship. The ABCD rings used in this ILS were not calibrated. The precision of ABCD strain jump results may be improved when calibrated ABCD rings are used. For easy comparison, the Y-axis scales of figures 3 and 4 are kept the same for all three binders.
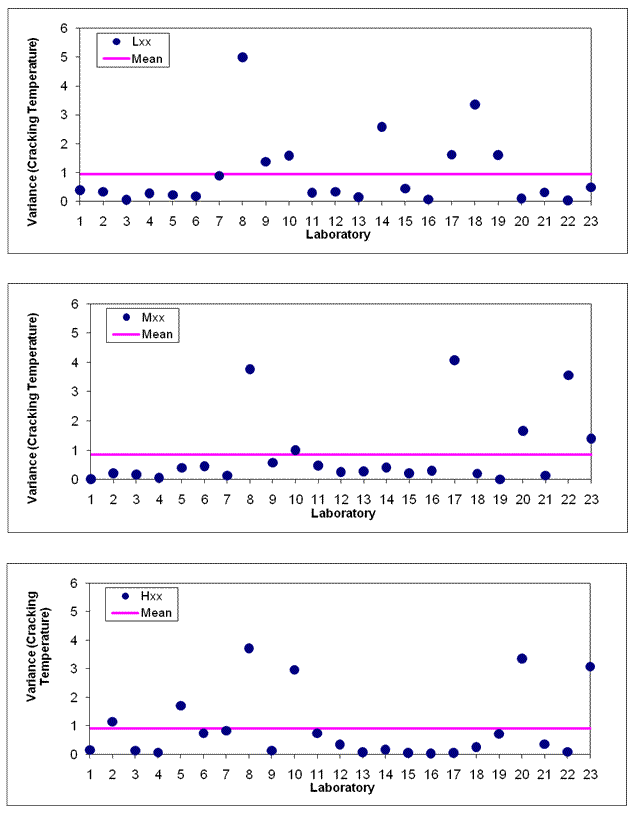
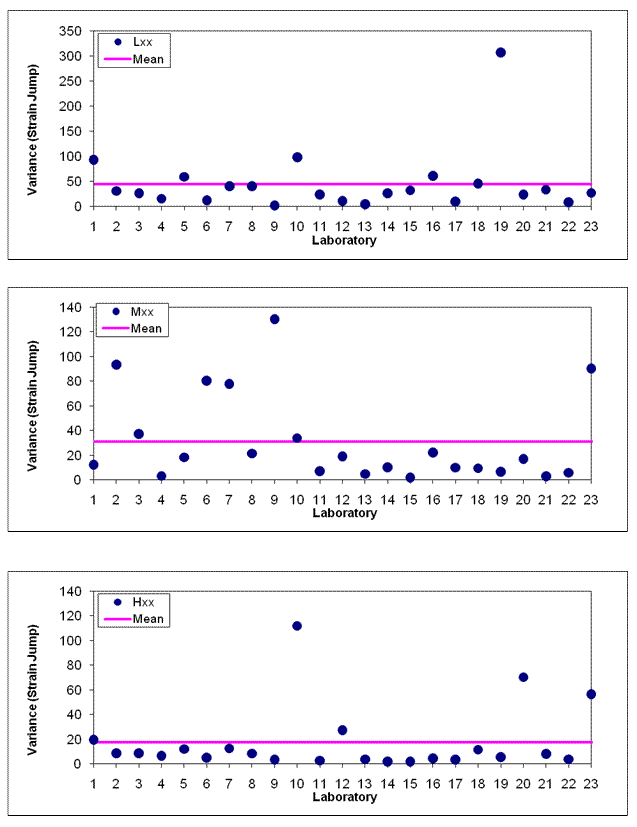
Before determining the precision of the test, ASTM C802 requires the operator to identify and remove erratic data by plotting variance versus lab, as shown in figures 5 and 6. Even though Lab 1 (EZ Asphalt laboratory) was the only laboratory with significant prior experience with ABCD testing, many labs produced lower variance for the ABCD test (meaning the results of three runs of one sample are similar). There are quite few noticeably large variance values. However, it is not clear if they are erratic data. Since the number of participating laboratories (23) was significantly larger than the recommended minimum (10), the effects of few data with the large variance values could be insignificant. Data analysis was performed without removing these data, and the precision estimates of ABCD test results would be conservative ones.
The statistical summary of the ABCD ILS results is presented in table 5. The ABCD cracking temperatures of three binders were significantly lower than the PG low-temperature grade since ABCD tests evaluated the low-temperature cracking potential of asphalt binder only. The addition of mineral aggregates in the asphalt binder would raise the cracking temperature. For all three binders, the within-lab variances of the ABCD cracking temperatures were similar and independent of the cracking temperature. The between-lab variance for the medium-stiffness binder is lowest (s2 = 1.19), followed by the low-stiffness binder (s2 = 1.87) and the high-stiffness binder (s2 = 2.58). The low-stiffness binder seemed to deform easily during the trimming, transportation, and handling steps, resulting in larger variances than the medium-stiffness binder. The high-stiffness binder was extremely stiff at room temperature, making trimming unusually difficult and contributing to the large between-lab variance.
Two SBS-modified binders (PG 70-28 and PG 76-22) exhibited much larger strain jump than the unmodified high-stiffness binder (PG 88+6). The fracture strengths of the low-, medium-, and high-stiffness binders were estimated to be 6.5 MPa (943 psi), 6.3 MPa (914 psi), and 3.3 MPa (479 psi), respectively. The within-lab and the between-lab variances of the strain jump seemed larger for the binders with a larger strain jump. The SBS-modified binders, which showed about twice-larger strain jump than the unmodified binder, also had twice or more within-lab and between-lab variances.
The precision estimates of ABCD tests are given in table 6. When a single operator runs the ABCD test twice on the same sample, the acceptable range of two test results should be less than 2.69 ºC (4.84 ºF), 15.50 με, and 2.43 MPa (352.4 psi), for the ABCD cracking temperature, strain jump, and fracture strength, respectively. When two different operators at two different laboratories perform ABCD tests on the same sample, the acceptable range of two test results should be less than 3.85 ºC (6.93 ºF), 20.39 με, and 3.20 MPa (464.1 psi) for the ABCD cracking temperature, strain jump, and fracture strength, respectively.
| Lab No. | Cracking Temp (°C) | |||||
|---|---|---|---|---|---|---|
| Average of 3 Runs | Standard Deviation (°C) | |||||
| PG70-28 (Lxx) |
PG76-22 (Mxx) |
PG88+6 (Hxx) |
PG70-28 (Lxx) |
PG76-22
(Mxx) |
PG88+6 (Hxx) |
|
| 1 | -41.3 | -40.0 | -11.8 | 0.7 | 1.2 | 0.8 |
| 2 | -40.3 | -40.6 | -11.0 | 1.6 | 1.6 | 2.7 |
| 3 | -43.1 | -40.1 | -12.9 | 1.6 | 1.7 | 1.4 |
| 4 | -40.3 | -39.6 | -11.7 | 1.0 | 0.6 | 0.8 |
| 5 | -40.5 | -40.4 | -12.4 | 1.8 | 1.8 | 2.1 |
| 6 | -41.7 | -41.0 | -14.9 | 2.2 | 2.3 | 1.3 |
| 7 | -44.0 | -42.3 | -15.8 | 1.5 | 1.0 | 1.7 |
| 8 | -42.7 | -40.7 | -14.7 | 4.2 | 2.6 | 0.8 |
| 9 | -40.4 | -40.0 | -11.3 | 1.6 | 0.7 | 0.8 |
| 10 | -44.8 | -42.3 | -13.4 | 1.9 | 1.0 | 0.9 |
| 11 | -42.0 | -40.9 | -12.9 | 0.8 | 2.1 | 1.3 |
| 12 | -41.3 | -40.9 | -12.0 | 2.0 | 1.2 | 0.9 |
| 13 | -40.0 | -39.4 | -12.1 | 1.2 | 0.5 | 0.5 |
| 14 | -42.4 | -40.9 | -11.6 | 2.9 | 1.3 | 0.7 |
| 15 | -40.3 | -39.6 | -12.3 | 0.5 | 0.7 | 0.9 |
| 16 | -40.5 | -40.3 | -12.2 | 1.2 | 1.5 | 0.7 |
| 17 | -42.2 | -41.3 | -13.3 | 1.0 | 1.6 | 1.0 |
| 18 | -42.7 | -39.8 | -11.6 | 1.3 | 1.0 | 1.9 |
| 19 | -39.9 | -38.8 | -10.6 | 1.1 | 0.8 | 1.3 |
| 20 | -39.4 | -38.4 | -7.9 | 1.2 | 1.7 | 3.6 |
| 21 | -41.4 | -41.0 | -11.5 | 1.4 | 0.5 | 0.8 |
| 22 | -41.0 | -38.7 | -12.2 | 2.1 | 1.9 | 0.6 |
| 23 | -41.5 | -42.4 | -13.8 | 1.8 | 2.1 | 1.6 |
| Average | -41.5 | -40.4 | -12.3 | 1.6 | 1.4 | 1.3 |
| Lab No. | Strain Jump (με) | |||||
|---|---|---|---|---|---|---|
| Average of 3 Runs | Standard Deviation (με) | |||||
| PG70-28 (Lxx) |
PG76-22
(Mxx) |
PG88+6 (Hxx) |
PG70-28 (Lxx) |
PG76-22 (Mxx) |
PG88+6 (Hxx) |
|
| 1 | 42.9 | 45.0 | 19.6 | 8.5 | 11.7 | 2.5 |
| 2 | 36.1 | 31.2 | 13.1 | 9.5 | 8.4 | 6.5 |
| 3 | 36.4 | 31.6 | 18.2 | 13.7 | 10.5 | 6.5 |
| 4 | 38.8 | 44.1 | 23.5 | 6.6 | 4.5 | 3.3 |
| 5 | 36.4 | 38.4 | 16.4 | 6.6 | 10.1 | 6.2 |
| 6 | 35.5 | 28.1 | 15.6 | 12.2 | 15.8 | 7.7 |
| 7 | 52.3 | 41.6 | 24.7 | 12.7 | 13.6 | 5.1 |
| 8 | 36.7 | 21.5 | 16.1 | 20.6 | 8.9 | 3.7 |
| 9 | 33.3 | 39.4 | 22.0 | 4.7 | 10.0 | 4.7 |
| 10 | 68.0 | 57.6 | 37.4 | 17.9 | 33.9 | 11.6 |
| 11 | 36.1 | 33.9 | 21.0 | 6.9 | 10.4 | 4.3 |
| 12 | 39.6 | 50.6 | 21.5 | 11.9 | 7.5 | 5.0 |
| 13 | 37.0 | 39.9 | 22.2 | 4.5 | 2.7 | 2.2 |
| 14 | 43.2 | 41.1 | 15.3 | 20.3 | 7.6 | 2.2 |
| 15 | 38.7 | 43.2 | 21.9 | 4.0 | 3.7 | 3.6 |
| 16 | 33.9 | 45.8 | 24.3 | 18.2 | 16.3 | 6.1 |
| 17 | 46.0 | 47.6 | 26.1 | 4.9 | 6.8 | 3.3 |
| 18 | 47.6 | 39.5 | 18.1 | 6.1 | 7.6 | 5.2 |
| 19 | 43.7 | 33.5 | 16.9 | 21.3 | 6.8 | 4.9 |
| 20 | 32.8 | 26.9 | 21.3 | 16.2 | 10.5 | 14.9 |
| 21 | 49.1 | 53.5 | 22.4 | 5.6 | 4.0 | 4.3 |
| 22 | 42.0 | 36.0 | 17.7 | 5.1 | 7.0 | 1.9 |
| 23 | 36.4 | 42.0 | 16.0 | 14.4 | 16.5 | 5.4 |
| Average | 41.0 | 39.6 | 20.5 | 11.0 | 10.2 | 5.3 |

Figure 3. ABCD ILS Results: Average ABCD cracking temperatures.

Figure 4. ABCD ILS Results: Average strain jump.

Figure 5. ABCD ILS Results: Within-lab variance of ABCD cracking temperature.

Figure 6. ABCD ILS Results: Within-lab variance of strain jump.
| Cracking Temperature (°C) | Strain Jump (με) | |||||
|---|---|---|---|---|---|---|
| PG70-28 (Lxx) |
PG76-22 (Mxx) |
PG88+6 (Hxx) |
PG70-28 (Lxx) |
PG76-22 (Mxx) |
PG88+6 (Hxx) |
|
| Average | -41.5 | -40.4 | 12.3 | 41.0 | 39.6 | 20.5 |
| Minimum | -44.8 | -42.4 | -15.8 | 32.8 | 21.5 | 13.1 |
| Maximum | -39.4 | -38.4 | -7.9 | 68.0 | 57.6 | 37.4 |
| Within-lab variance | 0.94 | 0.86 | 0.91 | 45.0 | 31.1 | 17.3 |
| Minimum | 0.03 | 0.02 | 0.05 | 2.3 | 1.9 | 1.9 |
| Maximum | 5.00 | 3.77 | 3.71 | 98.4 | 130.5 | 112.0 |
| Between-lab variance | 1.87 | 1.19 | 2.58 | 62.4 | 75.1 | 25.7 |
| Condition | Standard Deviation (1S)a | Acceptable Range of Two Test Results (D2S)a |
|---|---|---|
| Single-operator precision: | ||
| Cracking temperature (°C) | 0.95 | 2.69 |
| Strain jump (µε) | 5.48 | 15.50 |
| Facture stress (MPa) | 0.86 | 2.43 |
| Multilaboratory precision: | ||
| Cracking temperature (°C) | 1.36 | 3.85 |
| Strain jump (µε) | 7.21 | 20.39 |
| Facture stress (MPa) | 1.13 | 3.20 |
aThese values represent the 1S and D2S limits described in ASTM Practice C 670.

