| FHWA > HPMS Field Manual > Appendix N: Procedures for Estimating Highway Capacity |
|
An update of the manual is available! - HPMS Field Manual
HPMS Field ManualAppendix N: Procedures for Estimating Highway CapacitySimplified Procedure For Rural Signalized Intersection Capacity And Urban Sections With Missing DataApplicationIn the coding of HPMS data, several data items required for applying the urban signalized capacity analysis are either "optional" or not required for rural sections. The data items of interest for capacity calculations, since they are used to identify lane groups, are:
ProcedureAlthough some states do code these items for rural sections, a provision must be made to handle cases where the data are not present; this could also be true for some urban sections. In the cases where rural signalized sections have nonzero values coded for these data items, the signalized intersection capacity is used. When these data are coded as zero, the following procedure is used:
where:
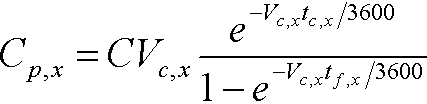
The g/C ratio default values given above attempt to account for, in a general way, the presence of exclusive turn lanes and phases. These values are higher than the default values listed in Table 9-3 of NCHRP 387 (0.40-0.45) but those values consider only through movement capacity. Stop Sign-Controlled Highway CapacityApplicationAll highways that have at least one stop sign and meet the density requirement (> .5/mile) on the inventory route. ProcedureThe HCM 2000 procedure for stop sign-controlled intersections is complex and highly dependent on turning movements on all the approaches. Procedures also vary for two-way controlled intersections versus all-way controlled intersections. None of these data are present in HPMS. Therefore, a highly simplified method is recommended. It is based on the HCM 2000 procedure for two-way controlled intersections. This is the simpler and less data intensive of the two methods. The procedure is based on first calculating the potential capacity for each turning movement. (It is assumed that the potential capacity is equal to the "movement capacity", and none of the HCM 2000 procedures for converting potential capacity to movement capacity are used.) Where shared lanes exist for turning movements, an extra calculation is required to derive the potential (movement) capacity of the shared lane. This step combines the potential capacities for two or three turning movements (depending on the lane configuration) into a single potential capacity. The final capacity of the stop sign-controlled approach is then the sum of all the potential capacities calculated for the turning movements. Step 1: Calculate Potential Capacity of Each Turning Movement The procedure starts with HCM Equation 17-3. It first calculates the potential capacity for each of the movements on the stop sign-controlled approach:
Where:
Table 11. Default Values for Calculating Potential Capacities
(Cp,x)
|
| Vehicle Movement (x) | Base Critical Gap, tc,base | Follow-up Time, tf,base |
|---|---|---|
| Right Turns | 6.2 | 3.3 |
| Through | 6.5 | 4.0 |
| Left Turns | 7.1 | 3.5 |
| Functional Class | Conflicting Flow Rate, CVc,x |
|---|---|
| Rural Principal Arterials | 100 |
| Rural Minor Arterials | 150 |
| Other Rural | 200 |
| Urban Principal Arterials | 250 |
| Urban Minor Arterials | 500 |
| Other Urban | 750 |
Clearly, the major assumption in this Step is that of the conflicting volumes. Basically, it is assumed that the intersection is composed of a higher class facility in one direction and a lower class facility in the other. Many stop sign-controlled intersections, particularly those with all-way control, are comprised of similar class facilities intersecting. However, without detailed knowledge of such occurrences, the assumption is a reasonable default.
Step 2: Determine Approach Capacity
Several adjustments to potential capacity are defined in the HCM 2000 in order to derive "movement capacity". Most of the adjustments are based on knowledge of turning movements on and the geometry of all approaches of the intersection. Since none of these data are available in HPMS, major assumptions would be required. As an alternative, the movement capacity is set equal to potential capacity for most cases, except for shared lanes. The adjustment for shared-lane capacity is essential for calculating intersection approach capacity. HCM Equation 17-15 is used in these cases:
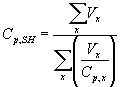
Where:
| Cp,SH | = | potential capacity of the shared lane (vph) |
| Vx | = | flow rate of the x movement in the shared lane (vph) |
| Cp,x | = | potential capacity of the x movement in the shared lane (vph) from Equation 1. |
Volumes for the turning movements on the intersection approach in question must be made in order to apply Equation 30. It is assumed that 10 percent of the approach volume is composed of left-turning vehicles and 10 percent composed of right turning vehicles (recommended defaults from Chapter 10 of HCM 2000). Total approach volume is calculated as:
| Approach Volume | = | AADT * (K * 0.01) * (D * 0.01) |
Where:
| AADT | = | Data Item 33 |
| K | = | Data Item 85 |
| D | = | Data Item 86 |
| = | MIN(70, Data Item 86) |
Values for Vx are then computed for left turns, through movements and right turns by applying the assumed turning percentages to the approach volume: 10%, 80%, and 10%, respectively.
The number of lanes handling turning movements on the approach are then determined. This is based on Data Items 88 and 89 (Left and Right Turning Lanes) for urban sections and for rural sections where these data are coded. Table 3 shows how to handle each of the possible cases. The approach capacity is based on Equation 30 for nonshared lanes and Equation 31 for shared lanes. In some cases both terms are used. Note that CA is adjusted to account for the number of lanes handling each movement. Where HPMS indicates "multiple" turning lanes, it is assumed that two such lanes exist. For rural sections - or for any sections where Data Items 88 and 89 are coded as zero - it is assumed that no exclusive left turn or right turn lanes exist.
| Left Turning Bay/Lanes Coding (Data Item 88) | Right Turning Bay/Lanes Coding (Data Item 89) | Approach Capacity Calculation, CA (vph) |
|---|---|---|
| 0, 4 | 0, 4 | All movements made from a shared lane; CA = NTCp,SH |
| 1, 2, 3 | Shared LT + T lane; exclusive RT lane; CA = NT C p,SH(LT+T) + NRTCp,RT |
|
| 5 | Do not consider right turn volumes; CA = NTC p,SH(LT+T) |
|
| 1, 2, 3 | 0, 4 | Shared RT + T lane; exclusive LT lane CA = NTC p,SH(RT+T) + NLTCp,LT |
| 1, 2, 3 | Exclusive lanes for all movements; CA = NLTCp,LT + NTCp,T + NRTCp,RT |
|
| 5 | Do not consider right turn volumes; CA = NLTCp,LT + NTCp,T |
|
| 5 | 0, 4 | Do not consider left turn volumes CA = NTC p,SH(RT+T) |
| 1, 2, 3 | Do not consider left turn volumes CA = NTCp,T + NRTCp,RT |
|
| 5 | Consider only through volumes CA = NTCp,T |
Where:
| NT | = | Number of Peak Through Lanes |
| = | 1 for rural highways with 2 through lanes | |
| = | 2 for rural highways with 3 through lanes | |
| = | Data Item 87 otherwise | |
| NLT | = | Number of Left Turn Lanes |
| = | 2 if Data Item 88 = 1 | |
| = | 1 if Data Item 88 = (2,3) | |
| = | 0 otherwise | |
| NRT | = | Number of Right Turn Lanes |
| = | 2 if Data Item 89 = 1 | |
| = | 1 if Data Item 89 = (2,3) | |
| = | 0 otherwise | |
| Cp,SH | = | potential capacity of the shared lane (vph) from Equation 31 (the terms in parentheses indicate which movements are being handled by the shared lane, e.g., "LT+T" means that left turns and through movements share the lanes |
| Cp,T | = | potential capacity (assumed to be the movement capacity from Equation 30) for the through movement |
| Cp,RT | = | potential capacity (assumed to be the movement capacity from Equation 30) for the right turn movement |
| Cp,LT | = | potential capacity (assumed to be the movement capacity from Equation 30) for the left turn movement |
Step 3: Set Peak Capacity to Approach Capacity
For HPMS, the Peak Capacity of the section is then based on the approach capacity of the stop sign-controlled intersection analyzed above. For urban sections, since the HPMS definition of urban capacity is one-way, the Peak Capacity is set equal to the approach capacity. For rural sections, it is based on the total number of through lanes (Data Item 34). This is done to account for the definition of capacity for 2- and 3-lane sections in HPMS, which is two-way capacity.
Rural 4+ through lanes
Peak Capacity = Approach Capacity
Rural 3-through lanes
Peak Capacity = Approach Capacity * 1.67 (assumes that the direction with two lanes is the inventory direction)
Rural 2-through lanes
Peak Capacity = Approach Capacity * 2
| << Previous | Contents | Next >> |