
On November 15, 2012, Travel Model Improvement Program (TMIP) sponsored a webinar highlighting San Francisco County Transportation Authority's (SFCTA) experience developing and applying their activity-based model. The webinar was titled "SFCTA Experience Using Activity-Based Models."
The webinar session was presented by Elizabeth Sall (Deputy Director for Technology Services, SFCTA). It provided a behind-the-scenes look at what it is like to be a modeler at SFCTA where they have been using and improving their SF-CHAMP activity-based model for the past decade. The webinar presented answers to some very practical questions related to using and maintaining a fully functional activity-based model such as:
A total of ninety-two (92) individuals and agencies (some with more than one participant) from academia, private consulting firms, local, state and federal governments attended the webinar. A majority of these participants worked for large MPOs (>1 million population), state governments or private sector consulting firms.
In a post-webinar evaluation, more than 90% of the respondents agreed that the webinar was relevant to their day-to-day jobs and that the format of the webinar was just right as is. None of the participants experienced any major technical problems with the audio or video quality or service. As part of the open comments, a few attendees suggested that more MPOs or government agencies should present on how they are using advanced modeling techniques (such as activity-based models) in guiding their policy decisions.
The following sections provide a detailed evaluation of the TMIP webinar on SFCTA's Experience Using Activity-Based Models.
This webinar was promoted via an email message sent to the individuals and institutions who have signed up to receive TMIP news and updates (approximately 2000 subscribers). The promotional email was sent using GovDelivery, FHWA's news and email delivery service, on November 8th, 2012. The webinar announcement distributed via email can be found in Appendix B.
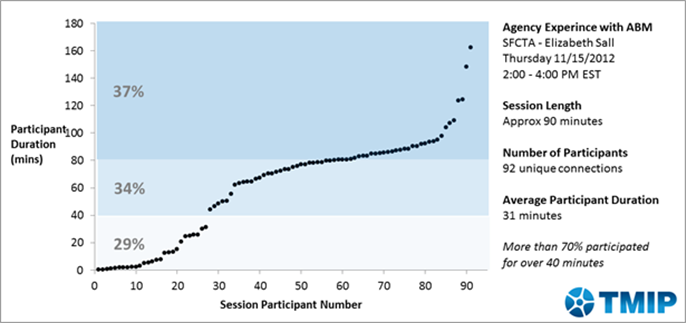
Of the 92 unique attendees (meeting connections), 37% attended the webinar from start to finish (approximately 90 minutes). Figure 10 presents a temporal profile of all the webinar participants.
Figure 10: Temporal Profile of SFCTA Agency Experience with ABM Webinar Participation
During the webinar, attendees were encouraged to submit questions via the meeting room chat pod. Six (6) questions on the content of the presentations were asked in the chat. These questions are as follows:
These questions were answered once the presentation by Ms. Sall was complete.
Five (5) polling questions were administered as part of the webinar. The first question regarding the number of participants at each location was administered prior to the start and again at the end of the presentation. This was done to capture any additional participants that might have joined in during the course of the webinar. The remaining four questions were answered at the end of the presentation. The results of these questions are listed below.
Question 1
How many participants are there at your location?
Table 14: SFCTA Agency Experience with ABM Evaluation Poll Question - Number of Participants
| Response Options | Response | Weight | Percentage |
|---|---|---|---|
| 1 (just me) | 44 | 1 | 90% |
| 2 | 2 | 2 | 4% |
| 3 | 1 | 3 | 2% |
| 4 | 2 | 4 | 4% |
| 5 | 0 | 5 | 0% |
| 6 | 0 | 6 | 0% |
| 7 to 20 | 0 | 13 | 0% |
| Total | 49 | - | 100% |
The response to this question was used to assign a weight to all of the other responses provided by the attendees except the final question. The final question inquired about the role of the attendee himself/herself or the head of the group that was attending at the organization to which s/he (they) belonged and thus did not need to be weighted.
Question 2
How relevant was this webinar to your day-to-day job?
Table 15: SFCTA Agency Experience with ABM Evaluation Poll Question - Webinar Relevancy
| Response Options | Response | Percentage |
|---|---|---|
| Very | 67 | 58% |
| Somewhat | 47 | 41% |
| Not Very | 2 | 2% |
| Total | 116 | 100% |
A majority of the respondents found the webinar to be very useful at their current job.
Question 3
What changes would you like to see in the format?
Table 16: SFCTA Agency Experience with ABM Evaluation Poll Question - Webinar Format
| Response Options | Response | Percentage |
|---|---|---|
| More Time for Questions and Answers | 2 | 2% |
| More Presentation Time | 7 | 6% |
| Just About Right As Is | 105 | 92% |
| Total | 114 | 100% |
A vast majority of the participants agreed that the webinar format does not need to be changed in any way.
Question 4
What type of organization do you work for?
Figure 11: SFCTA Agency Experience with ABM Evaluation Poll Question-Type of Organization
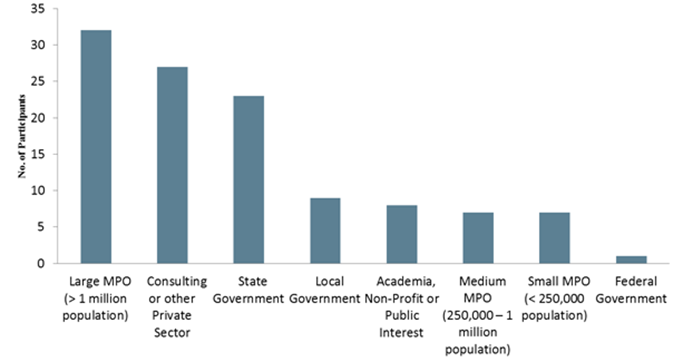
As stated earlier, a majority of the attendees of this webinar were from large MPOs, state government, or private sector consulting firms.
Question 5
Which of the following best describes you?
Table 17: SFCTA Agency Experience with ABM Evaluation Poll Question - Role at Organization
| Response Options | Response | Percentage |
|---|---|---|
| I apply and maintain travel demand models (hands on involvement) | 55 | 57% |
| I manage a group primarily responsible for model applications and maintenance | 9 | 9% |
| I manage/direct a group in which travel modeling is one of multiple technical services | 9 | 9% |
| I'm an executive director of an agency | 0 | 0% |
| I'm a model developer (design, estimate/calibrate, test) | 7 | 7% |
| I'm a developer of application software to support travel models | 4 | 4% |
| I manage a model development group or practice | 13 | 13% |
| I conduct or oversee research related to travel modeling | 0 | 0% |
| Total | 97 | 100% |
Participant response to the webinar was generally very positive. As indicated by the unedited comments below, the participants hoped that more MPOs and government agencies would continue to present these policy and procedural overview and other advanced modeling (especially activity-based modeling) webinars. Some of the other primary recommendations from the participants were:

