
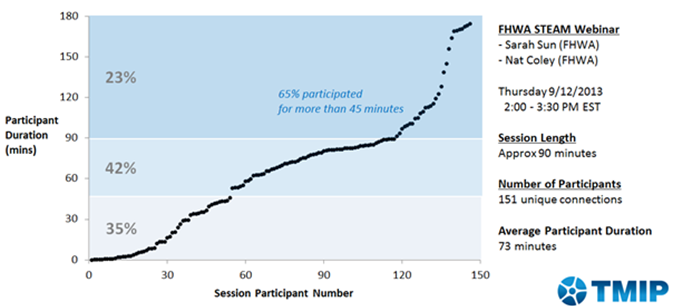
In addition to the estimated participants, we also measure the quality of the presentation and the relevancy of the webinar topic to participants' work or interests using the "connection" duration[7]. The following figures illustrate the participants and participant or "connection" durations throughout the webinars. The figures show that most of the participants stayed for most of the sessions.
Figure 14: Temporal Profile of Participation in the Agency Experience with ABM Webinar-ARC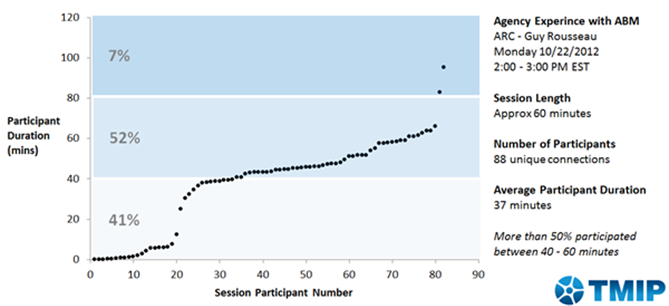
Figure 15: Temporal Profile of Participation in the TMIP Feedback Webinar
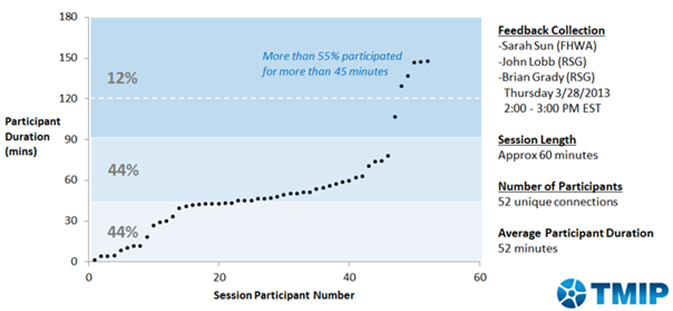
Figure 16: Temporal Profile of Participation in the Agency Experience with ABM Webinar-ODOT/MORPC
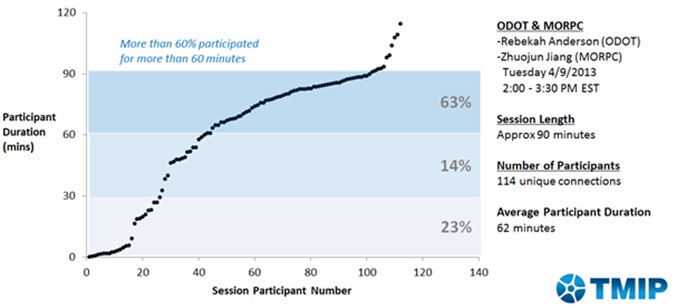
Figure 17: Temporal Profile of Participation in the Advanced Analytical Practices Webinar-NCTCOG
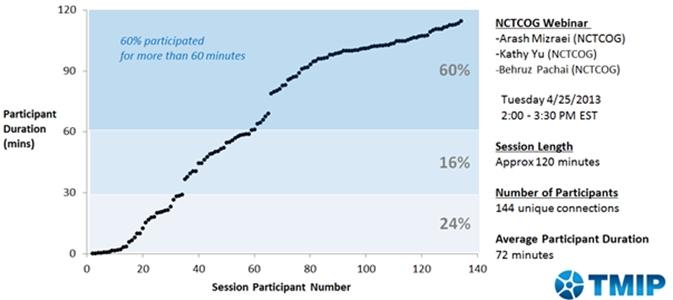
Figure 18: Temporal Profile of Participation in the Agency Experience with ABM Webinar-MTC
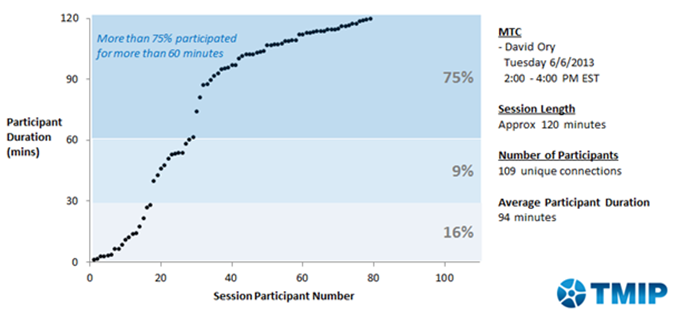
Figure 19: Temporal Profile of Participation in the Agency Experience with ABM Webinar-HGAC
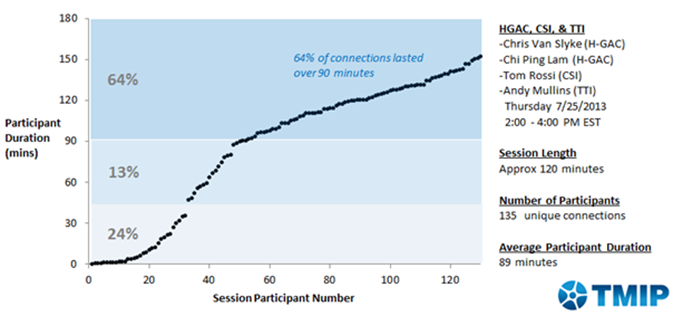
Figure 20: Temporal Profile of Participation in the Model Roles in Transportation Investment Webinar-FHWA
NOTICE |
This document is disseminated under the sponsorship of the U.S. Department of Transportation in the interest of information exchange. The United State Government assumes no liability for its contents or use thereof. The United States Government does not endorse manufacturers or products. Trade names appear in the document only because they are essential to the content of the report. The opinions expressed in this report belong to the authors and do not constitute an endorsement or recommendation by FHWA. This report is being distributed through the Travel Model Improvement Program (TMIP). |
[7] Unique connections measures the number of times the meeting URL is accessed. We use this metric when developing the profile showing participant duration. For example, if Adobe shows us that there were 110 unique connections, the number is somewhat misleading since the same person may be connecting multiple times. In any one session, the maximum number of connections is 100. The multiple times connections may also partially explain why some of the connections have very short "connection" durations.

