
The following text summarizes the current version of the NYBPM at the time of the review, along with data sources used in the development of the model.
NYMTC Model Components
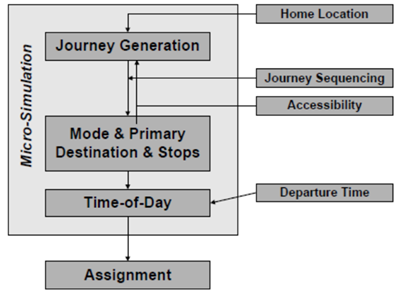
The following sections summarize models components as described in the final report of the NYBPM (2005). The model is made up of four primary modules that are shown in Figure 1:
The first three modules are implemented as fully-disaggregate micro-simulation procedures working with individual records for the synthesized population (i.e., households, persons, journeys). The last module is currently implemented on a standard aggregate (i.e., zone-to-zone) basis, using assignment algorithms built into TransCAD.
Figure 1: General modeling structure of NYBPM (Source: Final Report on NYBPM, 2005)
Household, Auto-Ownership and Journey-Frequency (HAJ) Model
The Household, Auto-Ownership and Journey-Frequency (HAJ) Model in the BPM replaces the traditional trip generation model. It first involves generating a list of households with necessary socio-economic attributes (income, size, number of children, number of workers) using zonal level aggregate totals and seed distributions observed in the Census Public Use Micro-Sample (PUMS). In the second step, auto ownership for each household is determined using a discrete choice model based on socio-demographics of the household and the residential urban environment. A multinomial logit model with four alternatives (0, 1, 2, 3+ cars) was estimated using the household survey data.
The last component in the HAJ model is the Journey-Frequency model. The NYBPM generates "journeys" instead of trips that are produced in a traditional model. A journey, defined as travel between principal locations, identifies anchor points in an individual's travel pattern, such as home, work or school. Thus, a journey could have intermediate stops apart from the primary destination. A pair of symmetric journeys (outbound and return) forms a tour. There are 13 journey-frequency multinomial logit models (MNL) estimated based on person type (worker, non-worker and child) and journey purpose (work, school, university, at work, maintenance and discretionary). Each MNL has three alternatives - no journeys, one paired journey, two or more paired journeys. A logical sequence for running all the models has been developed. Explanatory variables include both journey frequencies generated in prior models for the same person and those of other members in the household to incorporate space-time constraints and intra-household interactions.
Mode Destination Stop Choice (MDSC) Model
This model replaces the traditional trip distribution and mode choice model. Based on the person and household characteristics, and land-use densities around the journey origin, this model predicts which modes of travel each person chooses, where the person goes and if the person stops along the way on the journey. If a person does make a stop on his/her way to work or school or university, this model will predict the location of the stop.
The MDSC model starts with pre-mode choice where each journey is assigned to either motorized or non-motorized mode of travel, modeled by a binary logit choice structure. The model has been calibrated for six journey purposes. If a non-motorized mode is chosen, an MNL model for non-motorized destination choice is run. The choices are all the individual attractions in a 3-mile radius of the journey origin. There is only one non-motorized mode modeled - walk.
For motorized pre-mode choices, destination and mode choice models for the whole journey (without intermediate stops) are run first. The destination-choice model (motorized) has been calibrated by eight purposes (six original purposes with additional subdivision of journeys to work by three income categories). There is a zonal attraction-size variable that is reduced after each individual destination choice simulation. The mode-choice model has been calibrated by six purposes as a nested logit construct with differential nesting depending on the purpose. In most cases drive-alone and taxi modes proved to be in separate nests while transit and shared-ride mode were nested in different combinations. There are ten motorized modes considered.
Intermediate stops on journeys are modeled as two linked choice models of stop-frequency and stop-location. Stop-frequency model was developed and calibrated for six purposes as a multinomial logit model with the following alternatives:
Stop-location choice model is a multinomial logit construct. A bone-shape envelope that is a combination of the ellipsoidal and double-circle shapes was used to define the choice set with a goal to cover at least 95% of the observed cases from the HIS estimation data. The composite logsum from the stop-location model is used in the upper-level stop-frequency model to allow stop-making patterns as a function the density of opportunities present along the route.
Time-of-Day and Pre-Assignment Processor
The current version of the NYBPM has a simplified timing model based on a set of predetermined look-up tables (often referred as peak/off-peak factors) with percentage of journeys by time periods. The look-up tables are stratified by journey purpose, leg, mode, and some aggregate spatial categories. Time of day choices were aggregated by four broad time of day periods for which assignment procedures are implemented:
It was assumed that the entire outbound or inbound leg belongs to the same broad time-of-day period since this was violated across the observed journeys in the household survey for less than 2% of the cases. Hence, all the trips in a particular leg are assigned the same arrival time period.
In the pre-assignment processor, the journeys generated along with the time-of-day tables are further processed to produce a set of time period specific zone-to-zone aggregate demand flow matrices. The purpose of this modeling stage is to prepare the time-of-day period specific trip tables for highway and transit assignments implemented in TransCAD. This model system component is applied after the core set of choice models described above that includes choice of destination, mode, stop frequency, and stop location for each journey. At this stage, journeys are broken into trips and trip tables are prepared for highway and transit assignments by time-of-day periods.
In addition, various additional traffic components not covered by the core travel model system and modeled by ancillary models (external trips, trucks, commercial vehicles) are added at this stage in order to create a full set of highway vehicle class tables. Additional traffic components (trucks, commercial vehicles, and external auto trips) are initially modeled in the form of aggregate daily trip tables. These trip tables are produced by ancillary models and have the following segments:
Highway Assignment
The last step in the application of the series of NYBPM choice models, results in a full set of about 25 million paired-journey records (in the 1996 base year), in production/attraction format, each record containing estimated household and personal attributes, chosen destination zone and mode of travel. These data are converted to aggregate "trip tables," or flow matrices in origin-destination format, with a time of travel estimated in the Pre-Processor for Assignment. TransCAD is then used for assignment of these trip tables, using a multi-class technique (TransCAD 4.0) for highway including SOV, HOV, Truck, and Other Commercial. The currently applied assignment procedure for highway modes is based on vehicle stratification by the following 6 classes:
The reason for the vehicle class stratification is that different vehicle classes have different volume-delay functions as well as different network prohibitions that are taken into account in the multi-class highway assignment procedure developed in TransCAD.
Transit Assignment
Transit trips were estimated for Drive-to-Commuter Rail, Walk-to-Commuter Rail, Drive-to-Other Transit (Bus and Subway), and Walk-to- Other Transit (Bus and Subway) for assignment. Assignment is performed using the origin-destination trip tables by time period and the TRANSCAD pathfinder assignment method. This assignment procedure separately assigns each transit sub-mode in the following order for all time periods:
After the completion of all four assignments, an automated procedure computes the total ridership on each route and between each stop. The ridership on each route is compared to the equivalent time period capacity and an adjusted in-vehicle time is computed. All sub-modes are reassigned using the pathfinder method again and the results are blended with those of the previous iteration using weights to produce new travel times. The assignments are repeated for a total of five iterations.
Commercial Travel
The commercial travel models of the NYBPM take into account two components of commercial travel - trucks (vehicles with at least 2 axles and 6 tires)and other commercial vehicles (delivery vehicles, sometimes also referred to as "vans. Due to resource constraints, an empirically oriented approach for modeling truck and other commercial traffic that would make maximum use vehicle class traffic count and origin-destination data in the region was used. The base year truck trip tables using the NYBPM Truck Flow Estimating Model (TFEM) developed as part of NYMTC TMDI project. The methodology to estimate the base year commercial van trip tables is identical to the trucks, except a smaller dataset was employed due to the limited availability of data sources.
External Travel (Autos)
The sub-model of the NYBPM for non-commercial travel is a set of procedures that forecast the number of private passenger vehicle trips, by purpose, between each pair of external stations, and between internal zones and external stations. There are two different model sets used for estimating auto vehicle external travel. The first model estimates external-internal trips (X-I). These trips are both external-internal and internal-external in direction. The second component estimates through or external-external trips (X-X). The external models generate estimates for 4 different trip purposes. They are home-based work (X-I), home-based other (X-I),
Non-home based (X-I) and through (X-X)
For external-internal trips (X-I), a forecast function estimates the volume of external-local weekday auto traffic, for a forecast year at each station first. Next, a function distributes trips between external stations and internal zones using procedures that were estimated based on data collected from the External Cordon Survey. The through trip component of the model is essentially a distribution model that allocates and balances the estimated through travel at each station with a corresponding points of entry into the model region.
Validation
The calibration target data for the NYBPM was largely taken from aggregate summaries and tabulations of the RT-HIS, weighted and expanded to represent aggregate totals for regional households. Other aggregate data sources included the 1990 Census files (STF3A and CTPP), and other socioeconomic, employment and land use data assembled. Modeled journey productions were matched by county and purpose to those observed in the expanded survey. Most counties obtained reasonable modeled work journey productions, with about a 10% deviation from observed data. The mode choice validation was done across several dimensions - region wide mode shares by purpose, absolute journeys by mode and mode shares for county origin and destination of journey. For validation of destination choice model, absolute number of journey attractions at destination county level and average journey length and journey length distribution by travel purpose were used. It was noted that further improvement of the NYMTC destination choice model performance may require breaking the broad maintenance category into several, more detailed and homogenous, travel purposes.
Finally, the highway screenline and transit count data were used to evaluate and validate the NYBPM in the final assignment stage of the model. Highway model volumes were compared to two basic sources of count data developed as part of the TMDI project - the Screenline database developed, and the MATRIX database of counts developed by NYSDOT State Route System in the New York counties of the model area. The assignment procedures for transit, however, unlike the highway assignment are for the AM 4 hour peak period only. assigned model AM peak period volumes are compared to the 1995 and 1997 transit counts available at the time from the Metropolitan Transportation Authority (MTA), along with the model volumes from the 2001 Version of the MTA's Long Range Forecasting model generally used for by the agency for transit studies and analysis. Full calibration of the NYBPM for AM peak period transit assignment would involve review and possible adjustment to the time-of-day factors that allocate daily transit trips to the morning peak period assigned, as well as detailed checking of the route system coding and assignment parameters. This level of calibration was not done for transit loadings as part of the Base Year 1996 model implementation.
The data for the current version of the NYBPM was first obtained in the initial phase of Transportation Models and Data Initiative (TDMI) in the mid and late 90's. The model base year (1996) has been updated twice since then to 2002 and 2005.This section contains a brief overview of the various data components used for developing and implementing the current model.
Household Survey
Household travel surveys are the primary source of data for developing models of travel demand. They contain information about various travel characteristics and socio-demographics, which are used as explanatory factors in models. The most recent household survey was collected for NYMTC in the year 1997-98, in partnership with the North Jersey Transportation Planning Authority (NJTPA) called the Regional Travel - Household Interview Survey (RT-HIS). The RT-HIS gathered responses from 27,369 people in 11,263 households in 28 counties of New York, New Jersey, and Connecticut. It was a diary type travel survey, in which detailed travel information for each member of participating households was collected during an entire travel day. The data was used for the estimation of disaggregate or individual-based estimation of travel behavior choice models that comprise the NYBPM travel forecasting system.
Demographic and Census Data
Socioeconomic, demographics and land use (SED) data are maintained and used at the NYBPM zonal level. The data consists of 15 zonal attributes of population, employment, and enrollment elements. Base year 1996 data were first generated by Urbanomics at Census Tract and Minor Civil Divisions levels and then Parsons Brinkerhoff allocated these to TAZs. As part of the TMDI project, the "2020 SED forecast series" developed a full set of zonal NYBPM SED variables for 2000, 2005, 2010, 2015 and 2020 horizon years.
Transit Counts
1995 and 1997 transit counts by service type and branch were available from the Metropolitan Transportation Authority (MTA), along with the model volumes from the 2001 Version of the MTA's Long Range Forecasting model generally used for by the agency for transit studies and analysis.
Traffic Volume Data
The NYBPM screenline volume database was developed as the principal source of observed traffic volume data for use in Base Year 1996 calibration and validation. It is comprised of 2,226 highway network link records, with estimated volume data by direction, by hour, for each link in the database. There is a 3-tiered system of screenlines where Tier 1 are county boundaries, Tier 2 define north-south / east-west lines that form intra-county quadrants, and Tier 3 lines form sub-quadrants within the Tier 2 quadrants. The data is collected a various sources such as traffic count data compiled from secondary sources, new Automatic Traffic Recorder (ATR) counts, and estimated traffic volumes for links with no count data.
Travel Time and Speed Data
The estimates of average travel speeds and times are maintained by Physical Link Types (PLT) and by Area Type. NYMTC conducted an extensive travel time survey, covering sixteen (16) weekday hours of operations, from 5 AM to 9 PM for estimating average speeds. The data collection effort focused on roadways functionally classified as principal arterial and above, to be consistent with NYBPM model in providing good estimates for links categorized as major arterials and above. A total of approximately 4,500 roadway segments, or the equivalent of approximately 2,400 travel time segments, were surveyed.
Truck Data
Truck trip tables created from vehicle classification counts data and the following OD surveys:
External Surveys
In 1998, NYMTC conducted an External Cordon Origin-Destination (O-D) survey to obtain information on external travel patterns for an average weekday. Only auto drivers from twelve locations within New York State were surveyed. The collected responses were used in the development of the Best Practice Model's external travel demand forecasting sub-model.
GIS Data
The highway and transit components of the NYBPM were developed and are maintained and applied with TransCAD, which features a Geographical Information System (GIS) framework that provides a realistic representation of the highway and transit route systems. The highway network consists of approximately 53,000 links and includes most minor arterial roadways and above roadway facilities. The link attributes include number of lanes, functional class, speed, parking restriction, and truck-usage. As inputs to the NYBPM core models, the networks are used to estimate travel times and distances between all parts of the regions (by TAZs), and then for assignment of models forecast travel demand flows (trip tables) to produce link level volumes flows by vehicle class (SOV, HOV, Taxi, Trucks, and Commercial Vans), as well as speeds reflecting volumes and capacities.
The transit network of NYBPM is based on information provided by the Metropolitan Transit Authority, New Jersey Transit and other transit operators in the region. The network has 100 NY city subway routes, 900 commuter rail routes, 2300 bus routes and 50 ferry routes as well as the sidewalk network in Manhattan. In addition, the transit network components also include station-to-station transfer databases, walk/drive links for rail and other transit connectivity, route coding and fare coding.
Other Data
A set of highway Origin-Destination surveys were compiled to obtain travel flow estimates at an aggregate level (district-to-district) and to validate the highway assignment for selected regional facilities:
NOTICE
This document is disseminated under the sponsorship of the U.S. Department of Transportation in the interest of information exchange.The United State Government assumes no liability for its contents or use thereof.
The United States Government does not endorse manufacturers or products. Trade names appear in the document only because they are essential to the content of the report.
The opinions expressed in this report belong to the authors and do not constitute an endorsement or recommendation by FHWA.
This report is being distributed through the Travel Model Improvement Program (TMIP).

