Chapter IV. Variables of Interest
In addition to the standard explanatory variables of travel behavior, we hypothesize that the travel of youth will be uniquely affected by four different factors—high youth unemployment rates, changes in household structure (in part related to high youth unemployment), increased use of information and communications technologies, and the adoption of state graduated driver’s licensing regulations. We discuss each of these factors below and present descriptive data for these variables from the three national travel surveys.
A. Unemployment Rates
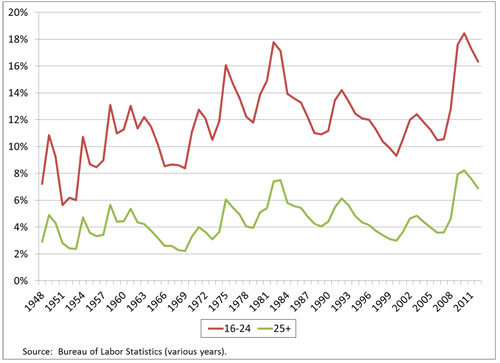
The recession that began in 2008 hit teens and young adults particularly hard. As Figure 4 shows, youth unemployment rates have always been higher than non-youth unemployment rates; however, the gap between the two has widened over time (U.S. Department of Labor, various years). In 2008, one in five young workers (16-24) was unemployed, almost three times the unemployment rate of older individuals (25+).
Figure 4: Unemployment Rates by Age Group (1948-2012)
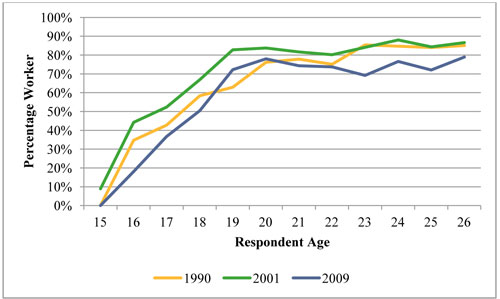
Similarly, data from the national travel surveys show that the share of youth employed dropped dramatically between 2001 and 2009, particularly for the youngest respondents in our sample. As Figure 5 shows, fewer than 20 percent of 16-year olds in 2009 had a job, while the figure was more than double that in 2001.
Figure 5: Percent Working By Age and Year (1990, 2001, and 2009)
High youth unemployment rates may well explain changes in the travel of youth. The current recession directly contributes to a decline in work travel and, consequently limits the resources that youth have available to travel for other purposes (such as shopping and recreation). The recession may also make it more difficult for youth to afford owning and operating automobiles thereby increasing their travel by alternative modes such as public transit and walking.
B. Household Structure
The downturn in the economy may also influence youth travel patterns through household structure. Studies show that young adults tend to live at home for their own benefit, particularly when they are young, unmarried, and have low-incomes (Di et al., 2002; Kreider, 2007; Messineao and Wojkiewicz, 2004). Further, as discussed above, young adults who face a difficult labor market often “boomerang” back to live with parents. Wiemers (2011) finds that individuals who become unemployed are twice as likely to move in with others, with young adults the most likely to move into shared living arrangements. Kaplan (2009) finds that youth (16-23) who do not attend college frequently move back home and that moves from employment to non-employment substantially increase the likelihood of moving home. Youth who live at home can take advantage of their parents’ resources including, perhaps, their automobiles.
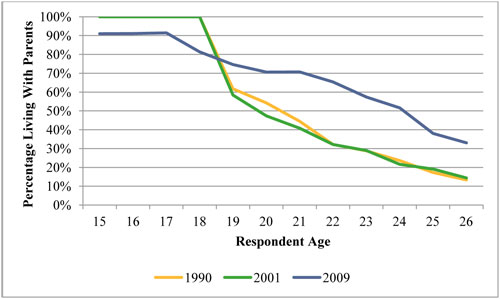
Figure 6 illustrates the dramatic increase (58%) in the proportion of young adults who live with their parents in 2009. Figure 7 illustrates the percentage of young people living at home by age for each of the three decades. The data indicate that a higher percentage of young adults lived with their parents in 2009 compared to previous survey years. In 1991 and 2001, there was a sharp decline in living with parents between the ages of 18 and 19. The decline is far more gradual in 2009 and it takes until age 23 to achieve the same percentage of youth living with parents than we observe for 19 year olds in the earlier decades. The graph also shows that in 2009 almost 10 percent of young teens (15-17) did not live at home with their parents.
Figure 6: Percent of Young People (19–26) Living At Home with Parents (1990, 2001, and 2009)
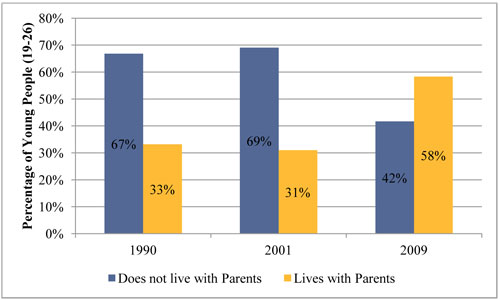
Figure 7: Percent of Youth Who Live at Home with Parents by Age and Year (1990, 2001, and 2009)
C. Use of Technology
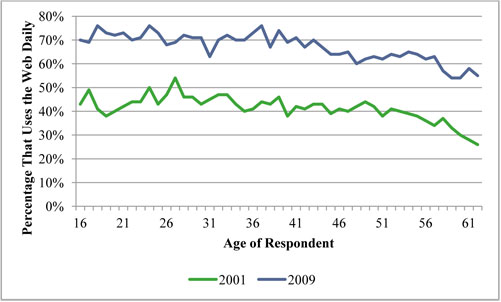
Youth tend to be early and frequent adopters of communication technologies (Mans et al., 2011; Lenhart et al., 2005; Pew Research Center, 2010b). Figure 8 shows the use of technology (daily web use) by age in 2001 and 2009. Even in this relatively short period of less than a decade, internet usage increased substantially across all ages. While web use is high among all ages, the data suggest that youth and young adults are slightly more likely to use the web daily compared to older adults.
Figure 8: Use of Technology by Age (2001 and 2009)
The rapid profusion and adoption of new communication technologies may influence how people use their time and, therefore, how much they travel (Kwan, 2002). The literature on information and communications technology (ICT) and travel among adults is inconclusive, although a majority of studies find that it is complementary to travel by potentially generating additional travel (Ferrell, 2004; Mokhtarian, 2000, 2002). Viswanathan and Goulias (2001) find high levels of person-to-person variance in the relationship between mobile technology and travel suggesting that individuals use technology in different ways; some individuals use technology to consolidate trips and others use it to reach activity opportunities that require longer travel times. Thus far, studies on this topic have not focused on youth in particular; therefore, the effect of ICT on youth travel behavior remains unknown.
D. Graduated Driver’s Licensing Regulations
Stringent licensing regimes may suppress travel if young people can no longer become drivers. On the other hand, it is possible that young people find alternative modes to meet their daily travel needs, such as getting a ride with a parent or older friend, using public transit, walking, or using a bicycle.
| Ranking | 1990 | 2000 | 2008 |
|---|---|---|---|
| License Stringency: Lowest | 42 | 13 | - |
| License Stringency: Low | 9 | 19 | 9 |
| License Stringency: Medium | - | 14 | 12 |
| License Stringency: High | - | 3 | 30 |
Table 9 presents the number of states in each ranking category in each year. As discussed above, we use licensing information for the year preceding our year of interest. Variation in licensing regulations by state was highest in 2000. In 1990, by contrast, the majority of states still had not begun to introduce graduated driver’s licensing regulations (GDL) and by 2008, most states achieved the highest ranking from the IIHS. The licensing regimes do not follow a strict urban-rural pattern. The states with the lowest ranking (Marginal) in 2008 were mostly rural states: Arkansas, Idaho, Kansas, Mississippi, Montana, New Mexico, North Dakota, North Carolina, and South Dakota. However, many other rural states also had the highest ranking in 2008, including West Virginia, Nevada, Oklahoma, and Utah.
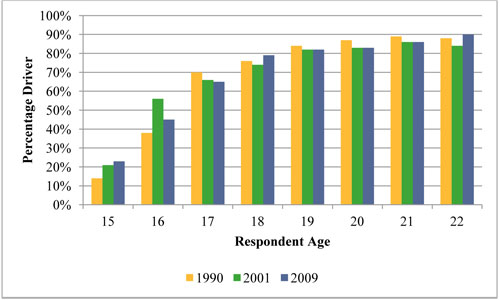
The data show that driver status varies by age and licensing stringency. We can see from Figure 9 that, compared to young adults, a smaller proportion of teens are drivers because many are not legally able to acquire a license. The data also show that 16-year-olds in 2009 were less likely to drive compared to 16-year-olds in 2001; however, they were more likely to drive compared to 16-year-olds in 1990, a period where there were relatively few regulatory restrictions on driving. Unfortunately, the 1990 survey did not ask 15-year-old respondents about their driver status and, therefore, we must rely on our best estimate of driver status, which, as we discuss in Chapter III, substantially underestimates the proportion of 15-year-old drivers.
Figure 9: Percent Drivers by Age, 15–22 (1990, 2001, and 2009)
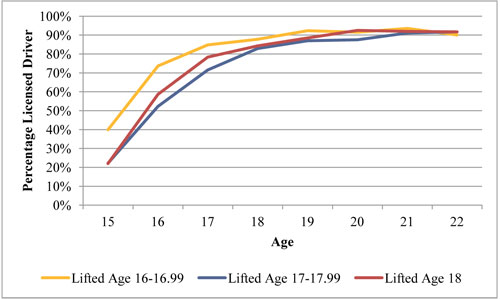
In Figure 10, we see there are fewer young drivers in states with tough licensing regulations, but by age 22, young people in states with the strictest licensing regulations are just as likely as young people in states with less strict regulations to have a license. This finding suggests that the introduction of more stringent licensing regulations has only a short-term effect on driver status.
Figure 10: Percent Youth with Drivers License by Age when License Restrictions are Lifted (2009)
Finally, Table 10 presents the proportion of people in each age group who are drivers disaggregated by license regulations ranking. For teens, more stringent driver’s license regulations are, in general, associated with a lower proportion of respondents who are drivers in all three years. This finding conforms to expectations because we might expect stricter standards to act as a barrier to driver status or as an incentive to delay licensing. Contrary to expectations, however, the relationship between license stringency and proportion of drivers also materializes, albeit to a lesser extent, for adults and young adults in some years. Yet we do not expect graduated licensing regulations to affect the licensing decisions of young adults or adults.
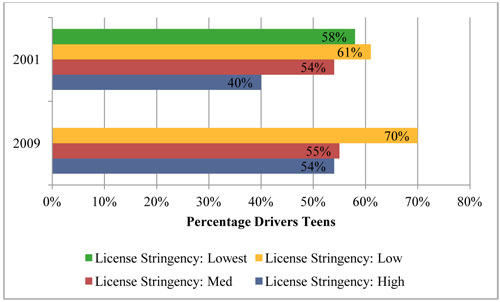
In Figure 11, we can more clearly see how the proportion of drivers has changed over time within each age group. Again, we caution the reader regarding the interpretation of the proportion of young drivers in 1990 because the measure is undoubtedly an underestimate.13 For this reason, we restrict our comparison of teen drivers to 2001 and 2009 where we see an increase in the proportion of teen drivers within each licensing regime over time.
| 1990 | 2001 | 2009 | |
|---|---|---|---|
| Teen (15–18) | |||
| License Stringency: Lowest | 59% | 58% | |
| License Stringency: Low | 41% | 61% | 70% |
| License Stringency: Med | 54% | 55% | |
| License Stringency: High | 40% | 54% | |
| Difference (lowest observed-highest observed) |
18 | 18 | 16 |
| Young Adult (19–26) | |||
| License Stringency: Lowest | 92% | 91% | |
| License Stringency: Low | 82% | 93% | 83% |
| License Stringency: Med | 85% | 86% | |
| License Stringency: High | 85% | 87% | |
| Difference (lowest observed-highest observed) |
10 | 6 | -4 |
| Adult (27–61) | |||
| License Stringency: Lowest | 95% | 96% | |
| License Stringency: Low | 91% | 96% | 94% |
| License Stringency: Med | 94% | 94% | |
| License Stringency: High | 93% | 93% | |
| Difference (lowest observed-highest observed) |
4 | 3 | 1 |
Figure 11: Percent Drivers by Licensing Regime and Year, Teens 15–18 (2001 and 2009)