U.S. Department of Transportation
Federal Highway Administration
1200 New Jersey Avenue, SE
Washington, DC 20590
202-366-4000


Skip to content
Facebook iconYouTube iconTwitter iconFlickr iconLinkedInInstagram

Federal Highway Administration Research and Technology
Coordinating, Developing, and Delivering Highway Transportation Innovations

 
ARTICLE
Back to Publication List        


Safety Training and Analysis Center

RID Data PDF and Table

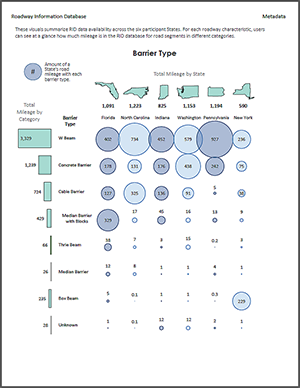
Barrier Type

Click on this image for the PDF.
Barrier Type PDF Cover Image

The following table includes the Barrier Type data in accessible format that is housed above in the PDF format.

Barrier
Types
Florida Indiana Pennsylvania North
Carolina
New
York
Washington
  Counts Mileage Counts Mileage Count Mileage Counts Mileage Counts Mileage Counts Mileage
Unknown 19 0.62 217 12.11 21 2.46 2 0.09 20 0.65 113 11.76
Cable Barrier 251 127.24 201 136.46 14 5.01 1,173 325.23 284 38.41 185 91.43
Concrete Barrier 1,419 178.02 844 176.07 1,020 241.59 756 131.33 566 74.85 1,880 437.62
Median Barrier 42 11.82 7 0.73 7 3.73 85 7.65 10 0.87 1 1.35
Median Barrier WITH Blocks 647 328.59 1,415 44.79 179 13.45 117 17.50 64 8.93 106 15.55
Thrie Beam 272 37.54 76 3.19 13 0.22 146 6.75 43 2.52 465 15.34
W Beam 4,441 401.73 6,782 451.64 8,390 927.26 6,990 734.28 2,484 235.51 6,135 579.07
Box Beam 26 4.99 12 0.63 6 0.27 4 0.15 4,573 228.69 21 0.51
Total 7,117 1,090.55 9,554 825.61 9,650 1,194.00 9,273 1,222.98 8,044 590.43 8,906 1,152.63


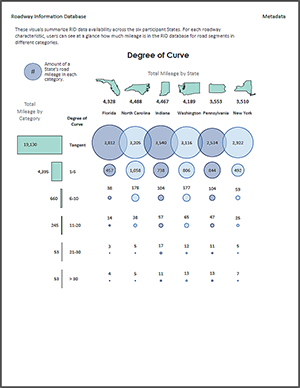
Degree of Curve

Click on this image for the PDF.
Degree Curve PDF Cover Image

The following table includes the Degree of Curve data in accessible format that is housed above in the PDF format.

Degree of Curve Florida Indiana Pennsylvania North
Carolina
New
York
Washington
  Counts Mileage Counts Mileage Counts Mileage Counts Mileage Counts Mileage Counts Mileage
Tangent 13,363 3,812.43 15,792 3,540.22 15,617 2,534.00 19,416 3,204.59 13,863 2,922.30 19,047 3,116.11
1 - 5 2,202 456.67 3,923 737.88 4,969 844.23 6,674 1,057.81 2,973 492.00 4,768 806.26
6 - 10 450 37.54 1,209 103.91 1,360 104.12 1,849 178.05 749 59.47 2,025 176.82
11 - 20 262 13.82 957 56.95 853 46.83 616 37.75 458 24.86 1,226 65.12
21 - 30 111 3.47 427 17.23 262 11.10 145 5.15 146 4.85 369 11.69
> 30 309 4.43 476 10.89 594 13.16 309 4.89 476 6.54 852 13.33
Total 16,697 4,328.35 22,784 4,467.08 23,655 3,553.45 29,009 4,488.24 18,665 3,510.02 28,287 4,189.33


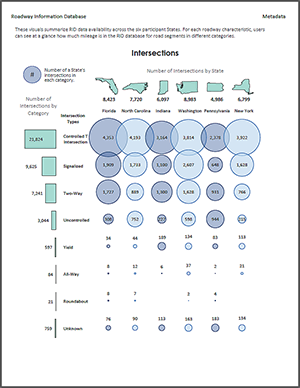
Intersections

Click on this image for the PDF.
Intersections PDF Cover Image

The following table includes the Intersections data in accessible format that is housed above in the PDF format.

Intersection Control Type Florida Indiana Pennsylvania North Carolina New York Washington
  Counts Counts Counts Counts Counts Counts
Unknown 76 113 183 90 134 163
Controlled T Intersection 4,353 3,164 2,378 4,193 3,922 3,814
Signalized 1,909 1,100 648 1,733 1,628 2,607
Two-Way 1,727 1,300 931 889 766 1,628
Uncontrolled 308 227 944 752 215 598
Yield 8 0 4 7 0 2
All-Way 34 189 83 44 113 134
Roundabout 8 4 2 12 21 37
Total 8,423 6,097 5,173 7,720 6,799 8,983


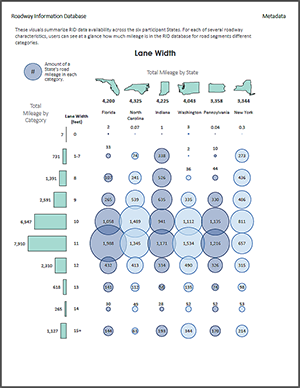
Lane Width

Click on this image for the PDF.
Lane Width PDF Cover Image

The following table includes the Lane Width data in accessible format that is housed above in the PDF format.

Lane Width Florida Indiana Pennsylvania North
Carolina
New
York
Washington
  Counts Mileage Counts Mileage Counts Mileage Counts Mileage Counts Mileage Counts Mileage
0 154 2 67 1 2 0 5 0 21 0 340 3
1-7 418 33 1,488 338 57 10 475 74 1,379 273 39 2
8 1,336 107 2,540 526 198 44 1,355 241 2,061 436 471 36
9 3,483 265 3,180 635 1,101 330 3,311 539 2,335 486 3,754 335
10 10,653 1,058 4,289 941 4,150 1,135 9,506 1,489 3,299 811 10,837 1,112
11 17,308 1,988 4,333 1,171 4,767 1,216 8,728 1,345 2,771 657 8,712 1,534
12 3,647 432 1,517 334 1,867 326 3,548 413 1,548 315 3,390 490
13 1,442 141 759 58 983 74 1,504 112 1,037 98 1,489 135
14 540 30 701 28 855 52 666 49 877 53 963 52
15+ 4,237 144 6,219 193 4,395 170 1,606 63 5,753 214 10,091 344
Total 43,218 4,200 25,093 4,225 18,375 3,358 30,704 4,325 21,081 3,344 29,995 3,699


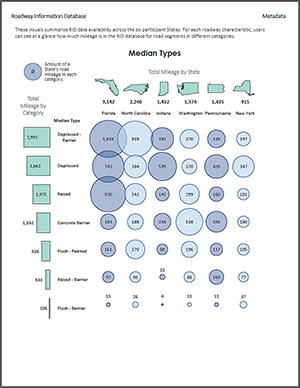
Median Types

Click on this image for the PDF.
Median Types PDF Cover Image

The following table includes the Median Types data in accessible format that is housed above in the PDF format.

Median Types Florida Indiana Pennsylvania North
Carolina
New
York
Washington
  Counts Mileage Counts Mileage Count Mileage Counts Mileage Counts Mileage Counts Mileage
Concrete Barrier 624 183.02 399 215.65 570 326.42 253 188.16 127 100.43 683 538.33
Depressed - with Barrier 1,767 1,015.65 1,055 381.34 1,711 237.93 1,537 939.36 810 146.73 774 270.08
Depressed (Lower than Road) 3,885 742.73 2,138 598.87 1,550 420.43 1,963 384.11 1,171 346.63 609 169.55
Flush - with Barrier 168 12.61 39 4.04 122 13.21 114 26.42 102 36.86 113 13.15
Flush (Painted) 4,284 160.91 2,721 88.35 2,067 117.26 5,453 269.68 2,926 104.91 5,623 196.50
Raised 11,491 929.79 1,727 141.84 1,721 159.63 3,283 342.45 765 102.46 4,284 298.62
Raised - with Barrier 695 96.84 182 22.21 959 159.67 444 89.69 476 76.64 577 87.70
Total 22,914 3,141.56 8,261 1,452.30 8,700 1,434.54 13,047 2,239.87 6,377 914.65 12,663 1,573.93


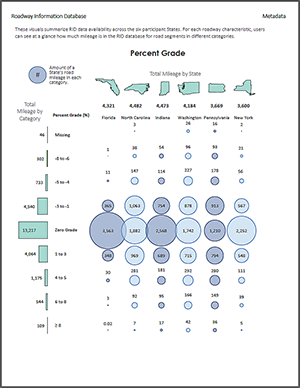
Percent Grade

Click on this image for the PDF.
Percent Grade PDF Cover Image

The following table includes the Percent Grade data in accessible format that is housed above in the PDF format.

Percent
Grade
Florida Indiana Pennsylvania North
Carolina
New
York
Washington
  Counts Mileage Counts Mileage Counts Mileage Counts Mileage Counts Mileage Counts Mileage
Missing 0 0.00 0 0.00 0 15.62 0 2.53 0 2.13 0 26.22
-8% to -6% 176 0.70 13,526 53.87 23,202 92.74 9,491 37.84 5,185 20.92 24,257 96.10
-5% to -4% 2,707 10.79 28,714 114.20 44,169 178.21 36,922 147.39 13,679 55.52 56,981 226.62
-3% to -1% 91,600 364.94 189,216 754.31 227,253 913.19 267,689 1,062.64 139,687 566.74 220,391 878.24
Zero Grade 893,486 3,563.38 643,827 2,568.47 300,137 1,209.73 477,409 1,881.62 560,664 2,251.91 438,936 1,741.89
1% to 3% 87,671 348.22 173,304 689.38 197,268 794.16 245,251 969.30 135,715 548.05 180,424 714.90
4% to 5% 7,598 30.07 45,601 180.70 69,412 280.49 70,626 280.52 27,383 111.02 73,714 291.98
6% to 8% 798 3.18 23,936 94.66 37,606 148.63 23,139 92.34 9,545 38.59 42,186 166.15
≥ 8% 6 0.02 4,444 17.42 9,073 35.98 1,850 7.33 1,382 5.46 10,800 42.40
Total 1,084,042 4,321.30 1,122,568 4,473.02 908,120 3,668.75 1,132,377 4,481.52 893,240 3,600.34 1,047,689 4,184.49


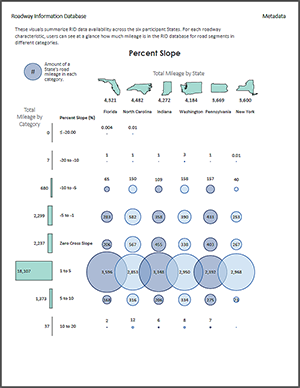
Percent Slope

Click on this image for the PDF.
Percent Slope PDF Cover Image

The following table includes the Percent Slope data in accessible format that is housed above in the PDF format.

Percent Slope Florida Indiana Pennsylvania North
Carolina
New
York
Washington
  Counts Mileage Counts Mileage Counts Mileage Counts Mileage Counts Mileage Counts Mileage
≤ -20.00% 1 0.00 0 0 0 0.00 3 0.01 0 0.00 0 0.00
-20% to -10% 249 0.81 195 0.77 231 0.98 369 1.46 3 0.01 809 3.17
-10% to -5% 16,458 65.29 27,551 109.43 39,159 157.49 38,381 149.91 10,007 39.86 40,053 158.47
-5% to -1% 71,145 282.70 90,138 357.89 107,718 433.24 147,066 582.37 62,077 252.75 98,485 389.75
Zero Cross Slope 52,437 206.37 115,018 455.49 98,724 403.34 143,453 566.98 65,430 266.55 86,274 338.36
1% to 5% 901,117 3,595.92 839,160 3,348.00 596,422 2,392.17 720,467 2,852.96 738,016 2,967.62 742,032 2,949.84
5% to 10% 42,175 168.37 51,575 205.65 68,184 274.74 80,312 316.31 18,191 73.36 83,955 334.26
10% to 20% 460 1.83 1,422 5.62 1,582 6.79 2,959 11.53 46 0.19 2,691 10.64
Total 1,084,042 4,321.30 1,125,059 4,482.85 912,020 3,668.75 1,133,010 4,481.52 893,770 3,600.34 1,054,299 4,184.49


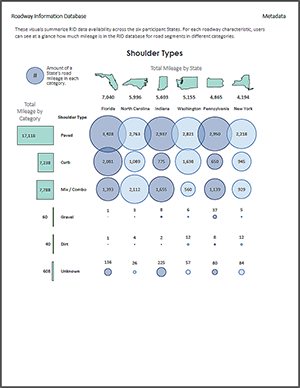
Shoulder Types

Click on this image for the PDF.
Shoulder Types PDF Cover Image

The following table includes the Shoulder Types data in accessible format that is housed above in the PDF format.

Shoulder Types Florida Indiana Pennsylvania North
Carolina
New
York
Washington
  Counts Mileage Counts Mileage Count Mileage Counts Mileage Counts Mileage Counts Mileage
Unknown 2,316 136.25 1,431 224.63 1,134 79.82 560 26.07 999 84.02 969 57.49
Curb 30,601 2,080.98 10,536 775.18 11,901 650.10 14,896 1,088.74 12,470 945.12 25,789 1,698.26
Mix / Combo 10,243 1,393.18 11,181 1,655.20 12,660 1,138.74 18,429 2,111.97 5,584 929.26 5,435 559.59
Paved 15,769 3,427.56 16,517 2,936.93 27,190 2,950.26 11,797 2,763.03 10,118 2,218.50 16,228 2,821.41
Gravel 39 0.59 167 8.37 401 37.38 78 2.59 71 5.13 93 6.44
Dirt 53 1.21 73 2.37 146 8.42 38 3.65 143 12.43 187 11.97
Total 59,021 7,039.77 39,905 5,602.67 53,432 4,864.71 45,798 5,996.03 29,385 4,194.45 48,701 5,155.15


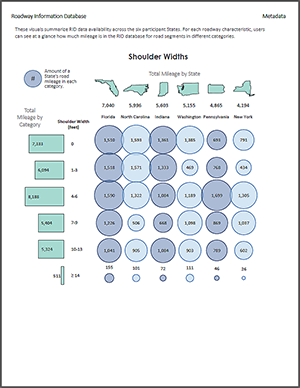
Shoulder Widths

Click on this image for the PDF.
Shoulder Widths PDF Cover Image

The following table includes the Shoulder Widths data in accessible format that is housed above in the PDF format.

Shoulder Widths Florida Indiana Pennsylvania North
Carolina
New
York
Washington
  Counts Mileage Counts Mileage Count Mileage Counts Mileage Counts Mileage Counts Mileage
0 20,224 1,510.23 12,432 1,360.93 8,400 693.10 14,329 1,592.91 8,597 790.52 16,289 1,385.44
1 - 3 16,445 1,517.53 7,818 1,333.31 8,552 768.40 12,555 1,570.57 3,347 434.38 5,589 469.43
4 - 6 9,487 1,589.85 7,531 1,084.37 15,630 1,698.77 8,608 1,321.72 7,889 1,304.76 9,541 1,188.52
7 - 9 5,912 1,226.38 6,119 668.01 11,276 869.25 3,999 505.61 6,177 1,036.83 9,828 1,097.82
10 - 13 5,029 1,040.83 5,201 1,084.24 8,220 789.40 4,653 904.58 2,936 601.98 5,479 902.58
≥14 1,924 154.97 804 71.82 1,354 45.80 1,654 100.65 439 25.99 1,975 111.37
Total 59,021 7,039.77 39,905 5,602.67 53,432 4,864.71 45,798 5,996.03 29,385 4,194.45 48,701 5,155.15


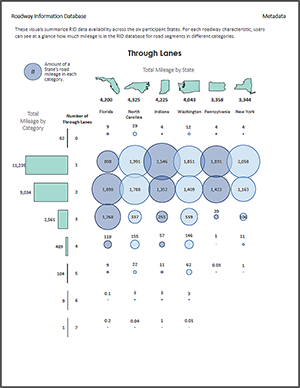
Through Lanes

Click on this image for the PDF.
Through Lanes PDF Cover Image

The following table includes the Through Lanes data in accessible format that is housed above in the PDF format.

Through Lanes Florida Indiana Pennsylvania North
Carolina
New
York
Washington
  Count Mileage Counts Mileage Counts Mileage Counts Mileage Counts Mileage Counts Mileage
0 361 9.04 194 3.97 172 4.49 888 28.77 161 3.93 670 11.98
1 8,924 897.82 13,223 2,546.03 12,505 1,890.81 14,552 1,990.71 12,887 2,058.06 18,860 1,851.16
2 21,746 1,897.61 9,120 1,352.11 5,521 1,423.39 12,412 1,788.23 7,000 1,162.92 16,323 1,409.41
3 11,136 1,268.05 2,126 251.19 171 38.73 2,114 337.19 923 106.39 3,378 559.09
4 989 118.51 319 57.47 5 0.51 611 154.90 101 11.49 608 146.33
5 56 8.77 75 10.60 1 0.03 103 21.98 9 1.09 221 61.67
6 4 0.12 35 2.70 0 0.00 23 3.13 0 0.00 22 2.96
7 2 0.17 1 0.65 0 0.00 1 0.04 0 0.00 4 0.32
Total 43,218 4,200.09 25,093 4,224.72 18,375 3,357.95 30,704 4,324.94 21,081 3,343.89 40,086 4,042.92


Federal Highway Administration | 1200 New Jersey Avenue, SE | Washington, DC 20590 | 202-366-4000
Turner-Fairbank Highway Research Center | 6300 Georgetown Pike | McLean, VA | 22101