U.S. Department of Transportation
Federal Highway Administration
1200 New Jersey Avenue, SE
Washington, DC 20590
202-366-4000
Federal Highway Administration Research and Technology
Coordinating, Developing, and Delivering Highway Transportation Innovations
| SUMMARY REPORT |
| This summary report is an archived publication and may contain dated technical, contact, and link information |
|
| Publication Number: FHWA-HRT-15-067 Date: August 2015 |
Publication Number: FHWA-HRT-15-067 Date: August 2015 |
Presenter: Dr. Ron Gibbons
Project Team: Virginia Tech Transportation Institute
Dr. Gibbons began his presentation with a brief introduction to the evolution of outdoor lighting over the years (Gibbons, 2014). He mentioned that two key developments have occurred, solid-state lighting and control systems. These developments have led to a lighting revolution primarily driven by the convergence of these two technologies. Dr. Gibbons presented research and findings from two projects conducted at the Virginia Tech Transportation Institute, "Spectral Effects of Light Sources" and "Adaptive Lighting." He then discussed potential areas of future visibility research.
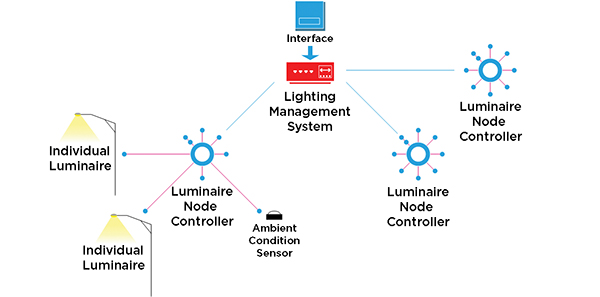
Solid-state lighting is a type of lighting that offers little flexibility or control; typically only on or off on a timer. Control systems offer more flexibility and control, take advantage of light-emitting diode (LED) technology, and create energy efficient, dimmable light-system management. Figure 1 presents a topology of how a control system works.
For Dr. Gibbons' first project, "Spectral Effects of Light Sources," he investigated the interaction of headlamps and overhead lighting, color recognition, and pedestrian object detection. Because the human visual system adapts well to blue light at night, and LEDs can now provide all colors of the spectrum, there is a potential to have a white light source, which could greatly increase visibility for night driving. Dr. Gibbons' research showed that lighting levels on roadways could be lowered and a shift in the broad spectrum to blue could decrease energy consumption, while maintaining or even increasing visibility.

Figure 1. Control system topologies.
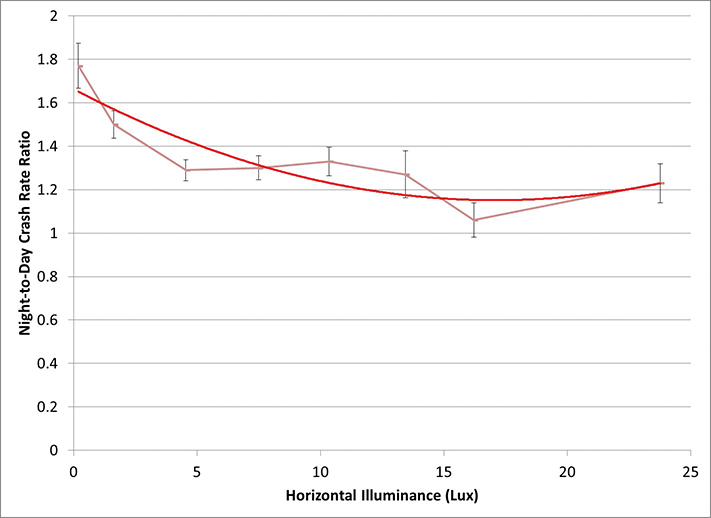
For Dr. Gibbons' second project, "Adaptive Lighting," he investigated the ability to adapt roadway lighting systems to the needs of the environment. An adaptive luminaire system would reduce energy consumption and allow municipalities to install the systems where needed, reducing the costs associated with lamp replacement. To study whether adjusting the luminaire intensity affects crash rates, Dr. Gibbons' tested vehicles that were driven with various types of lighting systems, while accounting for traffic volume, weather, lighting conditions, and pedestrian usage. He then compared data involving 3,200 lane-km (2,000 lane-mi) of lighting with 23,000 crashes and identified that there are situations when lighting levels could be changed while maintaining safe levels of driving performance. Figure 2 provides the ratio of night-to-day crash rate and the corresponding horizontal luminance levels.
This analysis did not remove crashes attributed to impaired driving, and the number of crashes was stratified to determine whether lighting had a differential effect on impaired drivers compared with crashes involving pedestrians or objects.
Dr. Gibbons showed that the results were not significant and more lighting and crash data are needed for further investigation. He also described some potential areas for future research focusing on lighting systems and their effects on infrastructures, which are summarized as follows:

Figure 2. Driver crash rate and luminance.
Presenter: Dr. Paul Carlson
Project Team: Texas A&M Transportation Institute
Dr. Carlson presented areas of completed and ongoing research related to retroreflectivity, pavement markings, and signage (Carlson, 2014). He also discussed topics for potential future research. These research areas included brightness and legibility of signage; placement, width, and materials used in pavement markings; and ways to expand on current performance values outlined in the Manual on Uniform Traffic Control Devices (MUTCD). In addition, Dr. Carlson provided examples where research could be expanded to establish retroreflectivity specifications and expected life cycles of signs and pavement markings.
Dr. Carlson explained that retroreflectivity is a passive technology and needs lighting to function properly. There have been many studies conducted that have investigated different aspects of signs as they pertain to retroreflectivity. For example, FHWA investigated sign brightness, retroreflectivity measurement biases, and the use of flashing signs; Minneapolis Department of Transportation (DOT) investigated fonts on guide signs; Florida DOT investigated sign lighting and the materials that should be used for roadway signs; researchers for National Cooperative Highway Research Program (NCHRP) Synthesis 431: Practices to Manage Traffic Sign Retroreflectivity explored and identified methods and best practices for traffic sign reflectivity that States are using to be in compliance with Federal regulations; American Association of State Highway and Transportation Officials' Subcommittee on Traffic Engineering conducted a survey to update NCHRP's reflectivity devices practices; and the Georgia Institute of Technology worked with Georgia DOT to assess light detection and ranging retroreflectivity.
Dr. Carlson also described previous pavement- markings research. FHWA published a study that tested pavement-marking performance in harsh environments (Alaska and Tennessee); NCHRP developed a new recommended procedure to test the retroreflectivity of glass beads, for which a specification is currently being developed; Missouri DOT investigated the safety of marking width, retroreflectivity, brightness, and placement; and the American Traffic Safety Services Association, in collaboration with FHWA, investigated the safety of pavement markings' retroreflectivity and pavement at night.
Dr. Carlson highlighted that the MUTCD established performance value sets for traffic devices. Researchers for NCHRP 05-20 are also working to expand and update the standards set in the MUTCD to describe how much light is needed to illuminate guide signs. To achieve this, the researchers worked to break down the complexity of the highway scene. By using images, they developed a program that would output a background complexity rating. Dr. Carlson explained that the complexity rate is calculated by using a static image, digitizing it to determine edge detection, and then assessing every pixel within the image. By using this complexity rating, the goal is to set standards and help determine when to light guide signs and how much light is needed.
Dr. Carlson also reviewed ongoing pavement-marking research. FHWA is working to develop standards to help select pavement markings for specific situations and environments; Illinois DOT is working to develop laboratory test methods to mimic the wear and tear of pavement markings in the field to accelerate performance testing for new technologies before installation on highways and roadways; and researchers for NCHRP 05-21 are investigating the safety and performance of raised pavement markings when paired with retroreflective pavement markings, in addition to determining additional benefits. Researchers for NCHRP Topic 46-13 are also studying rumble strips and profile markings to understand performance.
Dr. Carlson described several potential areas for research that range from establishing requirements for minimum retroreflectivity to investigating the usage and effect of digital signage along roadways. The following research areas were discussed:
Presenter: Dr. Michel Ferreira
Project Team: University of Porto
During his presentation, Dr. Ferreira described virtual windshields, vehicle-to-vehicle (V2V) connectivity, and new infrastructure technology (Ferreira, 2014). He explained that he has focused his research on the implications of virtual and electronic windshields on transportation infrastructure. These implications, as well as potential areas for future research, are described in the following section.
Dr. Ferreira noted that a driver's visibility is primarily affected by weather conditions and vehicle design (e.g., the windshield, dashboard, and pillars). Virtual windshields can be used to augment a driver's perception of the roadway. To achieve this, a computer uses the driver's perspective to overlay an image in their field of view and enhance the physical world as seen by the driver. Vehicles currently augment the driver's reality through the use of side- and rearview mirrors. That is, mirrors are used to augment the perception of what is going on behind the driver. These augmentations may improve the driver's visibility and awareness of his or her surrounding environment.
Dr. Ferreira explained that virtual windshields can be implemented through superimposed images on a head-up display (HUD) or other information display. Virtual environment technology includes parking assistance, cruise-control adaptability, lane-departure warning, and crash-avoidance systems. Vehicle manufacturers recently have begun removing the sideview mirrors and replacing them with cameras that display the side views on the centrally-mounted rearview mirror.
Dr. Ferreira highlighted how electronic windshields offer "see-through" visibility technology by using cameras to capture the environment and a computer to create digital content, which is displayed on the windshield. Dashboard information, global positioning system (GPS) navigation, and information from other vehicles can then be superimposed on the windshield view. For example, a truck could send its window view to the following vehicle so that driver can make a safe decision as to whether to try to pass the truck. Dr. Ferreira noted some potential issues with this technology. For instance, there could be delays in the image projection between vehicles, thereby increasing the risk of drivers making maneuver decisions with incorrect (i.e., late) information. Moreover, if one vehicle loses the ability to connect with other vehicles, then messages and information would not be shared, which may create blind spots for other vehicles.
Dr. Ferreira stated that there is a potential to use wireless technology and to synchronize a driver's smart phone with the vehicle's virtual windshield. The car would become a platform for a smart phone, but with a larger screen, and create a connected and an immersive ambient experience. He also stated that using wireless technology allows for more accurate information to be shared and increases the ability for V2V connectivity. In this scenario, every vehicle on the road would have a virtual traffic light that travels with the vehicle and would always be visible to the driver through the HUD. The interconnected vehicles on the road would monitor and sense area traffic when approaching an intersection and help govern traffic flow and safety.
Dr. Ferreira then described some potential areas for research in virtual windshields and visibility, as follows:
Presenter: Dr. Nicolas Hautière
Project Team: IFSTTAR
Dr. Hautière presented his research on developing an edge-detection formula to aid in driver visibility during less-than-ideal conditions (e.g., fog and rain; Hautière, 2014). He developed this formula using photometrical visibility standards to analyze images without a priori information about target characteristics. He modeled the driver's perception and computed highway visibility through contrast estimation and measurement of the retroreflected luminance coefficient. Details about Dr. Hautière's research and areas for future research are described in the following section.
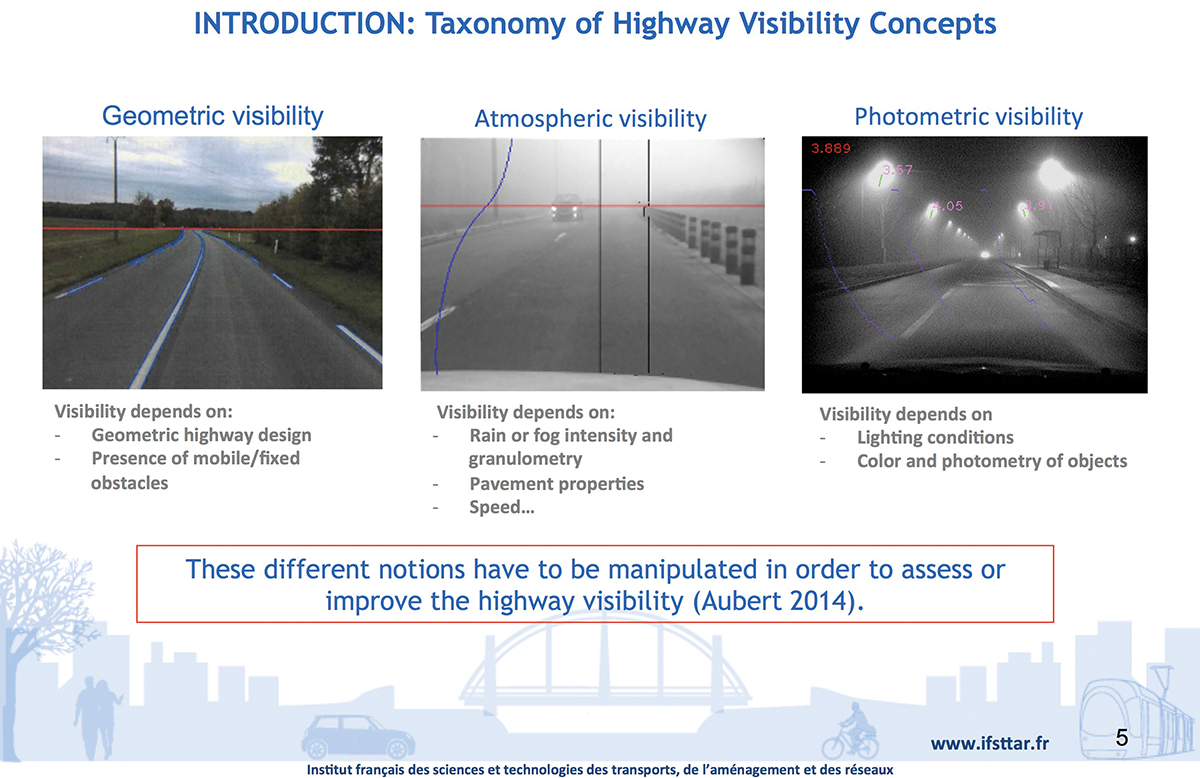
Researchers at the French Institute of Science and Technology for Transport, Development, and Networks (IFSTTAR) developed a mathematical formula to calculate edge detection and assist drivers by filling in the missing information from a driver's windshield view when visibility is poor. Three types of visibility are used to achieve this:(1) geometric visibility that relies on the geometry of the highway design and the presence of fixed and moving obstacles; (2) atmospheric visibility that relies on rain or fog intensity, granulometry, pavement properties, and vehicle velocity; and (3) photometric visibility that relies on lighting conditions and the color and photometry of objects. Figure 3 provides additional information related to these three types of visibility.
The research team at IFSTTAR was able to estimate the photometrical visibility through image analysis without any a priori information about target characteristics. Dr. Hautière explained that the driver's perception was modeled and highway visibility computed through contrast estimation and measurement of the retroreflected luminance coefficient. The research team validated the contrast model by using human subject testing. The subjects were able to reproduce better results than were the calculated results, making the model conservative and demonstrating the efficiency of this approach in real-world applications.
Dr. Hautière noted that this model could be used to assist the driver in fog conditions. The system would detect objects, apply the contrast model, and then represent the image on the HUD to improve the driver's reaction time through improved clarity and quality of visible cues. Dr. Hautière then discussed potential new areas for visibility research, as follows:

© IFSTTAR
Figure 3. Roadway visibility concepts.
Presenter: Dr. Eileen Kowler
Project Team: Rutgers University
Dr. Kowler presented research that focused on eye movement and the cognitive effort needed to make correct and efficient decisions (Kowler, 2014). Her research focused on human ability to complete computer-generated mazes of varying complexity by using different cognitive functions. The following section summarizes Dr. Kowler's discussion of how this applies to roadway visibility infrastructure and outlines other possible research areas to explore.
Dr. Kowler explained that saccadic eye movements (SEMs) are rapid jumps of the eye and that SEM scan patterns occur a couple of times per second. She noted that human cognition of the visual field decreases with eccentricity of the SEMs, that is, even when luminance cues are given, they are not always followed or recognized. Dr. Kowler mentioned that there is extensive research related to how people scan their visual field, retain, and make decisions based on this information.
Through human subject testing, Dr. Kowler showed that some individuals do not put forth the amount of effort needed to analyze the location of the luminance signal and the most efficient path to reach the location. For example, in a maze task, researchers asked participants to complete a randomly selected maze as fast as possible and to use the computer mouse to trace the path through the maze. Results showed that some participants used their eyes to explore the maze before moving the mouse; however, there were other participants who immediately started using the mouse instead of visually exploring the maze. Dr. Kowler's research indicated that the latter group of participants made more mistakes and took longer than did those who had visually explored the maze before tracing the path with the mouse. Figure 4 shows that although the subjects had ample opportunity to explore the maze, many did not.
Dr. Kowler suggested that the question of why people did not explore the entire maze relates to memory. The cost of exploration equals the amount of memory needed to retain the information, and some people do not use this cognitive tool. Dr. Kowler noted that human decisionmaking outweighs visibility and that adding a time pressure element to make a decision can make the task extremely difficult.

© Rutgers University
Figure 4. Eye movements navigating complex mazes.
Dr. Kowler discussed potential areas for visibility research as they relate to roadway infrastructure, as follows: