U.S. Department of Transportation
Federal Highway Administration
1200 New Jersey Avenue, SE
Washington, DC 20590
202-366-4000
Federal Highway Administration Research and Technology
Coordinating, Developing, and Delivering Highway Transportation Innovations
 |
| This report is an archived publication and may contain dated technical, contact, and link information |
|
Publication Number: FHWA-HRT-05-062
Date: May 2007 |
Users Manual for LS-DYNA Concrete Material Model 159PDF Version (1.49 KB)
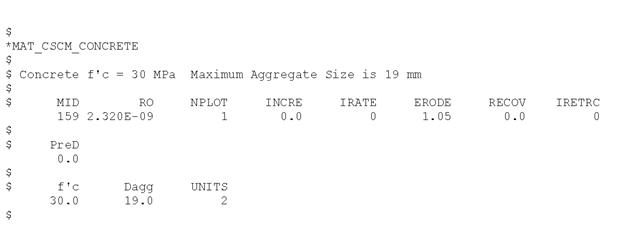
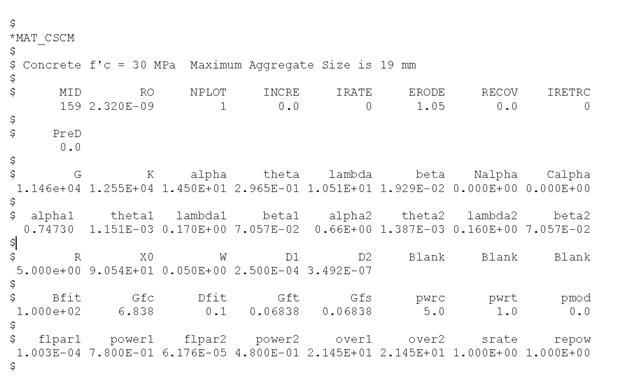
PDF files can be viewed with the Acrobat® Reader® Chapter 4. Examples ManualThis chapter contains example problems that help users become familiar with set up and usage of the concrete material model. These are single element simulations in tension and compression. These simulations demonstrate two methods of setting up the concrete material property input. The fast and easy method is to use default material properties selected as a function of concrete compressive strength and maximum aggregate size. The more detailed method is to specify all material properties individually. In addition to analyzing plain concrete, the user may wish to analyze reinforced concrete. Modeling steel reinforcement is discussed in appendix B. Numerous other example problems for plain and reinforced concrete are given in the companion concrete model evaluation report.(1) Concrete material model input is given in Figure 105 for default concrete parameters and in Figure 106 for user-specified properties. A complete input file, with nodes and elements, is given in appendix C. This file is for tensile loading in uniaxial stress of a single element. To convert to compressive loading, change the sign of the ordinate under *DEFINE CURVE at the bottom of the file.
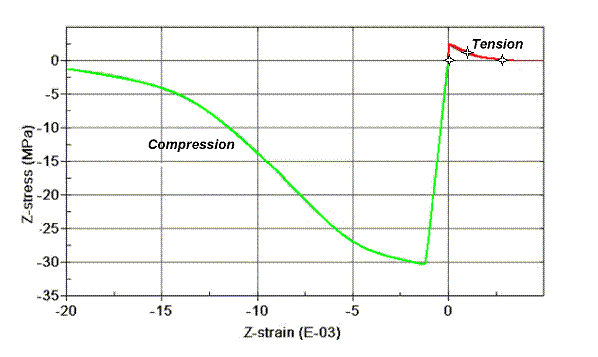
Figure 105. Computer printout. Example concrete model input for default material property input (option mat_CSCM_concrete). Single element stress-strain results are shown in Figure 107 for concrete with a compressive strength of 30 MPa (4,351 psi) and a maximum aggregate size of 19 mm (0.75 inches). These results can be achieved using either the default input shown in Figure 105 or the user-specified input shown in Figure 106. Note that the peak strength attained in compression matches the specified strength listed in Figure 105, which is 30 MPa (4,351 psi). Results are plotted with LS-POST as cross-plots of element z-stress versus z-strain. As additional exercises, the user can vary the unconfined compressive strength, aggregate size, and rate effects to examine the variation in concrete behavior with these quantities. Note that the concrete tensile strength is less than 10 percent of the compressive strength. Because of concrete's low tensile strength, unintended tensile damage may occur in the vicinity of contact surfaces, as discussed in the concrete evaluation report.(1)
Figure 106. Computer printout. Example concrete model input for user-specified material property input (option MAT_CSCM).
psi = 145.05 MPa Figure 107. Graph. Example single element stress-strain results for 30 MPa (4,351 psi) concrete with 19-mm (0.75-inch) maximum aggregate size. |