CHAPTER 4. EXPERIMENTAL RESULTS AND DISCUSSION
INTRODUCTION
Experimental setup used in the Major Units Laboratory was previously discussed in chapter 3. This chapter discusses the experimental results of five jointed concrete slabs with FRP or steel dowels. Parameters evaluated in these tests under static and fatigue loads included the following:
- LTE.
- RD between loaded and unloaded pavement.
- Strain on dowels.
Before discussing these three parameters, joint crack patterns observed in the tests are presented. Joint crack patterns have significant effects on LTE, RD, and dowel strains.
Parameters of two preliminary tests conducted on two pavement slabs with FRP dowels and actual main tests are listed in table 6. Slabs with 15.24-cm (6-inch) spacing were placed in group 1, whereas slabs with 30.48-cm (12-inch) spacing were placed in group 2.
Table 6. Parameters of dowel groups.
| Group |
Slab Number |
Center-to-Center Spacing (inches) |
Number of Dowels in Slab |
Concrete Strength (psi) |
Dowel Material |
Dowel Diameter (inches) |
| Preliminary group |
PG-1 |
12 |
1 |
3,500 |
FRP |
1.5 |
| PG-2 |
| Group 1 |
1 |
6 |
2 |
4,500 |
FRP |
1.0 |
| 2 |
Steel |
1.0 |
| 3 |
FRP |
1.5 |
| Group 2 |
4 |
12 |
1 |
4,500 |
FRP |
1.5 |
| 5 |
Steel |
1.5 |
1 inch = 2.54 cm
1 psi = 0.006 895 MPa
JOINT CRACK PATTERNS OBSERVED IN LABORATORY TESTS
Cracks in JPCP specimens occurred at two locations: one was right at the joint, and the other was directly under the loading zone, close to dowel edge. Figure 18 through figure 20 show the following three types of crack patterns observed in tests (also refer to table 7):
- Type I—Crack occurred only in the joint (figure 18).
- Type II—Cracks occurred at joint and loading zone close to dowel edge (figure 19).
- Type III—Crack occurred away from the joint at the dowel edge in the loading zone (figure 20).
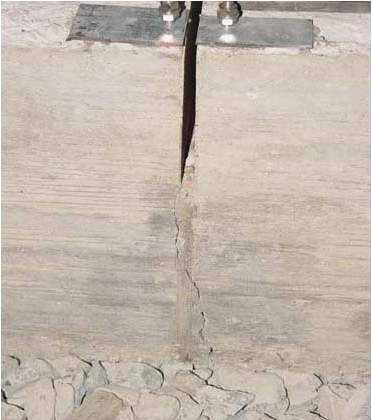
Figure 18. Photo. Typical crack observed in slabs number 1, 4, and 5 (table 7).
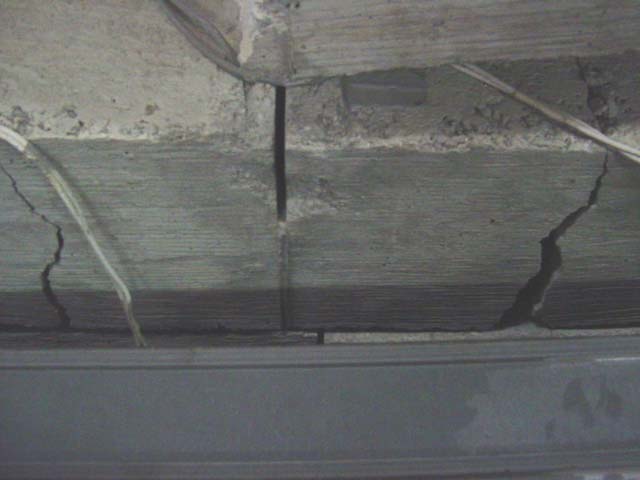
Figure 19. Photo. Crack observed in slab number 2 (table 7).
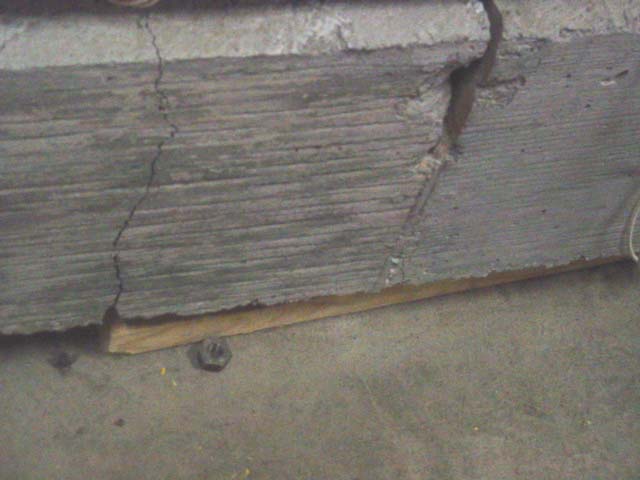
Figure 20. Photo. Typical crack observed in slab number 3 (table 7).
Table 7. Cracks in the tested slabs.
| Group Number |
Specimen |
Dowel Material |
Concrete Strength (psi) |
Dowel Diameter/ Spacing (inches) |
Number of Dowels in Specimen |
Crack Pattern |
| Preliminary group |
PG-1 |
FRP |
3,500 |
1.5 at 12 c/c |
1 |
I |
| PG-2 |
| Group 1 |
Slab number 1 |
FRP |
4,500 |
1.0 at 6 c/c |
2 |
I |
| Slab number 2 |
Steel |
1.0 at 6 c/c |
II |
| Slab number 3 |
FRP |
1.5 at 6 c/c |
III |
| Group 2 |
Slab number 4 |
FRP |
4,500 |
1.5 at 12 c/c |
1 |
I |
| Slab number 5 |
Steel |
I |
c/c = Center to center
1 inch = 2.54 cm
1 psi = 0.006 895 MPa
According to table 7, specimens PG-1 and PG-2 and slabs number 1, 4, and 5 had crack formation at the joints. In these cases, dowels provided maximum load transfer across the joints. This was the scenario expected to occur in the field.
In slab number 3, a crack occurred at the loaded zone only, away from the sawcut junction of two slabs. Under field conditions, such joint formation would not contribute to effective load transfer. At most, it would be expected that only a very small portion of the applied load would be transferred across this crack. Joint formation at unintended locations may facilitate concrete expansion or contraction due to field thermal variations. In slab number 2, cracks occurred at both joint and load zone locations.
The reason for cracks occurring away from mid-joint and under the loading zone could possibly be attributed to the uneven base surface under the loaded side of the slab. Because the slabs were not cast directly on the aggregates as in the field construction method, when the load was applied, the uneven surface including possible gradients could cause enough stress concentration at the dowel edge to lead to concrete cracking prior to load transfer.
PRELIMINARY TESTS
Preliminary static tests were conducted on two slabs consisting of one 3.8-cm (1.5-inch)diameter FRP dowel at 30.48 cm (12 inches) center to center (c/c). LTEs obtained from these static tests were both greater than 90 percent, i.e., much higher than 60 percent of LTE as recommended by ACPA (corresponding to 75 percent of joint effectiveness, E).(11)
JOINT DEFLECTIONS AND JOINT LTE
Deflections of dowel-connected slabs were measured using LVDTs positioned at both loaded and unloaded sides of joints. LTE and RDs were then calculated from measured deflections.
Joint RD
Joint RD of Group 1
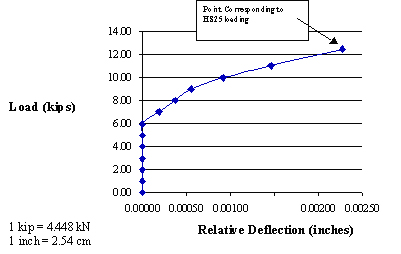
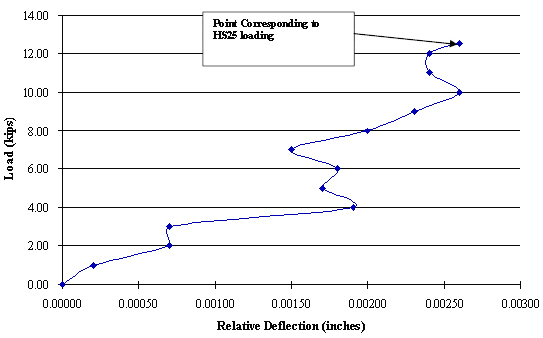
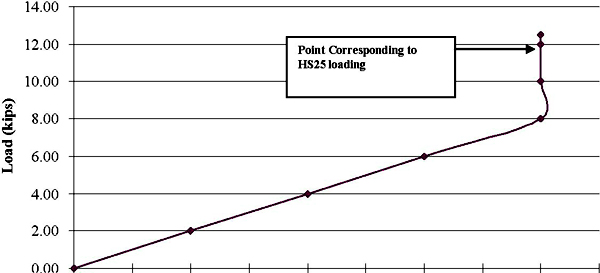
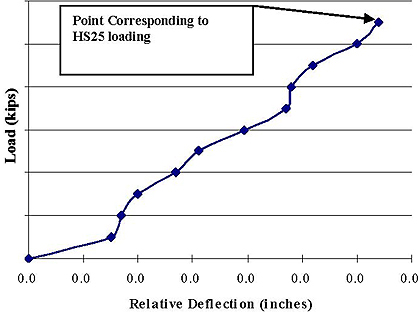
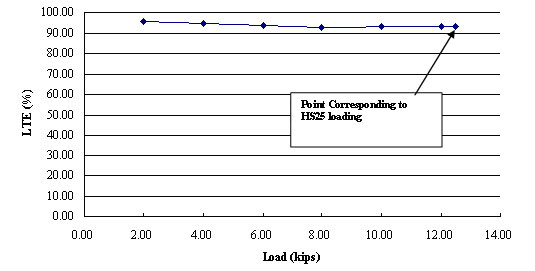
Slab number 1 consisted of two 2.54-cm (1.0-inch)-diameter FRP dowels with spacing of 15.24 cm (6 inches) (refer to figure 8, figure 14, and table 7). Static tests were conducted according to table 8. RD versus applied load is shown in figure 21.
Table 8. Static load applied for specimen 1.
| Specimen Number |
Load Range |
| 1 |
0 to 55.603 kN (0 to 12.5 kips) |
Note: 55.603 kN (12.5 kips) was applied corresponding to HS25 load.
After static testing, fatigue tests were conducted up to 5 million cycles (table 9). Figure 21, figure 22, and figure 23 show the RDs obtained from tests. It should be noted that 83.404 kN (18.75 kips) (1.5 times HS25 loading) was applied to the joint after 1 million cycles.
Table 9. Load applied for fatigue tests on slab number 1.
| Slab Number |
Wave Shape |
Frequency (Hz) |
0 to 1 Million Cycles |
1 to 5 Million Cycles |
| 1 |
Sine |
4.0 |
2–12.5 kips |
2–18.75 kips |
Note: 55.603 kN (12.5 kips) was applied corresponding to HS25 load, and 83.404 kN (18.75 kips)
corresponds to 1.5 times HS25 load.
1 kip = 4.448 kN
Relative Deflection (inches) 1 inch = 2.54 cm
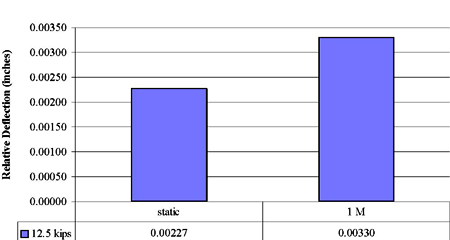
Figure 21. Chart. Joint RD for slab number 1 under static test.
1 kip = 4.448 kN
1 inch = 2.54 cm
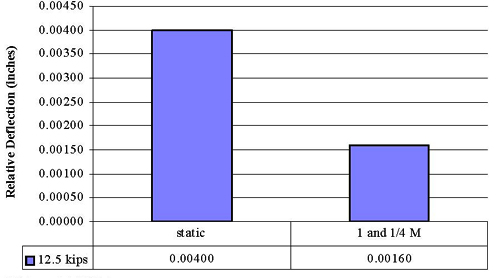
Figure 22. Graph. RDs under HS25 loading for slab number 1 at joint width of
0.635 mm (0.25 inch) (static and 1 million cycles).
1 kip = 4.448 kN
1 inch = 2.54 cm
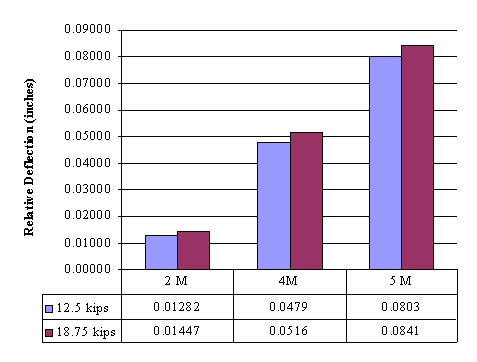
Figure 23. Graph. RDs for slab number 1 under fatigue tests (joint width increased from 0.635 cm
(0.25 inch) to 1.016 mm (0.4 inch) from 2 to 5 million cycles).
In figure 23, the 55.603-kN (12.5-kips) load corresponds to HS25 loading and was applied up to 1 million cycles; 83.404 kN (18.75 kips) corresponds to 1.5 times HS25 loading and was applied for fatigue tests after 1 million cycles and up to 5 million cycles. Also, joint width increased from 0.635 mm (0.25 inch) to 10.16 mm (0.4 inch) during bin and slab repositioning. Thus, the RDs after 1 million cycles due to increased joint width were much greater than those from static and 1 million cycle tests (0.3256 mm (0.01282 inch) at 2 million cycles versus 0.0838 mm (0.0033 inch) at 1 million cycles.
Slab number 2 consisted of two 2.54-cm (1-inch)-diameter steel dowels with 15.24-cm (6-inch) spacing. A static test was conducted on this slab with a load range of 0 to 55.603 kN (0 to 12.5 kips), and crack formation was noticed at the dowel edge under the loading plate. Load versus RD results are shown in figure 24. After static testing, fatigue tests were conducted according to table 10. Because cracks occurred at locations away from the joint, fatigue cycles up to 2 million were applied. Figure 25 shows RDs under fatigue tests. It should be noted that when cracks occur away from mid-joints, only a small portion of the load would be transferred across the joint.
1 kip = 4.448 kN
1 inch = 2.54 cm
Figure 24. Chart. Joint RD for slab number 2 under static test.
Table 10. Load applied for fatigue tests on slab number 2.
Slab Number |
Frequency (Hz) |
0–1 Million Cycles |
> 1–2 Million Cycles |
2 |
4.0 |
2–12.5 kips |
2–18.75 kips |
Note: 55.603 kN (12.5 kips) was applied corresponding to HS25 load, and 83.404 kN (18.75 kips)
corresponded to 1.5 times HS25 load.
1 kip = 4.448 kN
1 kip = 4.448 kN
1 inch = 2.54 cm
Figure 25. Graph. RDs for specimen 2 (0 to 2 million cycles).
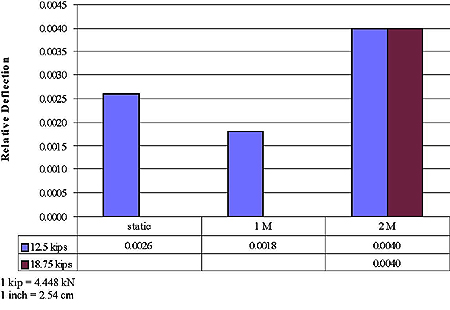
Slab number 3 consisted of two 3.81-cm (1.5-inch)-diameter FRP dowels with 15.24-cm (6-inch) spacing. Static deflections were measured for a load range from 0 to 55.603 kN (0 to 12.5 kips), and the details are shown in figure 26. Crack locations were away from the mid-joint; hence, fatigue tests were conducted up to only 1.25 million cycles (refer to table 11). Table 11 details the load applied for fatigue tests on slab number 3. Figure 27 shows the RDs under fatigue tests. Deviations observed in RD values from slab number 3 were due to crack formation under the loading plate at the dowel edge.
Relative Deflection (inches)
1 kip = 4.448 kN
1 inch = 2.54 cm
Figure 26. Chart. Joint RD for specimen 3 under static test.
Table 11. Load applied for fatigue tests on slab number 3.
Slab Number |
Frequency (Hz) |
0–1.25 Million Cycles |
3 |
4.0 |
2 to 12.5 kips |
1 kip = 4.448 kN
1 kip = 4.448 kN
1 inch = 2.54 cm
Figure 27. Graph. RDs for specimen 3 (0 to 1.25 million cycles).
Joint RD of Group 2
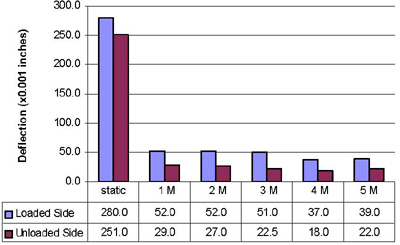
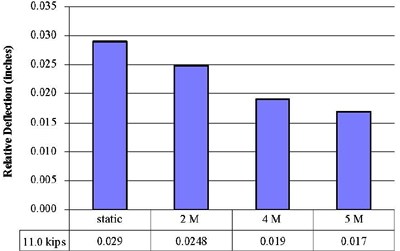
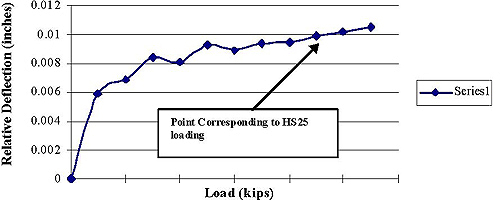
Slab number 4 consisted of one 3.81-cm (1.5-inch)-diameter FRP dowel representing 30.48-cm (12-inch) spacing in actual pavement. The static test was conducted in the range from 0 to 48.930 kN (0 to 11 kips). Load versus RD results are shown in figure 28. After the static test, fatigue tests were conducted as per table 12 up to 5 million cycles. Figure 29 and figure 30 show pavement deflections and RDs under fatigue testing.
1 kip = 4.448 kN
1 inch = 2.54 cm
Figure 28. Chart. Joint RD for specimen number 4 under static test.
Table 12. Load applied for fatigue tests on slab number 4.
Slab Number |
Frequency (Hz) |
0 to 5 Million Cycles |
4 |
4.0 |
2 to 11.0 kips |
1 kip = 4.448 kN
1 inch = 2.54 cm
Figure 29. Graph. Pavement deflections under fatigue test for slab number 4
(0 to 5 million cycles, FRP dowel at 30.48 cm (12 inches) c/c).
1 kip = 4.448 kN
Figure 30. Graph. RDs under fatigue test for specimen 4 (0 to 5 million cycles).
Slab number 4 was the first slab tested in the laboratory. Base materials were compacted before starting the test, but, during laboratory fatigue cycles testing, base materials under both sides of the slabs became more compact and the deflections reduced (figure 29). Similar trends were observed under increased fatigue cycles in figure 30. The modulus of subgrade reaction k increased from 11.072 to 22.144 kg/cm3 (400 to 800 pci) after 5 million fatigue cycles.
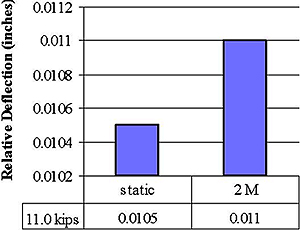
Slab number 5 consisted of one 3.81-cm (1.5-inch)-diameter steel dowel representing 30.48-cm (12-inch) spacing in the pavement. The static test was conducted in the range from 0 to 48.930 kN (0 to 11.0 kips). Fatigue tests were conducted as per table 13. Figure 31 shows the load versus RD. After static testing, fatigue tests were conducted up to 5 million cycles. Figure 32 shows RDs for slab number 5 under fatigue tests.
Table 13. Load applied for fatigue tests on slab number 5.
Slab Number |
Frequency (Hz) |
0 to 5 Million Cycles |
5 |
4.0 |
2 to 11.0 kips |
1 kip = 4.448 kN
1 kip = 4.448 kN
1 inch = 2.54 cm
Figure 31. Chart. Joint RD for specimen 5 under static test.
1 kip = 4.448 kN
1 inch = 2.54 cm
Figure 32. Graph. RDs under fatigue test for specimen 5 (0 to 5 million cycles).
Analysis of RD
Analysis for Specimen Group 1 as per Table 6 (15.24-cm (6-inch) Spacing):
For slabs number 1 through 3, static and fatigue test results are summarized in table 14 and table 15, respectively, and their behavior is discussed in following the tables.
Table 14. RD of group 1 from static tests.
Slab Number |
Parameters |
Static RD (inch) |
1 |
FRP dowel, 1.0 inch at 6 inches c/c |
0.00227 |
2 |
Steel dowel, 1.0 inch at 6 inches c/c |
0.00260 |
3 |
FRP dowel, 1.5 inches at 6 inches c/c |
0.00400 |
1 kip = 4.448 kN 1 inch = 2.54 cm
Table 15. RD of group 1 from fatigue tests.
| Slab Number |
Relative Deflection (inch) |
| 1 M |
2 M |
4 M |
5 M |
Proper Crack at Mid-joint |
| 1 |
0.0033 (Joint width = 0.25 inch) |
0.0128*† |
0.0479*† |
0.0803*† |
Yes |
| 2 |
0.0018 |
0.0040† |
— |
— |
No |
| 3 |
0.0001 |
— |
— |
— |
No |
* Joint width increased to 1.016 cm (0.4 inch).
† An overload factor of 1.5 was used so that 1.5 times HS25 load was applied for specimens 1 and 2 during fatigue tests started after 1 million cycles.
— No loading at corresponding cycles.
1 inch = 2.54 cm
The following results were found:
- The larger RD (0.00660 cm (0.00260 inch)) in slab number 2 with steel dowels compared to that of slab number 1 with FRP dowel (0.00577 cm (0.00227 inch)) can be attributed to the cracking pattern in slab number 2 where joint crack occurred at a place other than the mid-joint.
- Slab number 3 had a much larger RD possibly because the crack formation was close to the edge of the dowel under the steel plate rather than at mid-joint. Therefore, the load transferred by the dowel was less, including a higher RD.
- When a crack occurred at a joint location where it was expected to occur, the RD data from the tests seemed to be more consistent; for example, the RD for slab number 1 increased from 0.00584 to 0.0204 cm (0.0023 to 0.0803 inch).
- Experimental results on RD were sensitive to supporting base stiffness (k). Therefore, base property should be considered before and after each fatigue test.
Analysis for Specimen Group 2 (30.48-cm (12-inch) Spacing):
Test results are summarized in table 16 and table 17.
Table 16. RD of group 2 from static tests.
Slab |
Static RD (inch) |
Proper Crack at Mid-joint |
Number 4 (FRP dowel, 3.81 cm
(1.5 inch) at 30.48 cm (12 inches) c/c) |
0.029 |
Yes |
Number 5 (steel dowel, 3.81 cm
(1.5 inch) at = 30.48 cm (12 inches) c/c) |
0.011 |
Yes |
1 inch = 2.54 cm
Table 17. RD of group 2 from fatigue tests.
Slab Number |
Relative Deflection (inch) |
2 M |
4 M |
5M |
4 |
0.025 |
0.019 |
0.017 |
5 |
0.011 |
— |
— |
— No loading at corresponding cycles.
The following was noted:
- Both slabs number 4 and 5 had proper crack occurrence at the joint.
- In static tests (table 17), slab number 4 (3.81-cm (1.5-inch)-diameter FRP dowel) had a larger difference in deflection between loaded and unloaded sides of the pavement (RD) than slab number 5 (3.81-cm (1.5-inch)-diameter steel dowel).
- The RD for both slabs reduced with progression of fatigue load from 0 to 5 million cycles. This was partly attributed to compaction/settlement of aggregate base underneath the pavement slabs with increasing fatigue cycles.
- RD decreased more in slabs with FRP dowels than with steel dowels, which can be partly attributed to simulation in stiffness between FRP and concrete. Benefits of these reductions may be more evident with freeze-thaw variations.
- Experimental results on RD were sensitive to supporting base stiffness (k). It was found that the base property (modulus of subgrade reaction, k) value changed from 11.072 to 22.144 kg/cm3 (400 to 800 pci) after 5 million fatigue cycles.
Joint LTE
Joint LTE (figure 33 through figure 38) was calculated from the results of static and fatigue tests by using equation 1 as follows:(1)

(1)
Where:
dU = Deflection at unloaded side.
dL = Deflection at loaded side.
ACPA gives joint effectiveness, E, to measure the performance of joints (equation 2):(11)

(2)
Where:
dU = Deflection at unloaded side.
dL = Deflection at loaded side.
ACPA recommends that a pavement joint be considered adequate if the effectiveness is 75 percent or greater. However, LTE and E are related by equation 3:(3)

(3)
According to equation 3, an LTE of 60 percent corresponds to an E of 75 percent. When the value of LTE is between 70 and 100 percent, the joint provides sufficient load transfer for heavy loads.
LTE of Group 1
Slab Number 1:
1 kip = 4.448 k
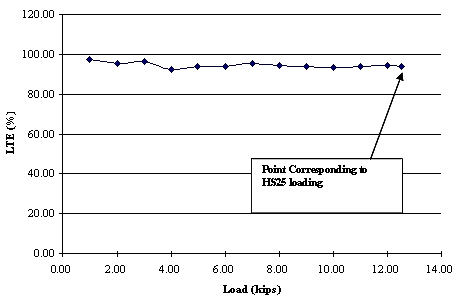
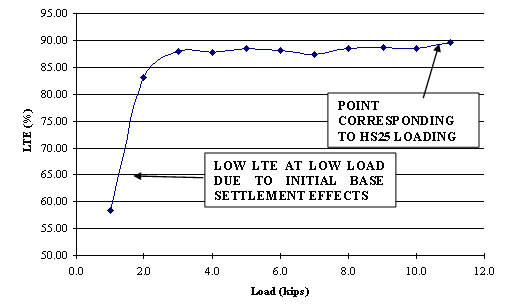
Figure 33. Chart. Joint LTE for slab number 1.
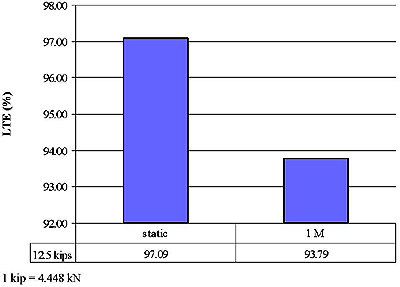
Figure 34. Graph. LTE corresponding to HS25 loading for slab number 1 (2.54-cm
(1.0-inch) diameter at 15.24 cm (6 inches) c/c), static and 1 million cycles.
In figure 35, a load of 55.603 kN (12.5 kips) corresponding to HS25 loading was applied for the static test and 1 million cycles; 83.404 kN (18.75 kips) corresponding to 1.5 times HS25 loading was applied for fatigue tests from 2 to 5 million cycles. Also, joint width was intentionally separated from to 0.635 to 1.016 cm (0.25 to 0.4 inch).
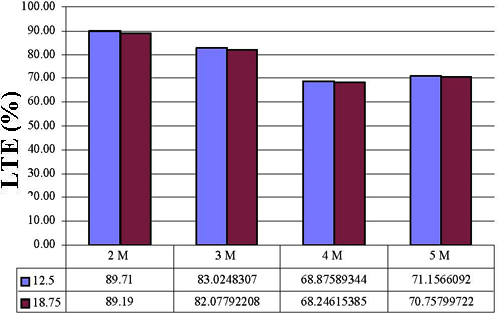
Figure 35. Graph. LTE for slab number 1 under fatigue tests
( > 1 million cycles and joint width increased from 0.635 to 1.016 cm (0.25 to 0.4 inch)).
To find the condition of the interface between the FRP dowel and concrete, slab number 1 was separated by cutting the FRP dowel after 5 million cycles of HS25 and higher loading. The dowel-concrete interface was found to be in good shape with no visible micro cracks (figure 36).
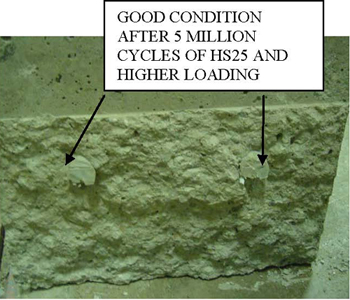
Figure 36. Photo. Dowel-concrete interface condition in slab number 1
after 5 million load cycles.
Slab Number 2:
1 kip = 4.448 kN
Figure 37. Chart. Joint LTE for slab number 2.
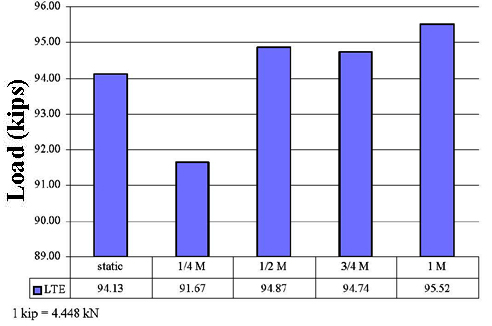
Figure 38. Graph. LTE under fatigue tests (HS25 loading) for slab number 2
(0 to 1 million cycles).
In figure 39, a load of 55.603 kN (12.5 kips) corresponding to HS25 loading was applied for the static test and up to 1 million cycles; 83.404 kN (18.75 kips) corresponding to 1.5 times HS25 loading was applied for fatigue tests after 1 million cycles.
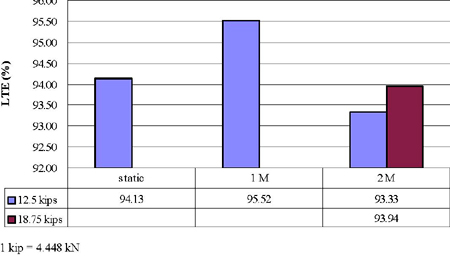
Figure 39. Graph. LTE under fatigue test for slab number 2
(1 to 2 million cycles).
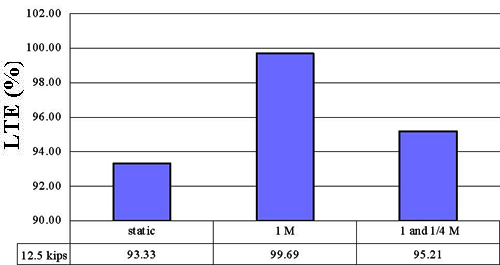
Slab Number 3:
1 kip = 4.448 kN
Figure 40. Chart. Joint LTE for slab number 3.
1 kip = 4.448 kN
Figure 41. Graph. LTE under fatigue test for slab number 3 (0 to 1.25 million cycles).
The crack that occurred in slab number 3 was away from mid-joint; hence, these results (figure 40 and figure 41) did not have much significance.
Joint LTE of Group 2
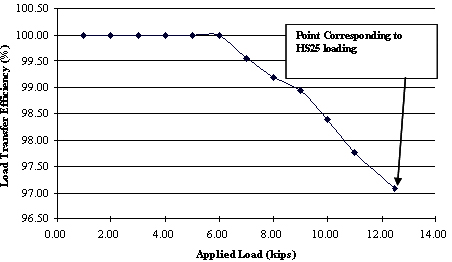
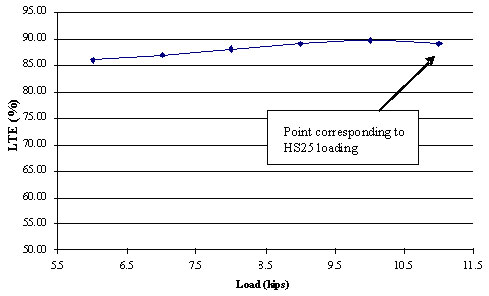
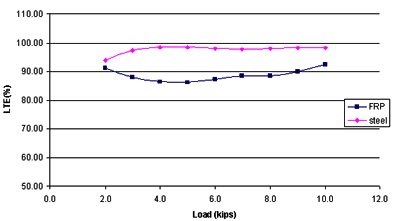
Slab Number 4:
During static testing, slab number 4 was subjected to loading up to 48.930 kN (11 kips) corresponding to HS25 loading, and the response is shown in figure 42.
1 kip = 4.448 kN
Figure 42. Chart. Joint LTE for slab number 4.
In fatigue tests, slab number 4 provided good LTE—greater than 80.5 percent after 5 million fatigue load cycles when the base surface and base material under this slab remained in good condition. When base aggregates were not in contact with the slab due to aggregate compaction or slight sideways flexing of the aggregate bin, LTE was found to have been decreased to about 55 percent, which was still around 92.1 percent of the 60 percent LTE which corresponded to the ACPA-recommended value on joint effectiveness (E) of 75 percent. Detailed data are shown in figure 43.
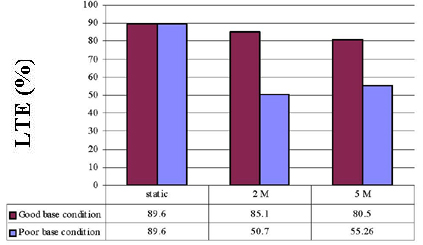
Figure 43. Graph. LTE under fatigue test for slab number 4 (0 to 5 million cycles).
From figure 43, LTE of slab number 4 containing FRP dowels remained at about 80 percent with good base condition. With poor base condition, LTE reduced from 88 percent to 55 percent
(92.1 percent of the 60 percent LTE which corresponded to the ACPA-recommended value on joint effectiveness (E) of 75 percent). The poor base condition was observed with a concave slab-base surface due to aggregate compaction and base settlement. Also, it should be noted that the slabs were not cast directly on top of the aggregates, which led to some aggregate repositioning under fatigue loading. The modulus of subgrade reaction k was found changed from
11.072 to 22.144 kg/cm3 (400 to 800 pci) after 5 million cycles in poor base condition.
To find the condition of the interface between the FRP dowel and the concrete, slab number 4 was separated by cutting the FRP dowels after 5 million cycles of HS25 and higher loading. The dowel-concrete interface was found to be in good shape with no visible micro cracks (figure 44).
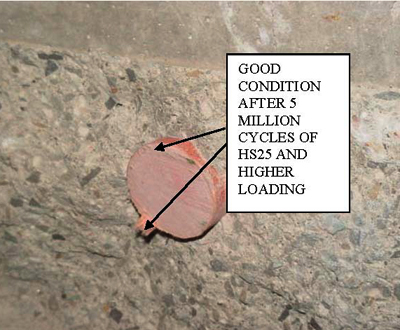
Figure 44. Photo. Dowel-concrete interface condition in slab number 4
after 5 million load cycles.
Slab Number 5:
LTE of slab number 5 under static and fatigue loads are shown in figure 45 and figure 46, respectively.
1 kip = 4.448 kN
Figure 45. Chart. Joint LTE for slab number 5.
1 kip = 4.448 kN
Figure 46. Graph. LTE under fatigue test for slab number 5 (0 to 5 million cycles).
Analysis and Discussion for Joint LTE
Analysis and Discussion for Slab Group 1 (15.24-cm (6-inch) Spacing):
Test results are summarized in table 18 and table 19.
Table 18. LTE of group 1 from static tests.
Slab Number |
LTE (percent) |
1 |
97.79 |
2 |
94.13 |
3 |
93.33 |
Table 19. LTE of group 1 during fatigue tests.
Specimen Number |
LTE ( percent) |
1 M |
2 M |
4 M |
5 M |
Proper Crack at Mid-joint |
1 |
93.79
(joint width = 0.25 inch) |
89.71*† |
68.88*† |
71.57*† |
Yes |
2 |
95.52 |
93.33† |
— |
— |
No |
3 |
99.69 |
— |
— |
— |
No |
* Joint width was increased to 1.016 cm (0.4 inch).
† An overload factor of 1.5 was used so that 1.5 times HS25 load was applied for specimens 1 and 2 during fatigue tests and started from 2 million cycles.
— No loading at corresponding cycles.
1 kip = 4.448 kN
The following can be said:
- In static tests, all slabs provided good LTE, which was greater than 60 percent of LTE (corresponding to 75 percent of joint effectiveness, E).(9) Slab number 1 (2.54-cm (1.0-inch)diameter FRP dowel with 15.24-cm (6-inch) spacing) with proper crack formation at the mid-joint had a greater than 90 percent LTE, which was slightly larger than the LTE for slab number 2 (2.54-cm (1.0-inch)-diameter steel dowel with 15.24-cm (6-inch) spacing) and slab number 3 (3.81-cm (1.5-inch)-diameter FRP dowel with 15.24-cm (6-inch) spacing). Slabs number 2 and 3 had crack formation away from the mid-joint (table 7). In slab number 1, the dowel worked as per design to transfer maximum load.(11)
- Even when 1.5 times the design load (HS25 loading) and an influence of increased joint width (increased from 0.635 to 1.016 cm (0.25 to 0.4 inch) were considered, the observed LTE in slab number 1 was consistent (reduced from 93.79 to 71.57 percent) due to the right crack position and still higher than 60 percent of LTE (corresponding to 75 percent of joint effectiveness, E).(11)
- Pumping and erosion under the loaded side of the slabs was observed during the tests. This could be the main reason that LTE of slab number 1 was reduced. Base settlement was also a reason for reduced LTE. Therefore, base property (such as k, modulus of subgrade reaction) should be checked before and after each fatigue test.
Analysis and Discussion for Slab Group 2 (30.48 cm (12-inch) Spacing):
Tests results are summarized in table 20 and table 21.
Table 20. LTE of group 2 from static tests under corresponding HS25 load.
Slab Number |
LTE (percent) |
4 |
88.48 |
5 |
89.00 |
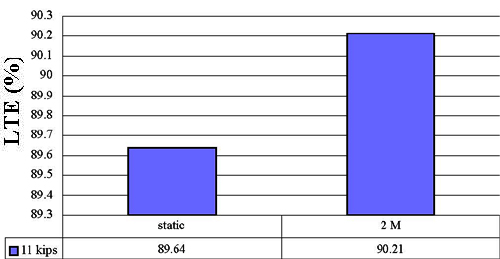
Table 21. LTE of group 2 from fatigue tests.
Slab Number |
LTE (percent) |
2 M |
4 M |
5 M |
4 |
85.1 |
— |
80.5 |
50.70* |
47.22 |
55.26* |
5 |
90.21 |
— |
— |
— No loading at corresponding cycles.
* Results from tests conducted on poor base condition.
The following can be found:
- Both slab number 4 and slab number 5 had proper crack occurrence at the joint.
- In static tests, both slabs had very good LTE, more than 88 percent, which was much greater than 60 percent of LTE (corresponding to 75 percent of joint effectiveness, E). Thus, FRP dowels performed as well as steel dowels and showed LTE as good as steel dowels in the static tests.(11)
- After 2 million HS25 fatigue loading cycles, for the same dowel diameters and spacing, the concrete pavement containing FRP dowels provided slightly lower LTE (85.1 percent versus 90.21 percent) than pavement containing steel dowels (table 21). With poor base condition, the LTE of slabs with FRP dowels over steel dowels was 50.71 percent versus 90.21 percent.
- The LTE of slabs with FRP dowels remained greater than 80 percent after 5 million loading cycles.
Investigations on Pavement Pumping Problem
Pumping is a common problem occurring in concrete pavements due to the movement of material underneath the slab or ejection of material from underneath the slab as a result of water pressure. Pumping will cause decreased structural support of the slab, which can lead to linear cracking, corner breaks, and faulting.
Two cases of pumping tests were conducted (figure 47 and figure 48). In case one, base material under the loaded side of the slabs was removed for a 60.96-cm (2-ft) range to simulate the pumping problem occurring in the field (figure 47). These tests were conducted only on slab number 4 (3.81-cm (1.5-inch)-diameter FRP dowel at 30.48 cm (12 inches) c/c) and slab number5 (3.81-cm (1.5-inch)-diameter steel dowel at 30.48 cm (12 inches) c/c) up to 44.482 kN (10 kips). Test results are shown in figure 49 and figure 50 and in table 22 and table 23.
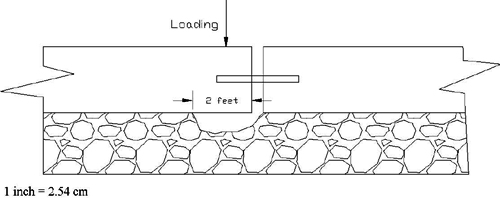
Figure 47. Diagram. Case one—60.96-cm (2-ft) base material removal
under loaded side of slabs.
Figure 48. Diagram. Case two—30.48-cm (1-ft) base material removal
under both sides of slabs.
1 kip = 4.448 kN
1 inch = 2.54 cm
Figure 49. Chart. RD for pumping tests (case one—60.96-cm (2-ft) base removal).
1 kip = 4.448 kN
Figure 50. Chart. LTE for pumping tests (case one—60.96-cm (2-ft) base removal).
Table 22. Evaluation of pumping issue under 44.482 kN (10 kips) loading.
| Test Case Number |
Dowel Material |
Relative Deflection
(× 10-3 inch) |
LTE (percent) |
| Case one (2-ft base removal under loaded slab) |
FRP (slab number 4) |
21.9 |
92.42 |
| Steel (slab number 5) |
6.4 |
98.21 |
| Case two (1-ft base removal under both slabs) |
FRP (slab number 4) |
— |
— |
| Steel (slab number 5) |
— |
— |
— No loading at corresponding cycles. 1 inch = 2.54 cm
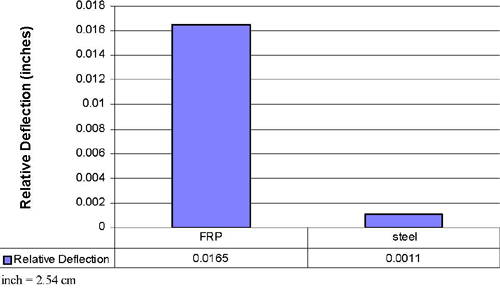
Table 23. Evaluation of pumping issue under 13.345 kN (3 kips) loading.
| Test Case Number |
Dowel Material |
Relative Deflection (× 10-3 inch) |
LTE (percent) |
| Case one |
FRP (slab number 4) |
13.5 |
88.00 |
| (2-ft base removal under loaded slab) |
Steel (slab number 5) |
6.4 |
97.15 |
| Case two |
FRP (slab number 4) |
16.5 |
91.95 |
| (1-ft base removal under both slabs) |
Steel (slab number 5) |
1.1 |
99.09 |
1 inch = 2.54 cm
In case two, base material under each side of the slabs was removed for a 30.48-cm (1-ft) range (figure 50). When loading exceeded 13.345 kN (3 kips), the joint opening closed, and the two faces of the joint bore against each other. Hence, tests were conducted only on slabs number 4 and 5 up to 13.345 kN (3 kips) in case two. Test results are shown in figure 51 and figure 52.
1 inch = 2.54 cm
Figure 51. Graph. RD for pumping tests under 13.345 kN (3 kips) loading
(case two—30.48-cm (1-ft) base removal under both slabs).
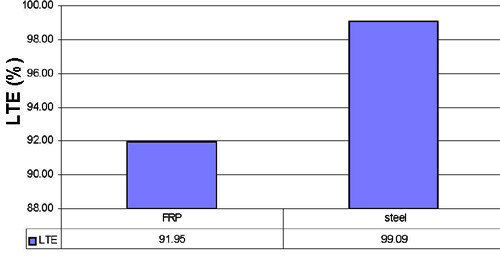
Figure 52. Graph. LTE for pumping tests under 13.345 kN (3 kips) loading
(case two—30.48-cm (1-ft) base removal under both slabs).
Test results from cases one and two are compared and summarized in table 22 and table 23. The following can be found:
- LTEs were observed in cases investigated for the simulated pavement pumping problem with supporting base removal up to a certain length near the joint (figure 47 and figure 48). LTEs were not less than the LTEs obtained from intact base condition (table 20). However, under fatigue load cycles, LTE was expected to reduce significantly for specimens without support near the joint.
- LTE obtained in case two (30.48-cm (1-ft) base material removal under both sides of slabs) was greater than 90 percent at 13.345 kN (3 kips) loading, and, after loading exceeded
13.345 kN (3 kips), two joint faces would bear against each other. Thus, case two (30.48-cm (1-ft) base removal under both slabs) with unsupported slab areas on both sides of the slab was more detrimental than case one (60.96-cm (2-ft) base removal under the loaded slab).
Strains on Dowels
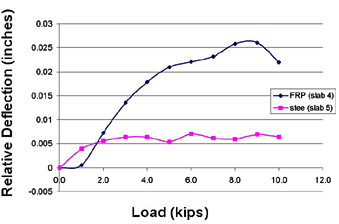
Most of the strain gauges installed on dowels survived before fatigue tests. However, some of them did not function properly after fatigue tests. Strain readings shown in this section are only from slab number 1 (2.54-cm (1.0-inch) diameter at 15.24-cm (6-inch) spacing c/c) (figure 53) and slab number 4 (3.81-cm (1.5-inch) diameter at 30.48-cm (12-inch) spacing c/c) (figure 54).
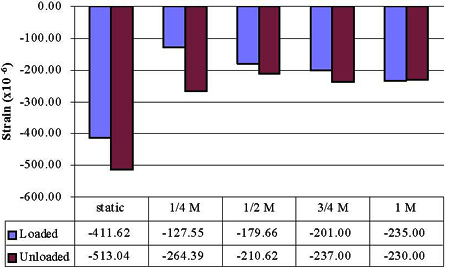
Figure 53. Graph. Strain gauge reading in slab 1 (2.54-cm (1.0-inch) diameter at 15.24-cm
(6-inch) spacing c/c) from static test to 1 million cycles under HS25 loading).
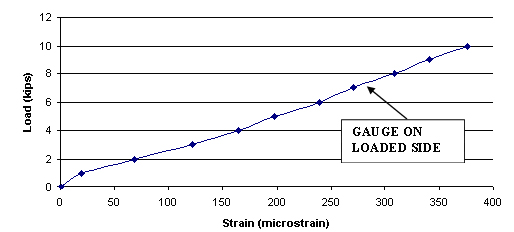
Figure 54. Chart. Strain gauge reading in slab number 4 (3.81-cm (1.5-inch)
diameter at 30.48-cm (12-inch) spacing c/c) from static test under HS25 loading.
Strain values at the unloaded side of dowels during static tests from slabs number 1 and 4 were 513.04 and 376.43 microstrains, respectively. Both values were less than those from analytical evaluation (ranges from 1,000 to 1,200 microstrains), but strain values were typically not used for LTE calculation. |


