U.S. Department of Transportation
Federal Highway Administration
1200 New Jersey Avenue, SE
Washington, DC 20590
202-366-4000


Skip to content
Facebook iconYouTube iconTwitter iconFlickr iconLinkedInInstagram

Federal Highway Administration Research and Technology
Coordinating, Developing, and Delivering Highway Transportation Innovations

Report
This report is an archived publication and may contain dated technical, contact, and link information
Publication Number: FHWA-HRT-06-106
Date: September 2009

Design and Evaluation of Jointed Plain Concrete Pavement With Fiber Reinforced Polymer Dowels

Previous | Table of Contents | Next

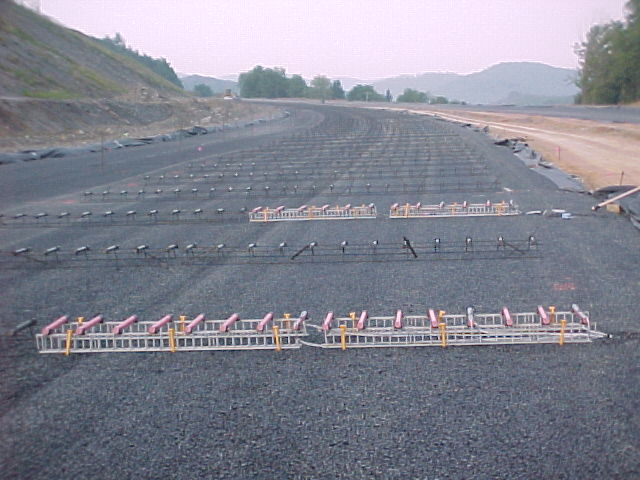
CHAPTER 5. FIELD APPLICATIONS AND TEST RESULTS

INTRODUCTION

Experimental tests and results discussed in chapter 4 show that FRP dowels can provide sufficient LTE under heavy traffic load rating (HS25 load and 1.5 times HS25). The purpose of the field test program was to investigate FRP dowel performance and FRP-concrete interaction in full-scale highway pavement slabs under realistic loading and field exposure conditions.

Field application and tests were done in collaboration with the WVDOT DOH. FRP dowels were used for new pavement construction and rehabilitation of damaged pavement sections. FRP dowel joints were used for new highway pavement construction on Route 219 and Route 33 East in Elkins, WV, from September to November 2001. Field tests were conducted in July 2002 and June 2003. FRP dowels were used for pavement rehabilitation at the junction of Routes 119 and 857, University Avenue, Morgantown, WV, during October 2002.

FRP DOWELS FOR NEW HIGHWAY PAVEMENT CONSTRUCTION

FRP dowels were used during the construction of new highway Route 219 and Route 33 East in Elkins, WV. The installation and field test setup are discussed in this section. Field test results are also analyzed and discussed.

Field Locations

Two locations separated by about 6.4 km (4 mi) were selected for field installations in corridor H highway at Route 219 and Route 33 in Elkins, WV. Location 1 (figure 55 and figure 56) was westbound, and location 2 (figure 57 and figure 58) was eastbound.

FRP dowel bar installation is shown in this photo at location 1 of corridor H project on Route 250, Elkins, WV. Two alternate rows of 16 fiber reinforced polymer (FRP) dowels each were placed on plastic baskets and anchored onto subgrade on the right side of the lane in the photo. The remainder of the dowel baskets in the right and left lanes are made of steel.
55 Figure. Photo. Dowel installation at location 1 of corridor H, Route 250, Elkins, WV.


This drawing represents a plan view of the positioning of FRP dowels in two rows at location 1 of corridor H, Route 250, Elkins, WV. Instrumented fiber reinforced polymer (FRP) dowels are shaded in this drawing. Design dowel spacing of 30.48 cm
Figure 56. Diagram.
FRP dowel positions at location 1 of corridor H, Route 250, Elkins, WV.

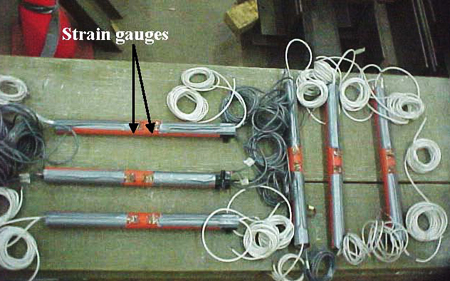
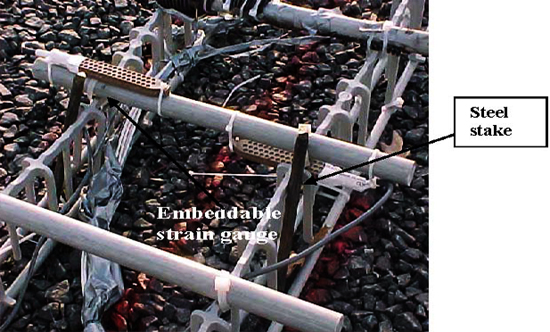
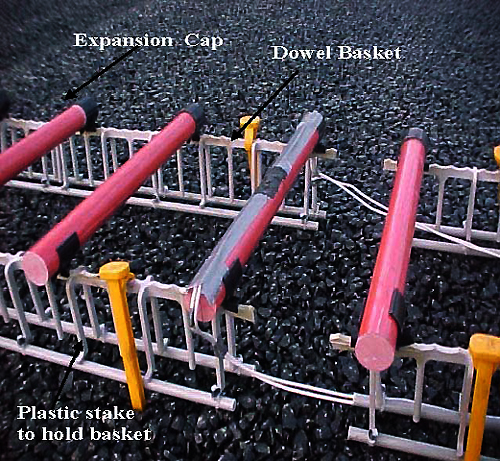
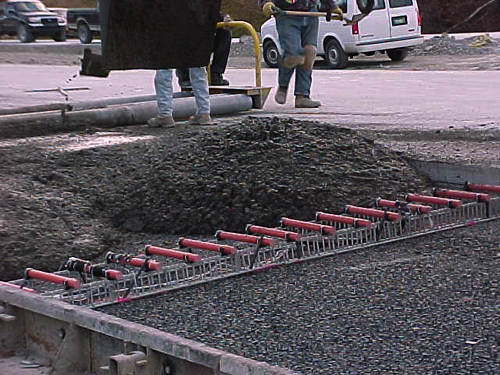
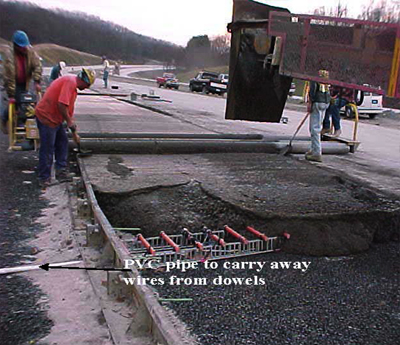
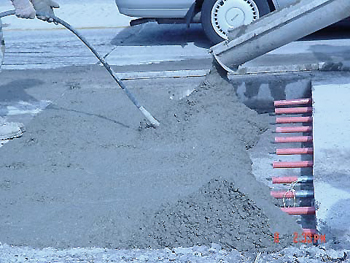
Only dowels with shading in figure 56 were instrumented.

This photo shows field installation of several rows of fiber reinforced polymer (FRP) dowel bars on baskets at location 2 of corridor H project on Route 219, Elkins, WV. Plastic pipes are shown on the shoulder side of the pavement which carries strain gauge wires from the instrumented dowels to outside of the shoulder region. Personnel involved in the project are also seen.
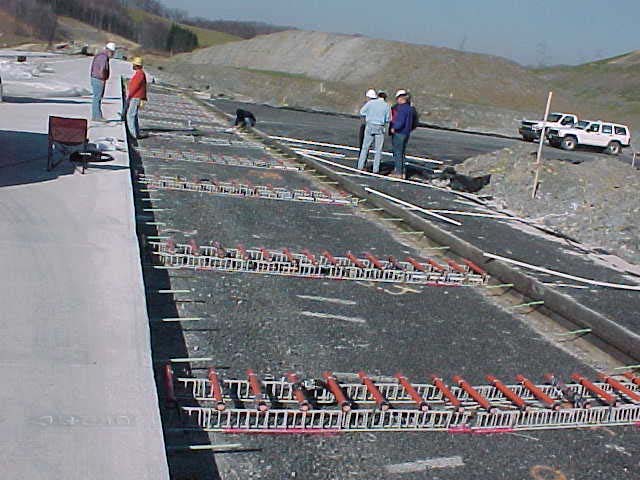
Figure 57. Photo. FRP dowel bars at location 2 of corridor H, Route 219, Elkins, WV.

Side pipes carried wires from instrumented dowels to the outside of the shoulder region (figure 57).
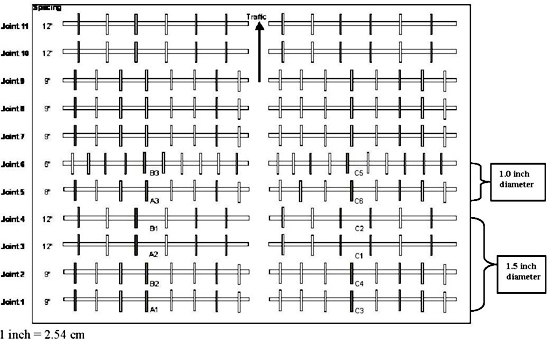
 This drawing shows a schematic top view and positioning of fiber reinforced polymer (FRP) dowel bars with diameters of 2.54 and 3.81 cm (1 and 1.5 inches) at different joint sections labeled as joint 1 to joint 11 at location 2 of corridor H project on Route 219, Elkins, WV. The dowel bars are shown as rectangles, and those with strain gauge attachment are shaded and labeled as A1, A2, A3, B1, B2, B3, C1, C2, C3, C4, C5 and C6. Traffic direction is shown with an arrow.

Figure 58. Diagram.
FRP dowel positions at location 2 of corridor H, Route 219, Elkins, WV.

Only dowels with shading in figure 58 were instrumented.

Field Installation

FRP dowels were instrumented with strain gauges (figure 59) to monitor strains in dowel bars installed in the field. Embeddable concrete strain gauges (figure 60) were also installed to monitor strains in the pavement.

Dowel bars with 2.54-cm (1.0-inch) diameter (figure 60) and 3.81-cm (1.5-inch) diameter (figure 61) were supported by plastic baskets at design spacings of 30.48, 22.86, 20.32, or 15.24 cm (12, 9, 8, or 6 inches) (figure 56 and figure 58). Plastic baskets were anchored by either steel stakes (figure 60) or plastic stakes (figure 61).

Construction was carried out as shown in figure 62 and figure 63. Wires from instrumented dowels were carried through hollow polyvinyl chloride pipes to the outside of the pavement shoulder (figure 63).

This photo shows six fiber reinforced polymer (FRP) dowel bars instrumented with strain gauges positioned on the top of dowels on both sides of mid-length monitoring strains in the pavement following their installation.
Figure 59. Photo. FRP dowel bars bonded with strain gauges at loaded and unloaded sides.


This photo shows an embeddable concrete strain gauge positioned on top of a dowel bar at one of the edges and another positioned close to the other edge below the dowel for monitoring pavement strains following concreting.
Figure 60. Photo. Embeddable concrete strain gauge with dowels.


This photo shows fiber reinforced polymer (FRP) dowel bars supported by plastic dowel baskets that are placed on the subgrade and anchored to it using plastic stakes. An expansion cap is also attached at the end of each FRP dowel.
Figure 61. Photo. FRP dowels in dowel basket.


This photo shows pavement construction as fiber reinforced polymer dowel bars supported on plastic baskets placed on the subgrade are being covered with concrete.
Figure 62. Photo. Paving operation in progress.


This photo shows part of the construction truck and construction crew participating in the construction of jointed plain concrete pavement. Fiber reinforced polymer (FRP) dowel bars are being covered by the concrete and a vibrator is being used for concrete compaction. Polyvinyl chloride pipes carrying the wires from the instrumented dowel bars are also seen.
Figure 63. Photo. FRP dowel bars being covered by concrete.

FIELD TESTS

Figure 64 shows a standard AASHTO Type 3 truck load that was used to carry out field evaluations before and after opening the pavement to the traffic.(12) Strain gauge readings were recorded prior to and after pavement construction (November 2001) and also during the field testing conducted in July 2002 and June 2003. The automatic data acquisition system was used to collect test data.

Field Test Before Opening Highway to Traffic in July 2002

A field test was completed before opening the pavement to traffic in July 2002. Static and dynamic tests including brake tests were conducted during this test. Parameters used for field testing are provided in table 24.

Table 24. Parameters of the field test at location 2, July 2002.
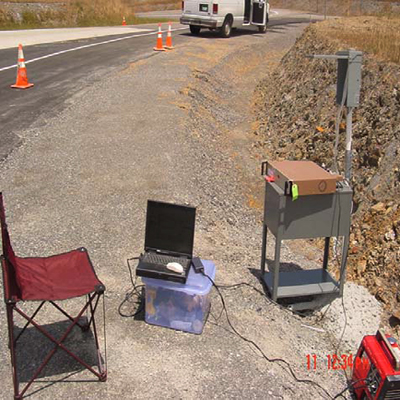

Dowel material

FRP

Dowel diameter

3.81 cm, 2.54 cm (1.5 inches, 1.0 inch)

fc

24.132 MPa (3,500 psi)

Dowel spacing

30.48 cm (12 inches), 3.81-cm (1.5-inch) diameter
22.86 cm (9 inches), 3.81-cm (1.5-inch) diameter
20.32 cm (8 inches), 2.54-cm (1.0-inch) diameter
15.24 cm (6 inches), 2.54-cm (1.0-inch) diameter

Type of loading

Truck type: AASHTO Type 3 (regular two-axle truck)
Gross weight: 22.680 metric tons (50,000 lb) (AASHTO)
Gross weight: 24.385 metric tons (53,760 lb) (actual)
Front axle: 7.257 metric tons (16,000 lb) (AASHTO)
Front axle: 7.158 metric tons (15,780 lb) (actual)
Rear axle: 15.422 metric tons (34,000 lb) (AASHTO)
Rear axle: 17.227 metric tons (37,980 lb) (actual)
Wheel load: 3.856 metric tons (8,500 lb) (AASHTO)
Wheel load: 4.307 metric tons (9,495 lb) (actual)

Types of tests

Static
Dynamic: 16.1, 32.2, 48.3, 80.5 km/h (10, 20, 30, 50 mi/h)
Brake test: speed of 80.5 km/h (50 mi/h)

Instrumentations

Strain gauges
Dial gauges for measuring pavement deflection
Data acquisition system

Measurements

Strain gauge reading
Pavement deflection

Computation

Strain versus loading history
LTE
RD

Test Setup

A WVDOT truck with calibrated loads was used in the tests (table 24). The truck was positioned at required locations to apply load on instrumented dowels (figure 58 and figure 64).

The loading test for a joint consisted of guiding a truck slowly toward the designated joint from about a 15.24-m (50-ft) distance. The unloading test for a joint consisted of guiding a truck initially placed on the pavement joint to leave the joint slowly.

All strain gauges on FRP dowels and embeddable concrete gauges were connected to data acquisition (figure 65). Dial gauges were fixed on a long, adjustable stand system. Dial gauges were positioned according to the spacing of dowels (figure 55 through figure 58) at the pavement joint considered for testing. The span of the dial gauge stand system was long enough to support it on adjacent pavement to avoid the influence of support deflections. Strains in dowels and deflection of pavement on loaded and unloaded sides of the joint were recorded.

This photo shows a rear view of a West Virginia Department of Transportation truck with calibrated loads. The truck is positioned at a concrete pavement joint with instrumented fiber reinforced polymer dowels. Slab deflections caused by the truck wheel load are being measured by a series of dial gauges suspended from a long metal frame resting on adjacent lanes.
Figure 64. Photo. Dial gauges for measuring pavement deflection under truck loading.


This photo shows the data acquisition system connected to strain gauges on fiber reinforced polymer dowel bars and embeddable concrete gauges in the pavement through a junction box on the roadside consisting of all wires from the pavement. Laptop computer, data acquisition unit, and a portable generator are also seen.
Figure 65. Photo. Data acquisition system used for field tests.

Test Results and Analysis

Strain Data from Field Static Tests:

About 60 percent of strain gauges installed on FRP dowels were found to be working properly after field installation and pavement construction. It was also found that some strain data recorded by the data acquisition system contained significant noise. Field test results of four cases of FRP dowels were analyzed.

Joints with different diameters and spacing have been described in this section. Data for brake tests and dynamic tests from different vehicle speeds are included.

Performance of FRP dowels with different diameters and/or spacings chosen from the field installation (table 25) are discussed in the next several sections with respect to the following:

  • FRP 3.81-cm (1.5-inch) diameter at 22.86 cm (9 inches) c/c (dowel A1, figure 66 and figure 67).
  • FRP 3.81-cm (1.5-inch) diameter at 30.48 cm (12 inches) c/c (dowel A2, figure 68 and figure 69).
  • FRP 2.54-cm (1.0-inch) diameter at 15.24 cm (6 inches) c/c (dowel C5, figure 70 and figure 71).
  • FRP 2.54-cm (1.0-inch) diameter at 20.32 cm (8 inches) c/c (dowel C6, figure 72 and figure 73).

Table 25. Joint details used for analysis.

Dowel Number Diameter, cm (inches) Spacing, cm (inches)
A1 3.81 (1.5) 22.86 (9)
A2 3.81 (1.5) 30.48 (12)
C5 2.54 (1.0) 15.24 (6)
C6 2.54 (1.0) 20.32 (8)


In this line diagram drawing, a side view of the instrumented dowel Al with a 3.81-cm (1.5-inch) diameter and 22.86-cm (9-inch) spacing under a truck wheel loading is shown. The dowel is labeled as side 1 and side 2 on either side of the joint location.

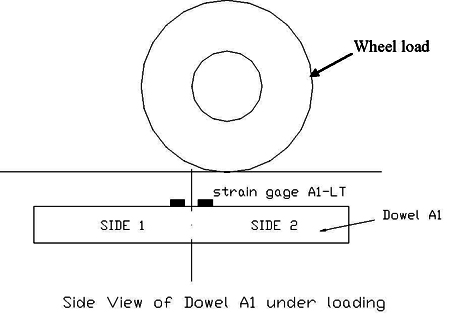
Figure 66. Diagram. Dowel A1 (3.81-cm (1.5-inch) diameter, 22.86-cm (9-inch) spacing);
refer to figure 58.


This chart shows loading time in seconds on the x-axis and strain in microstrains on the y-axis for both loading and unloading cases due to West Virginia Department of Transportation truck loading for gauge labeled as Al-LT mounted on the dowel bar which is 3.81 cm (1.5 inches) in diameter and spaced 22.86 cm (9 inches) from adjacent dowels. Maximum strain values for loading and unloading cases are minus 12 and plus

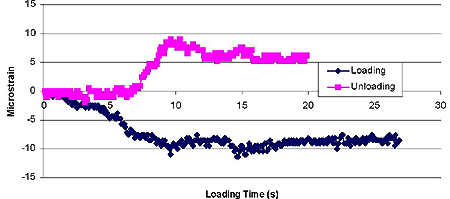
Figure 67. Chart. Strains in dowel during loading and unloading cases for gaugeA1-LT
(3.81-cm (1.5-inch) diameter, 22.86-cm (9-inch) spacing).


In this line diagram drawing, a side view of the instrumented dowel A2 with a 3.81-cm (1.5-inch) diameter and 30.48-cm (12-inch) spacing under the truck wheel loading is shown. The dowel is labeled as side 1 and side 2 on either side of the joint location.

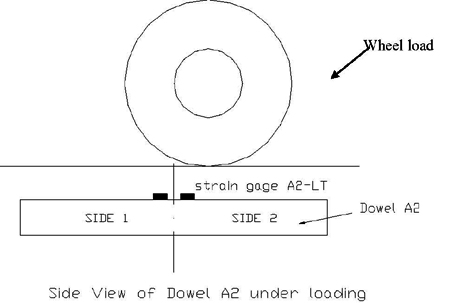
Figure 68. Diagram. Dowel A2 (3.81-cm (1.5 inch) diameter, 30.48-cm (12-inch) spacing);
refer to figure 58.


This chart shows loading time in seconds on the x-axis and strain in microstrains on the y-axis for both loading and unloading cases due to West Virginia Department of Transportation truck loading for gauge labeled as A2-LT mounted on the dowel bar which is 3.81 cm (1.5 inches) in diameter and spaced 30.48 cm (12 inches) from adjacent dowels. Maximum strain values for loading and unloading cases are minus 29 and plus 31 microstrains, respectively.

Figure 69. Chart. Strains in dowel during loading and unloading cases for gauge A2-LT
(3.81-cm (1.5-inch) diameter, 30.48-cm (12-inch) spacing); refer to figure 58.


In this line diagram drawing, a side view of the instrumented dowel C5 with a 2.54-cm (1.0-inch) diameter and 15.24-cm (6-inch) spacing under the truck wheel loading is shown. The dowel is labeled as side 1 and side 2 on either side of the joint location.
Side View of Dowel C5 under loading

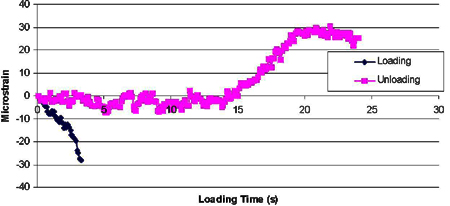
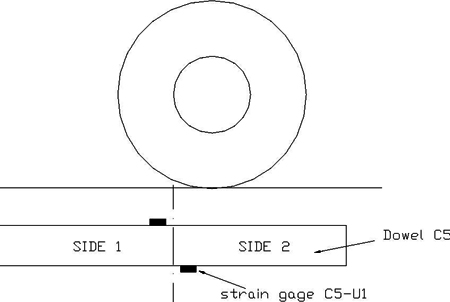
Figure 70. Diagram. Dowel C5 (2.54-cm (1.0-inch) diameter, 15.24-cm (6-inch) spacing);
refer to figure 58.


This chart shows loading time in seconds on the x-axis and strain in microstrains on the y-axis for both loading and unloading cases due to West Virginia Department of Transportation truck loading for the gauge labeled as C5-U1 mounted on the dowel bar, which is 2.54 cm (1.0 inches) in diameter and spaced 15.24 cm (6 inches) from adjacent dowels. Maximum strain values for loading and unloading cases are minus 3 and plus

Figure 71. Chart. Strains in dowel during loading case for gauge C5-U1 (2.54-cm (1.0-inch) diameter,
15.24-cm (6-inch) spacing); refer to figure 58.


Wheel load
This line diagram drawing shows a side view of the instrumented dowel C6 with a 
2.54-cm (1.0-inch) diameter and 20.32-cm (8-inch) spacing under the truck wheel loading. The dowel is labeled as side 1 and side 2 on either side of the joint location.

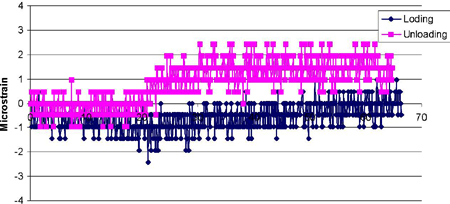
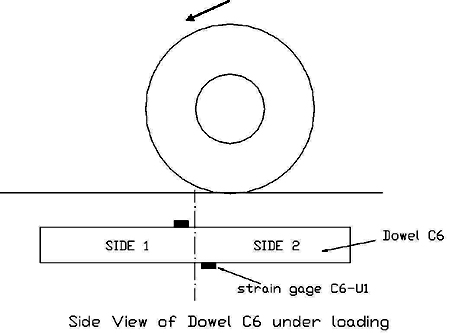
Figure 72. Diagram. Dowel C6 (2.54-cm (1.0-inch) diameter, 20.32-cm (8-inch) spacing);
refer to figure 58.


This chart shows loading time in seconds on the x-axis and strain in microstrains on the y-axis for both loading and unloading cases due to West Virginia Department of Transportation truck loading for the gauge labeled as C6-U1 mounted on the dowel bar, which has a 2.54-cm (1.0-inch) diameter and is spaced 20.32 cm (8 inches) from adjacent dowels. Maximum strain value for loading is plus 60 microstrains.

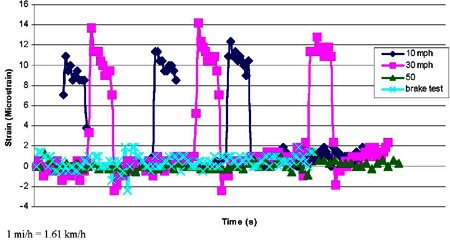
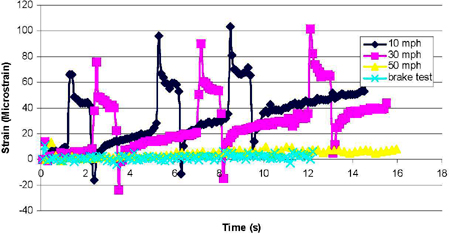
Figure 73. Strains on dowel during loading case for gauge C6-U1 (2.54-cm (1.0-inch)
diameter, 20.32-cm (8-inch) spacing); refer to figure 58.

Strain Data from Dynamic Tests:

Dynamic tests were conducted in this field evaluation. The loaded WVDOT truck with speeds of 16.09, 32.19, 48.28, and 80.47 km/h (10, 20, 30, and 50 mi/h) crossed the selected joint containing instrumented FRP dowels. Data were collected through the automatic data acquisition system during truck speeding and braking of the speeding truck at 48.28 km/h (30 mi/h) close to the joint. Test results are shown in figure 74 and figure 75.

This chart shows time in seconds on the x-axis and strain in microstrains on the y-axis under dynamic testing at 16.1, 48.3, and 80.5 km/h (10, 30, and 50 mi/h) and for brake testing for the gauge labeled as A1-LT mounted on the dowel bar, which is 3.81 cm (1.5 inches) in diameter and spaced 22.86 cm (9 inches) from adjacent dowels. Maximum strain values of about plus 14 microstrains and minus 2 microstrains are seen among different test cases.

Figure 74. Chart. Strain from gauge A1-LT (3.81-cm (1.5-inch)-diameter FRP dowel
at 22.86-cm (9-inch) spacing) from dynamic tests.


This chart shows time in seconds on the x-axis and strain in microstrains on the y-axis under dynamic testing at 16.1, 48.3, and 80.5 km/h (10, 30, and 50 mi/h), and for brake testing for the gauge labeled as A2-LT mounted on the dowel bar, which is 3.81 cm

Figure 75. Chart. Strain from gauge A2-LT (3.81-cm (1.5-inch)-diameter FRP dowel
at 30.48-cm (12-inch) spacing) from dynamic tests.

Dynamic test results recorded contained significant noise, and hence, data are not further discussed.

Analysis of test result:

Figure 66 through figure 73 show changes in dowel strain near pavement joints during truck loading and unloading. Stresses at points on inpidual dowels can also be obtained according to the stress-strain relationship under bending. Table 26 contains a summary of the above strain values.

Table 26. Summary of FRP dowel strain during loading and unloading.

Dowel No. Dowel Diameter (inches) Dowel Spacing (inches) Maximum Strain (microstrain)
Loading Unloading
A1 1.5 9 9 12
A2 1.5 12 31 29
C5 1.0 6 3 3
C6 1.0 8 60 N/A

1 inch = 2.54 cm

The following can be found from table 26:
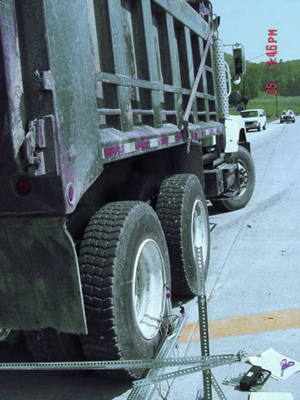
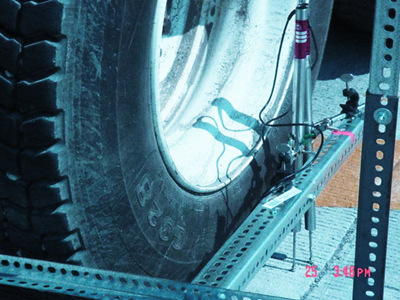
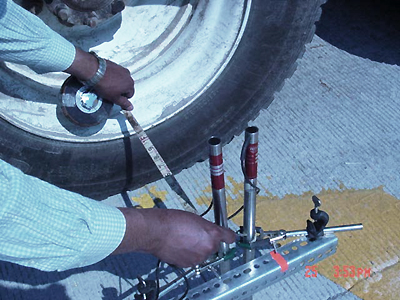
  • Change in strain value for the same dowel during loading and unloading cases was almost the same.
  • Effect of dowel spacing:
    • For FRP dowels (A1 and A2) with 3.81-cm (1.5-inch) diameters, dowel A2 with larger spacing (30.48 cm (12 inches)) had a greater strain change (31 microstrain) than dowel A1 with 22.86-cm (9-inch) spacing (change of 9 microstrain). Similarly, for FRP dowels C5 and C6 with the same 2.54-cm (1.0-inch) diameter, the dowel C5 with smaller spacing(15.24 cm (6 inches)) showed a small strain change (3 microstrain) when compared with C6 with 20.32-cm (8-inch) dowel spacing (60 microstrain).
    • Decreasing the spacing by 25 percent (from 30.48 to 22.86 cm (12 to 9 inches) and from 20.32 to 15.24 cm (8 to 6 inches) resulted in more dowels sharing the load within the radius of relative stiffness (lr, chapter 6), leading to 30 percent or higher strain reductions in dowels.
    • For FRP dowels with 2.54-cm (1.0-inch) diameter (C5 and C6), a spacing increase from 15.24 to 20.32 cm (6 to 8 inches) had a greater influence on strain value change (3 versus 60 microstrain) than the increase of spacing from 22.86 to 30.48 cm (9 to 12 inches) in dowels (A1 and A2) with 3.81-cm (1.5-inch) diameters (9 versus 31 microstrain).
    • Dowels with different diameters and spacings could be compared with each other with strain value only. Because FRP dowels acted as a group, spacing and diameter were both important factors for the group action. It should also be noted that FRP dowels with smaller diameter typically had better mechanical properties per unit area than larger-diameter dowels due to shear lag effects (refer to chapter 6).

Deflection Data:

The WVDOT truck was guided toward the pavement joint on top of the chosen dowel location so that a heavier wheel load, which was located in the rear axles, could be applied. Pavement deflections increased when the WVDOT truck slowly approached the joint, but most of the deflection changes were less than the detectable range of the dial gauges with a count of 0.0254 cm (0.001 inch). In the second field test, LVDTs were used instead of dial gauges for better precision in deflection detection.

Field Test after Highway Opened to Traffic, June 2003

This field test was conducted about 1 year after opening the pavement to traffic. Test parameters are listed in table 27. They are similar to those for the first field test, except that the deflection measurements were made using LVDTs, and there were no dynamic/brake tests. The main purpose of this field test was to investigate deflection behavior and LTE of concrete pavement joints with different diameters and spacing of FRP dowel bars. Figure 76 through figure 79 show details of the field test setup.

Table 27. Parameters of the field test, June 2003.


Dowel material

FRP

Dowel diameter

3.81 and 2.54 cm (1.5 and 1.0 inches)

fc

24.132 MPa (3,500 psi)

Dowel spacing

30.48, 22.86, 20.32, and 15.24 cm
(12, 9, 8, and 6 inches)

Type of loading

AASHTO Type 3 (regular two-axle truck) loaded truck, similar to the one described in table 24

Types of tests

Static

Instrumentations

Strain gauges
LVDT for measuring pavement deflection
Data acquisition system

Measurements

Pavement deflection
Strain

Computation

LTE
RD

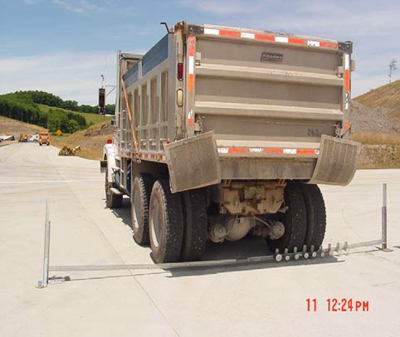
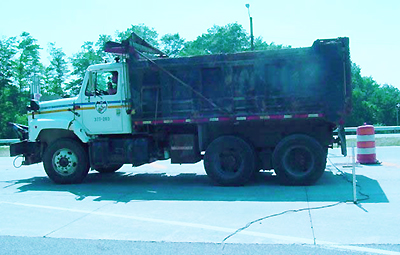
It should be noted that the wheel load due to AASHTO HS25 is 9.071 metric tons (20,000 lbs), which is about twice the WVDOT truck wheel load used for this test. Under the AASHTO wheel load, larger deflections and strains can be expected.

This photo shows a side view of the West Virginia Department of Transportation (WVDOT) truck used for field test loading on the concrete pavement joint with fiber reinforced polymer dowels. A metal stand assembly supporting dial gauges and the linear variable differential transformer including the wire running from the linear variable differential transformer are also seen.

Figure 76. Photo. WVDOT truck used for field tests.


This photo shows the rear wheels of a loaded West Virginia Department of Transportation (WVDOT) truck which is positioned near the pavement joint for load testing. Linear variable differential transformers used for measuring deflection are supported on a metal frame.
Figure 77. Photo. WVDOT truck positioned near a joint for the test.


This photo shows a close up view of figure 77 where rear wheels of the loaded West Virginia Department of Transportation truck are positioned near the pavement joint for load testing. Also visible are linear variable differential transformers (LVDT) used for measuring deflection across a joint, which are supported on a metal frame.
Figure 78. Photo. Two LVDTs measuring pavement deflections across a joint.


In this photo, the distance of linear variable differential transformer (LVDT) from the West Virginia Department of Transportation truck tire is measured because the embedded dowel on which the LVDT is placed is away from the tire.
Figure 79. Photo. Measuring distance from tire to LVDTs
(when loading is away from the selected dowel).

Test Results from Field Test

Four concrete pavement joints with instrumented dowels were tested during the second field test. Details of the joints and FRP dowels are shown in table 28.

Table 28. Pavement joint for deflection analysis.

Joint Number Dowel Bar Diameter, cm (inches) Dowel Bar Spacing, cm (inches) Data Sets Analyzed
3 3.81 (1.5) 30.48 (12) 2
2 3.81 (1.5) 22.86 (9) 2
5 2.54 (1.0) 20.32 (8) 1
6 2.54 (1.0) 15.24 (6) 1

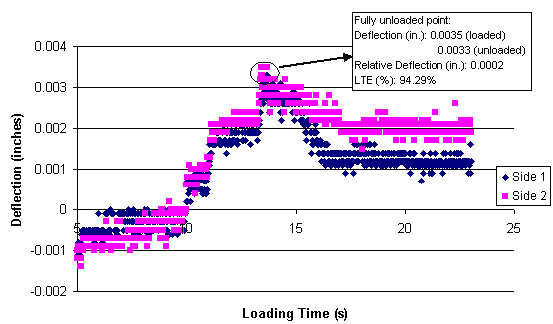
Test results are shown in figure 80 through figure 86 and further analyzed in the next section.
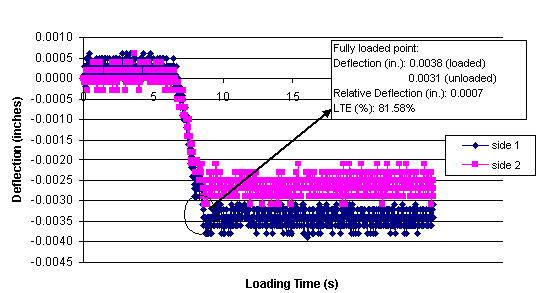
This chart shows loading time in seconds on the x-axis and deflection in inches on the
1 inch = 2.54 cm
Figure 80. Chart. Deflection on pavement joint 3 (with 3.81-cm (1.5-inch)-diameter
and 30.48-cm (12-inch)-spacing FRP dowels) under loading.


This chart shows loading time in seconds on the x-axis and deflection in inches on the
1 inch = 2.54 cm
Figure 81. Chart. Deflection on pavement joint 2 (with 3.81-cm (1.5-inch)-diameter
and 22.86-cm (9-inch)-spacing FRP dowels) under unloading.


This chart shows loading time in seconds on the x-axis and deflection in inches on the
1 inch = 2.54 cm
Figure 82. Chart. Deflection on pavement joint 2 (with 3.81-cm (1.5-inch)-diameter
and 22.86-cm (9-inch)-spacing FRP dowels) under loading.


This chart shows loading time in seconds on the x-axis and deflection in inches on the
1 inch = 2.54 cm
Figure 83. Chart. Deflection on pavement joint 5 (with 2.54-cm (1.0-inch)-diameter
and 20.32-cm (8-inch)-spacing FRP dowels) under loading


This chart shows loading time in seconds on the x-axis and deflection in inches on the

1 inch = 2.54 cm
Figure 84. Chart. Deflection on pavement joint 6 (with 2.54-cm (1.0-inch)-diameter
and 15.24-cm (6-inch)-spacing FRP dowels) under loading.

>Summary and Analysis of Test Results

A summary of the test results shown in figure 80 through figure 84 is provided in table 29 in terms of pavement deflection, LTE, and RD for pavement joints having 3.81- and 2.54-cm (1.5- and 1.0-inch)-diameter FRP dowels with different spacings of 30.48, 22.86, 20.32, and 15.24 cm (12, 9, 8, and 6 inches).

Table 29. Summary of joint deflection under maximum loading force.


Joint Number (Diameter and Spacing)—
Refer to Table 28

Pavement Deflection
(10-4 inch)

LTE (percent)

RD
(10-4 inch)

Loaded side

Unloaded side

Joint 3
(1.5 inch at
12 inches c/c)

38

31

81.58

7

Joint 2
1st and 2nd
(1.5 inch at
9 inches c/c)

35

33

94.29

2

56

53

94.64

3

Joint 5
(1.0 inch at
8 inches c/c)

20

19

95.00

1

Joint 6
(1.0 inch at
6 inches c/c)

18

17

94.44

1

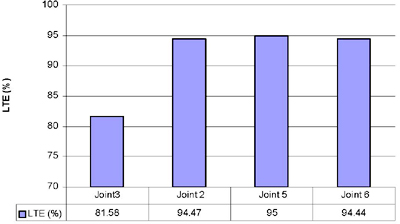
1 inch = 2.54 cm

Values in table 29 cannot be compared to each other directly because, in addition to diameter and spacing, deflections depended on combinations of other parameters such as base/sub-base properties, contact area between concrete and base, and others. It should also be noted that truck wheel load position on dowels embedded in concrete may vary from one dowel to the other.

The pavement surface was serrated to provide friction, and hence, there was the possibility of LVDT shaft tips sliding into those slots and showing slightly higher deflections. However, additional tests will be conducted in the future to compare LTE and RD. For this field test, LTE is shown in figure 85 and table 30, and RD is shown in figure 86 and table 31.

This graph represents load transfer efficiency (LTE) at different joints. The bars represent LTE at joint 3, joint 2, joint 5, and joint 6 to be 81.58, 94.47, 95, and 94.44 percent, respectively. Joints 3 and 2 have 30.48- and 22.86-cm (12- and 9-inch) spacing, respectively, for dowel bar diameters of 3.81 cm (1.5 inches). Joints 5 and 6 have 20.32- and 15.24-cm (8- and 6-inch) spacing, respectively, for dowel bar diameters of 2.54 cm (1 inch).

Figure 85. Graph. Comparison of LTE from field test (average value was used for joint 2).


Table 30. Values for LTE Comparison from field test.

Joint 3

Joint 2

Joint 5

Joint 6

LTE (percent)

81.58

94.47

95

94.44

Diameter (inches)

1.5

1.5

1.0

1.0

Spacing (inches)

12

9.0

8.0

6.0


This graph represents relative deflections at different joints. The bars represent relative deflections at joint 3, joint 2, joint 5, and joint 6 to be 0.00178, 0.000635, 0.00254, and 0.00254 cm (0.0007, 0.00025, 0.0001, and 0.0001 inch) respectively. Joints 3 and 2 have 30.48- and 22.86-cm (12- and 9-inch) spacing, respectively, for dowel bar diameters of 3.81 cm (1.5 inch). Joints 5 and 6 have 20.32- and 15.24-cm (8- and 6-inch) spacing, respectively, for dowel bar diameters of 2.54 cm (1.0 inch).

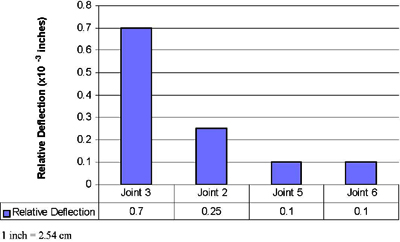
Figure 86. Graph. Comparison of RD from field test (average value was used for joint 2).


Table 31. Comparison of RD values from field test.

Joint 3

Joint 2

Joint 5

Joint 6

Relative deflection
(× 10-3 inch)

0.70

0.25

0.10

0.10

Diameter (inches)

1.5

1.5

1.0

1.0

Spacing (inches)

12

9.0

8.0

6.0

1 inch = 2.54 cm

Table 32. Comparing joint 2 and 3.

Joint 2,
2.54 cm at 22.86 cm
(1.5 inches at
9 inches) c/c

Joint 3,
2.54 cm at
30.48 cm
(1.5 inches at
12 inches) c/c

Percentage of Difference
(percent)

LTE

94.47

81.58

15.8

Relative deflection
(× 10-3 inch)

0.25

0.70

64.3

1 inch = 2.54 cm

The following can be observed from this table:

  • Both 3.81-cm (1.5-inch)-diameter FRP dowel groups and 2.54-cm (1.0-inch)-diameter FRP dowel groups with spacing varying from 30.48 to 15.24 cm (12 to 6 inches) provided very good LTE (greater than LTE of 60 percent, which corresponds to ACPA's 75 percent joint effectiveness value).
  • For dowel groups in pavement joints 2 and 3 that had the same dowel diameter (3.81 cm (1.5 inches)), joint 2, with smaller dowel spacing (22.86 cm (9 inches)), had higher LTE (94 percent) than that provided by joint 3, with 30.48-cm (12-inch) dowel spacing (81.58 percent). Additional tests will be conducted on other joint locations.
  • Joint 2, with 22.86-cm (9-inch) dowel spacing, had smaller RD (6.35 × 10⁻³ mm (0.25 × 10⁻³ inch)) than joint 3, with 30.48-cm (12-inch) dowel spacing (17.78 × 10⁻³ mm (0.70 × 10⁻³ inch)) for a dowel diameter of 3.81 cm (1.5 inches).
  • Joint 2, with 22.86 cm (9 inches) of spacing), provided a 15.4-percent increase in LTE in addition to a 64.3-percent reduction in RD compared with joint 3, with 30.48-cm (12-inch) spacing for a dowel diameter of 3.81 cm (1.5 inches) (refer to table 28).
  • For pavement joints 5 and 6 (with 2.54-cm (1.0-inch) dowel diameters, 20.32- and 15.24-cm (8.0- and 6.0-inch) dowel spacing, respectively), the LTEs were very close (95 percent and 94.44 percent). Relative joint deflections were also similar(2.54 × 10⁻³ cm (1 × 10⁻³ inch)).
  • Currently, there is no requirement or limitation for the RD from AASHTO's Guide for Pavement Structures. (1)

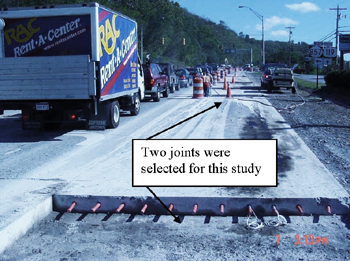
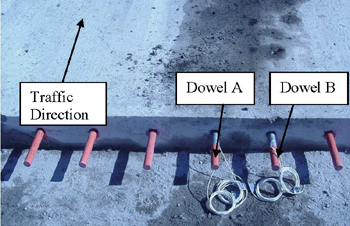
FRP DOWELS USED FOR HIGHWAY PAVEMENT REHABILITATION

FRP dowels were used for pavement rehabilitation at the junction of Routes 119 and 857, University Avenue, Morgantown, WV. Two joints were selected; one with 3.81-cm (1.5-inch)diameter FRP dowels and 30.48-cm (12-inch)-c/c spacing, the other with 3.81-cm (1.5-inch) diameter steel dowels at 30.48-cm (12-inch)-c/c spacing. Dowel installation and field test setup are discussed in this section. Test results from both FRP and steel dowels are analyzed and discussed under the results and analysis subsection.

Field Location

Two joints were selected for rehabilitation of an existing pavement near the junction of Routes 119 and 857, University Avenue, Morgantown, WV, as shown in figure 87. Rehabilitation was carried out in October 2002.
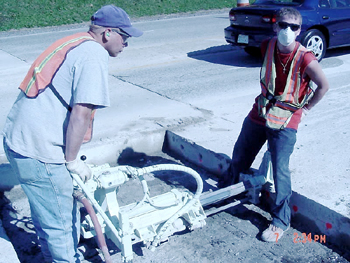
This photo shows the fiber reinforced polymer (FRP) and steel dowel bar locations in a pavement with concrete removed for rehabilitation purposes and dowels inserted into the visible pavement cross sectional area of the right lane. Two of the joints selected for rehabilitation of an existing pavement near junction of Route 119 and Route 857, University Avenue, Morgantown, WV, are shown, and vehicular traffic is seen on the adjacent left lane.
Figure 87. Photo. Locations of FRP and steel-doweled pavement joints.

Field Installation

Deteriorated concrete slabs were cut by a special concrete sawcutting machine and then lifted out. Next, 3.81-cm (1.5-inch)-diameter holes were drilled through the concrete slabs up to 22.86 cm (9 inches) deep (half of dowel length). Each pavement joint consisted of 11 dowels with 3.81-cm (1.5-inch) diameters spaced at 30.48 cm (12 inches) c/c. Each joint was provided with two instrumented dowels. Strain gauges were bonded onto both top and bottom surfaces of those dowels prior to installation. Strain gauges were about 1.27 cm (0.5 inch) away from the centerline of the joint.

After positioning dowels in the drilled holes, epoxy resin was filled into the circumferential gap between concrete and dowel. Rehabilitation carried out using FRP and steel dowels is shown in figure 88 through figure 91.
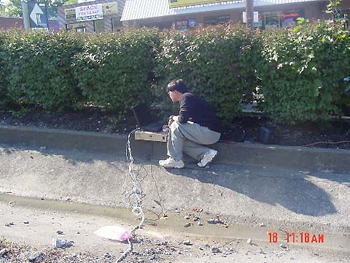
This photo shows holes being drilled by two persons on the side of the concrete pavement slab cut to insert fiber reinforced polymer dowel bars during the rehabilitation process.
Figure 88. Photo. Drilling holes for inserting dowels.


This photo shows fiber reinforced polymer (FRP) dowels that are positioned in the concrete pavement slab, where a portion of the concrete is sliced and removed for rehabilitation. Two wires attached to strain gauges of dowel bars, designated as dowel A and dowel B, as well as the traffic direction are shown.
Figure 88. Photo. Drilling holes for inserting dowels.


This photo shows steel dowel bars that are positioned in the pavement slab where a portion of concrete is sliced and removed for rehabilitation. Two wires attached to strain gauges of dowel bars, designated as dowel C and dowel D, as well as the traffic direction are shown.
Figure 90. Photo. Steel dowels in position.


In this photo, concrete is being poured from the chute of a concrete mixer truck and vibrated in the pavement section removed for rehabilitation.
Figure 91. Photo. Concrete placement and vibration.

FIELD TESTS

Test Setup

A standard truck load was not used for field loading purposes. Strain readings due to regular traffic (figure 87), including some loaded trucks driving at 32.2–64.4 km/h (25–40 mi/h) were recorded using an automatic data acquisition system (figure 92). Due to the heavy traffic volume existing at this road section, pavement deflection measurements were not recorded.
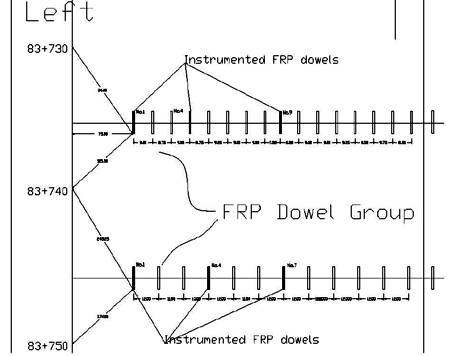
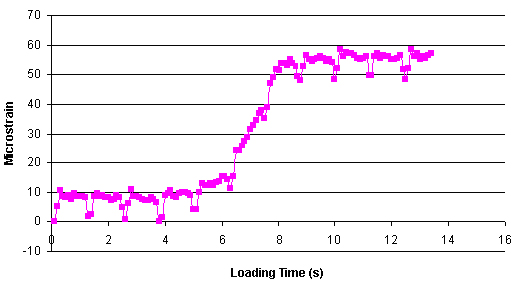
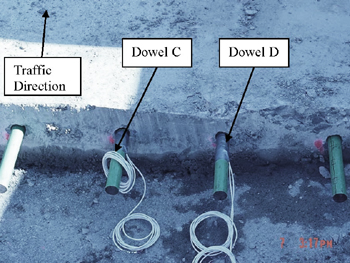
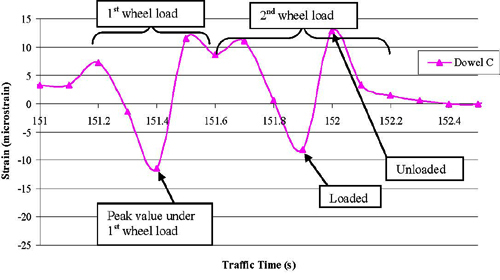
This photo shows monitoring of strain gauge readings due to traffic load on fiber reinforced polymer and steel dowel bars embedded in the rehabilitated pavement. The data are being recorded through a data acquisition system by a Constructed Facilities Center, West Virginia University member.
Figure 92. Photo. Data acquisition recording strain readings.

Results and Analysis

Both strain gauges were installed in the vehicle-approaching side (figure 89 through figure 91) of the pavement joint. Hence, before a vehicle wheel crossed the joint, the strain gauge side of the joint remained the loaded side, and, right after the wheel crossed a joint, the strain gauge side became the unloaded side.

Strain readings due to a truck load from regular traffic are shown in figure 93 and figure 94.

FRP Dowel Group

Strain gauge readings from two instrumented FRP dowels (dowel A and dowel B in figure 89) are discussed in this section. Data from strain gauges mounted on top of these dowels are shown in figure 93. Note that not all data due to continuous traffic are plotted in figure 93; only strain values from a truck load with maximum values are shown.

This chart shows traffic time in seconds (s) on the x-axis and longitudinal dowel strain in microstrains on the y-axis due to traffic loads on the rehabilitated pavement. Variations of strains due to first wheel load and the second wheel load on dowel A and dowel B are represented. The peak strain values for dowel A and dowel B under first wheel load at 346.2 s is minus 52.5 and minus 65.8 microstrains, respectively. Dowel A and dowel B are fully loaded under the second wheel load at 346.8 s of traffic time. At 346.9 s, the last wheel has crossed the joint.

Figure 93. Chart. Strain from FRP dowels in rehabilitated pavement.

Strain gauge data between recorded traffic time of 345.9 and 346.5 s correspond to the movement of the first wheel load. Due to truck load, maximum strains (-52.52 and -65.8 microstrain) occurred when the wheel loads were close to the joint in adjacent dowels. Based on strain values, it appears that the front axle carried more load than the rear axle, and vehicle impact factor could have also played a role.

Strain gauge data between the recorded traffic time of 346.7 and 347.5 s correspond to the movement of the last wheel load crossing the joint. During this time period, gauges from FRP dowels A and B experienced a strain change from loaded status (-28.17 and -36.24 microstrain) to unloaded status (31.04 and 17.16 microstrain), respectively. The total strain change was 59.21 (28.17 + 31.04) microstrain for dowel A and 53.4 (36.24 + 17.16) microstrain for dowel B. The ratio of unloaded value to loaded value was 31.04/28.17 = 1.10 (dowel A) and 17.16/36.24 = 0.47 (dowel B). These ratios indicate the possibility of the wheel loads crossing at an angle over the dowel. It should be noted that the pavement was on an upward gradient with respect to traffic direction.

Steel Dowel Group

Strain gauge readings from one instrumented steel dowel (dowel C in figure 90) are discussed here. Data from the strain gauge mounted on top of this dowel are shown in figure 94. Note that not all data due to continuous traffic are plotted in figure 94; only strain values in dowel C from a truck load with maximum values are shown.

This chart shows traffic time in seconds (s) on the x-axis and longitudinal dowel strain due to traffic loads on the rehabilitated pavement in microstrains on the y-axis. Variations of strains due to first wheel load and the second wheel load on dowel A and dowel B are represented. The peak strain value for dowel C under first wheel load is minus 12 microstrains at 151.4 s. The peak strain values for dowel C under second wheel load due to loading and unloading are minus 8.14 and plus 12.93 microstrains, respectively.
Figure 94. Chart. Strain from steel dowel in rehabilitated pavement.

Strain gauge data between traffic time 151.2 and 151.6 s correspond to the movement of the first wheel load crossing the joint. Maximum compressive strains occurred at the beginning of the load, which was -11.49 microstrain, which may partly include vehicle impact effect.

Strain gauge data between traffic time 151.8 and 152.2 s correspond to the movement of the last wheel load crossing the joint. During this time period, gauges from steel dowel C experienced a strain change from loaded status (-8.14 microstrain) to unloaded status (12.93 microstrain), respectively. The total strain change was 21.07 (8.14 + 12.93) microstrain for dowel C. The ratio of unloaded value to loaded value was 12.93/8.14 = 1.59 (dowel C). The following factors contributed to this ratio of unloaded/loaded strain > 1, where readings appeared to be from those vehicles just beginning to accelerate from their stopped position near traffic lights at junction:

  • Pavement rehabilitated with dowels was situated on an upward gradient.
  • Dowels on the upward portion of the joint were bonded to the concrete with epoxy.

CONCLUSION

From both the first and second field tests conducted on the newly constructed highway in Elkins, WV (see chapter 5), it is concluded that change in strain value for the same dowel during loading and unloading cases was almost the same.

Effect of Dowel Spacing

  • For dowel groups in pavement joints 2 and 3 that had the same dowel diameter (3.81 cm (1.5 inches)), joint 2, with smaller dowel spacing (22.86 cm (9 inches)), had higher LTE (94 percent) than that provided by joint 3, with 30.48-cm (12-inch) dowel spacing (81.58 percent). This was attributed to the smaller dowel spacing used in joint 2, which resulted in more dowels sharing the load within the radius of relative stiffness. In addition, the larger-than-expected difference in LTE for 22.86-cm (9-inch) and 30.48-cm (12-inch) spacing will be investigated in future tests.
  • Joint 2, with 3.81-cm (1.5-inch)-diameter dowels and 22.86-cm (9-inch) spacing, had smaller RD (6.35 × 10⁻³ mm (0.25 × 10⁻³ inch)) than joint 3, with the same diameter bar and 30.48-cm (12-inch) spacing (17.78 × 10⁻³ mm (0.70 × 10⁻³ inch)).
  • Joint 2, with 3.81-cm (1.5-inch)-diameter dowels and 22.86-cm (9-inch) spacing, provided a 15.4-percent increase in LTE in addition to a 64.3-percent reduction in RD compared with joint 3, with 3.81-cm (1.5-inch)-diameter dowels and 30.48-cm (12-inch) spacing; refer to table 28.
  • For pavement joints 5 and 6 with 2.54-cm (1.0-inch)-dowel diameter, 20.32-cm (8.0-inch) and 15.24-cm (6.0-inch) dowel spacing, respectively, the LTEs were very close (95 and 94.44 percent). Relative joint deflections were also similar (2.54 × 10⁻³ cm (1 × 10⁻³ inch)).
  • For FRP dowels (A1 and A2) with 2.54-cm (1.5-inch) diameters, dowel A2 with larger spacing (30.48 cm (12 inches)) had a greater strain change (31 microstrain) than dowel A1 with 22.86-cm (9-inch) spacing (9 microstrain). Similarly, for FRP dowels C5 and C6 with the same 2.54-cm (1.0-inch) diameter, the dowel C5 with smaller spacing (15.24 cm (6 inches)) showed small strain change compared to C6 with 20.32-cm (8-inch) dowel spacing (3 versus 60 microstrain).
  • Thus, decreasing the spacing by 25 percent (30.48 to 22.86 cm (12 to 9 inches) and 20.32 cm to 15.24 cm (8 to 6 inches)) resulted in more dowels sharing the load within the radius of relative stiffness (lr, chapter 6), leading to 30 percent or higher strain reductions in dowels.
  • For FRP dowels with 2.54-cm (1.0-inch) diameters (C5 and C6), the spacing increase from 15.24 to 20.32 cm (6 to 8 inches) had a greater influence on strain value change (3 versus 60 microstrain) than the increase of spacing from 22.86 to 30.48 cm (9 to 12 inches) in dowels (A1 and A2) with 3.81-cm (1.5-inch) diameters (9 versus 31 microstrain).
  • Dowels with different diameters and spacing could not be compared directly by strain value only. Because FRP dowels act as a group, spacing and diameter are both important factors for the group action. It should be also noted that FRP dowels with smaller diameters typically had better mechanical properties per unit area than larger-diameter dowels due to shear lag effects (refer to chapter 6).
  • Dynamic test results recorded contained significant noise, and hence, data are not further discussed.

Effect of Dowel Diameter

Both 3.81-cm (1.5-inch)-diameter FRP dowel groups and 2.54-cm (1.0-inch)-diameter FRP dowel groups with spacing varying from 30.48 to 15.24 cm (12 to 6 inches) provided very good LTE (greater than LTE of 60 percent, which corresponds to ACPA's 75 percent joint effectiveness value). Currently, there is no requirement or limitation for the RD from AASHTO's Guide for Pavement Structures.(1) From field tests, the maximum RD was 17.78 × 10⁻³ mm (0.70 × 10⁻³ inch), but, from lab testing, it was a maximum of 10.922 × 10⁻³ mm (43 × 10-3 inch) (table 16). It should be noted that joint width was due to different joint models and thermal variables.

From field tests conducted on the rehabilitated pavement in Morgantown, WV (see chapter 5), the following is concluded:

  • Strains at loaded and unloaded status from FRP dowels (A and B) (28.17 and 36.24 micro-strain) were greater than that from steel dowels (C) (11.49 microstrains), which conforms to the analytical finding that shorter lengths are required for FRP dowels than for steel dowels (refer to figure 108).
  • The strain value ratio from the same gauge at unloaded status to loaded status did not represent real LTE.
  • It was suggested that LTE should be discovered from measuring pavement deflection.

Previous | Table of Contents | Next