U.S. Department of Transportation
Federal Highway Administration
1200 New Jersey Avenue, SE
Washington, DC 20590
202-366-4000
Federal Highway Administration Research and Technology
Coordinating, Developing, and Delivering Highway Transportation Innovations
| REPORT |
| This report is an archived publication and may contain dated technical, contact, and link information |
|
| Publication Number: FHWA-HRT-11-058 Date: December 2011 |
Publication Number: FHWA-HRT-11-058 Date: December 2011 |
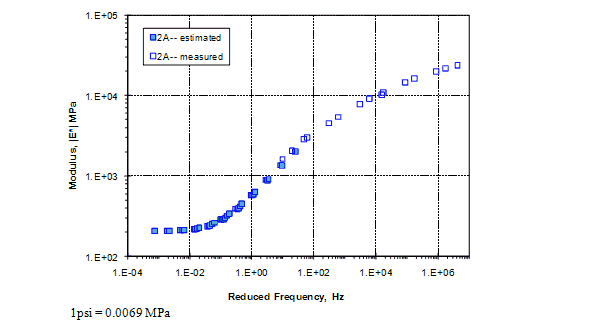
Figure 54. Graph. Contractor 2 evaluation of blending from master curves: mix A.
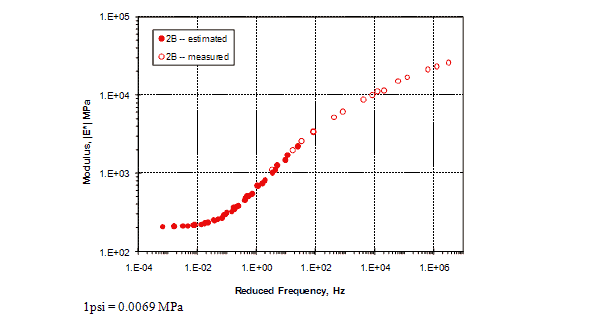
Figure 55. Graph. Contractor 2 evaluation of blending from master curves: mix B.
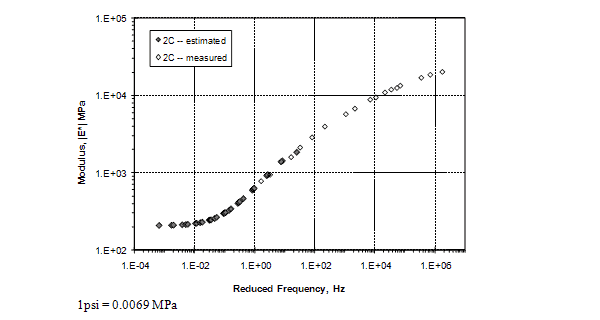
Figure 56. Graph. Contractor 2 evaluation of blending from master curves: mix C.
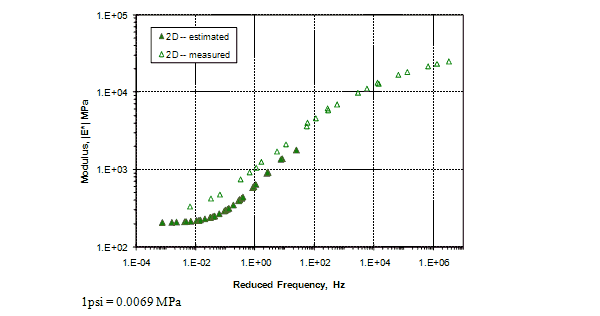
Figure 57. Graph. Contractor 2 evaluation of blending from master curves: mix D.
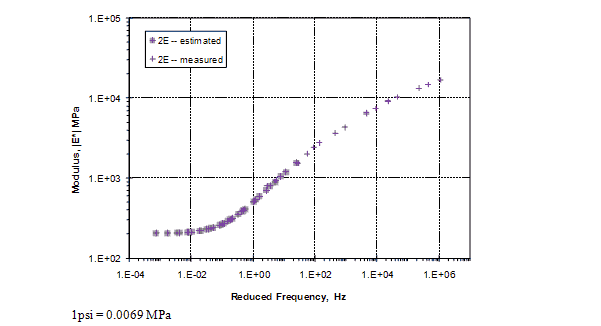
Figure 58. Graph. Contractor 2 evaluation of blending from master curves: mix E.
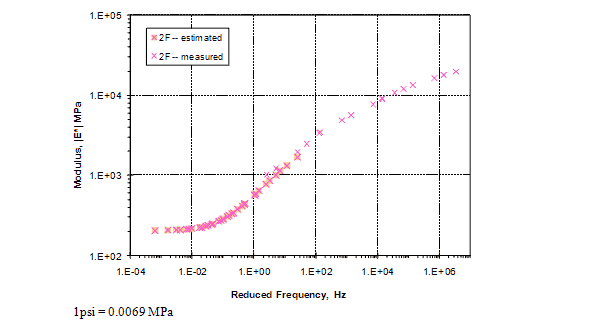
Figure 59. Graph. Contractor 2 evaluation of blending from master curves: mix F.
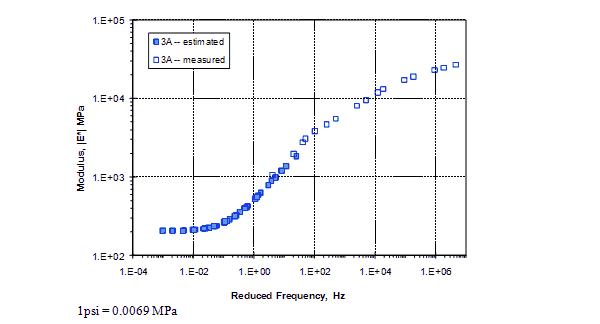
Figure 60. Graph. Contractor 3 evaluation of blending from master curves: mix A.
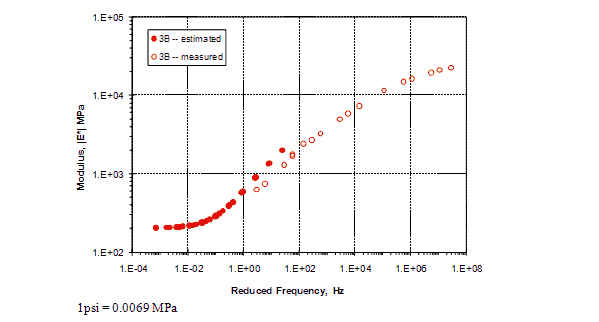
Figure 61. Graph. Contractor 3 evaluation of blending from master curves: mix B.
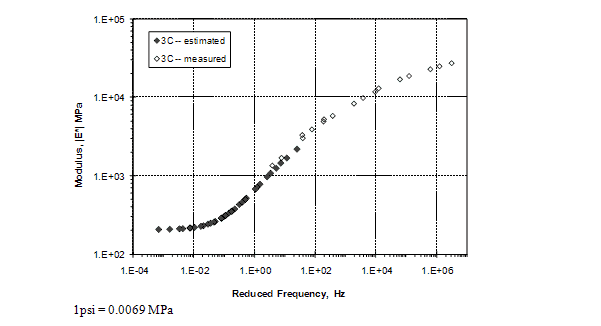
Figure 62. Graph. Contractor 3 evaluation of blending from master curves: mix C.
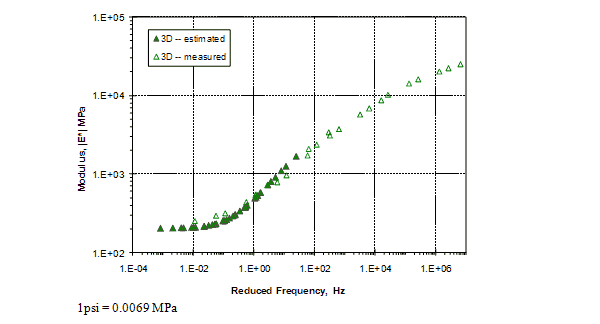
Figure 63. Graph. Contractor 3 evaluation of blending from master curves: mix D.
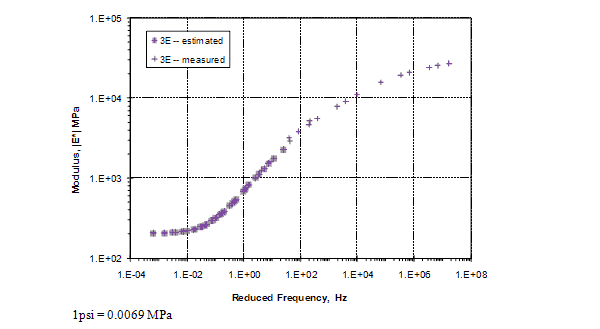
Figure 64. Graph. Contractor 3 evaluation of blending from master curves: mix E.
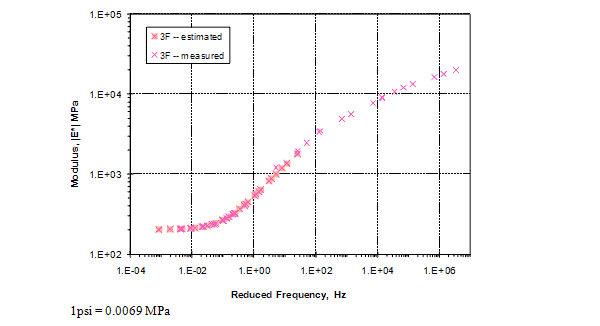
Figure 65. Graph. Contractor 3 evaluation of blending from master curves: mix F.
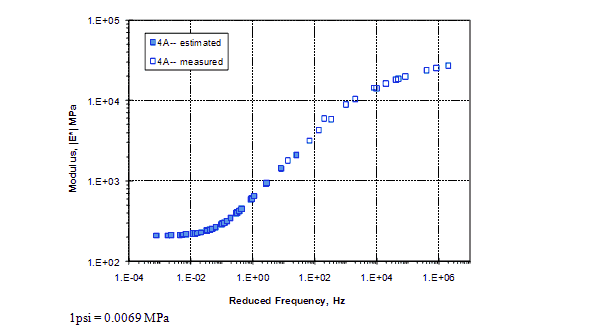
Figure 66. Graph. Contractor 4 evaluation of blending from master curves: mix A.
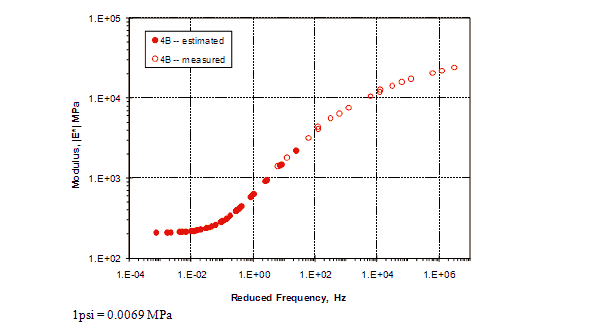
Figure 67. Graph. Contractor 4 evaluation of blending from master curves: mix B.
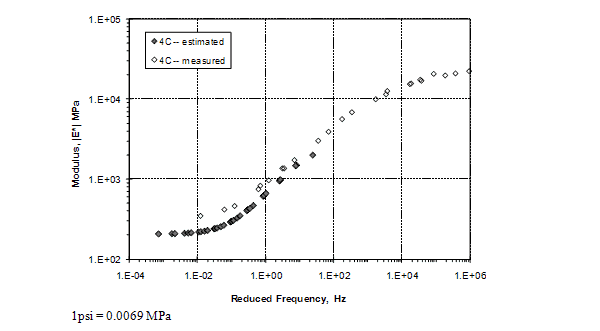
Figure 68. Graph. Contractor 4 evaluation of blending from master curves: mix C.
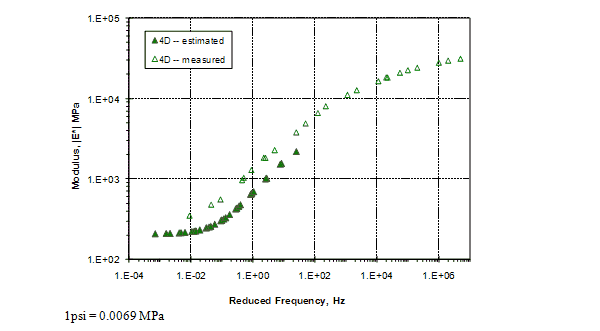
Figure 69. Graph. Contractor 4 evaluation of blending from master curves: mix D.
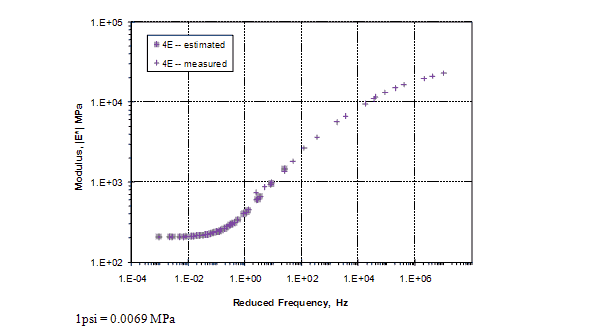
Figure 70. Graph. Contractor 4 evaluation of blending from master curves: mix E.
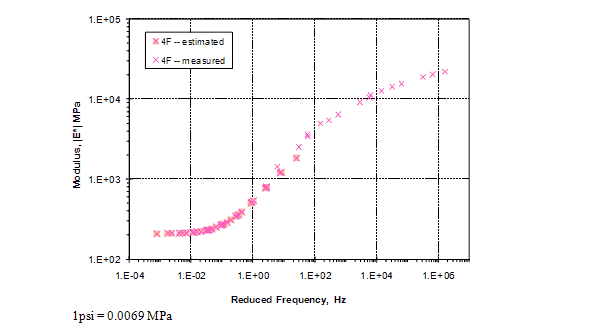
Figure 71. Graph. Contractor 4 evaluation of blending from master curves: mix F.
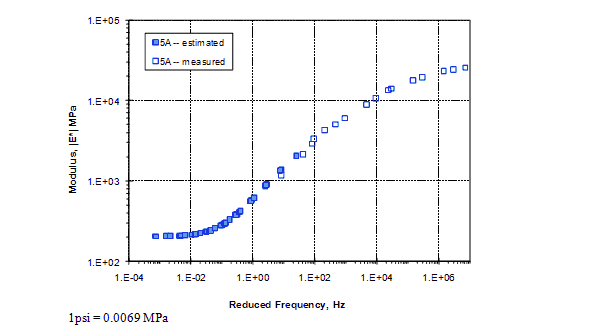
Figure 72. Graph. Contractor 5 evaluation of blending from master curves: mix A.
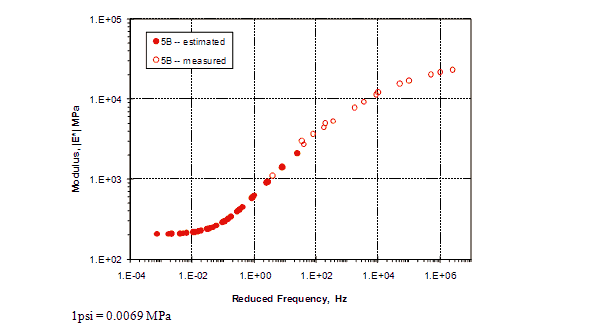
Figure 73. Graph. Contractor 5 evaluation of blending from master curves: mix B.
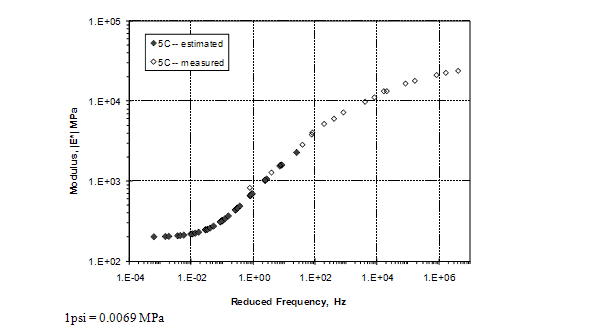
Figure 74. Graph. Contractor 5 evaluation of blending from master curves: mix C.
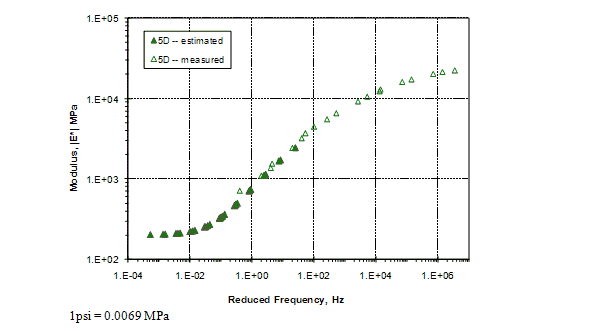
Figure 75. Graph. Contractor 5 evaluation of blending from master curves: mix D.
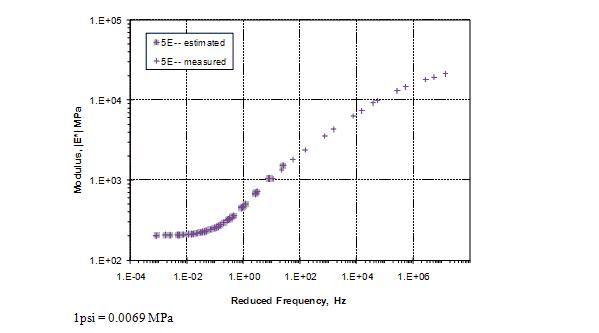
Figure 76. Graph. Contractor 5 evaluation of blending from master curves: mix E.
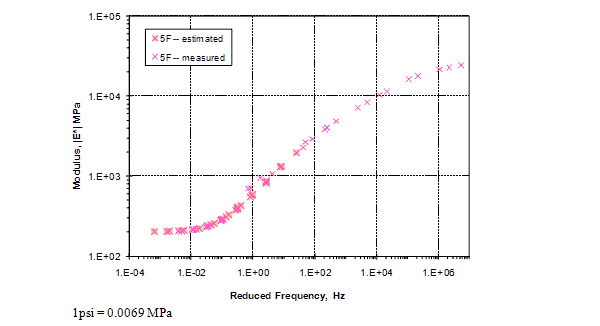
Figure 77. Graph. Contractor 5 evaluation of blending from master curves: mix F.