U.S. Department of Transportation
Federal Highway Administration
1200 New Jersey Avenue, SE
Washington, DC 20590
202-366-4000
Federal Highway Administration Research and Technology
Coordinating, Developing, and Delivering Highway Transportation Innovations
| REPORT |
| This report is an archived publication and may contain dated technical, contact, and link information |
|
| Publication Number: FHWA-HRT-16-010 Date: March 2017 |
Publication Number: FHWA-HRT-16-010 Date: March 2017 |
Project 32-0200 is a part of Interstate 80 (I-80) in Lander County, NV. This pavement section was selected as the case study for rigid pavement rehabilitation alternatives. Specifically, test section 32-0203 was selected as a rigid pavement cross section with a JPCP and granular base layer over subgrade. This section is representative of the following selection factors:
|
This project was first introduced into the LTPP Program as a Specific Pavement Study (SPS) in January 1993 and was recorded as construction number 1. Construction number 2 was posted in October 1995 when crack sealing was carried out. Crack sealing was performed again in September 1997, which was referred to as construction number 3. According to the LTPP Program data, the JPCP design consisted of a 295‑mm (11.6‑inch) PCC surface layer, a 5.7‑inch (145‑mm) dense graded aggregate base, a 20‑inch (513‑mm) granular subbase, and a subgrade of which the top 12 inches (305 mm) was treated with lime.
Distress survey results, in terms of joint faulting and slab cracking, were available in the LTPP Program database from 1996 to 2003. According to the records, faulting did not exceed 0.1 inch (2.5 mm) until 2003. However, when considering slab cracking, the studied pavement section was in very poor condition.
Table 37 presents the number of cracks identified for test section 32‑0203 from 1996 to 2003. To convert the number of cracks to the percentage of slabs cracked, the assumption that only one transverse crack occurred within each slab can be made. The section was 500 ft (152.5 m) long, which may have consisted of 33 to 34, 15‑ft (4.6‑m) slabs per lane. Based on table 37, all the slabs were cracked by 2003, and rehabilitation was needed.
| Survey Date | No. of Low-Severity Transverse Cracks | No. of Medium-Severity Transverse Cracks | No. of High-Severity Transverse Cracks | Total No. of Transverse Cracks |
|---|---|---|---|---|
| 3/26/1996 | 50 | 2 | 1 | 53 |
| 12/15/1998 | 0 | 119 | 11 | 130 |
| 11/17/1999 | 2 | 0 | 127 | 129 |
| 6/14/2000 | 3 | 0 | 178 | 181 |
| 4/24/2001 | 1 | 0 | 163 | 164 |
| 6/25/2002 | 13 | 0 | 164 | 177 |
The use of the MEPDG for design requires determination of a significant number of inputs, even for a level 3 analysis. Most of the required inputs can be obtained from the LTPP Program database for test section 32‑0203. However, none of the project 32‑0200 sections had a complete set of data available for the rehabilitation design using the MEPDG. Therefore, data from sections adjacent to test section 32‑0203 were also used to help define the necessary inputs.
Deflection data collected in 1995, 1996, 2000, 2002, and 2003 for test section 32‑0203 was available in the LTPP Program database.
Equipment
Deflection testing was conducted with a Dynatest® model 8000 FWD.
Sensor Configuration
The sensors configuration for the FWD testing is presented in table 38.
| Configuration | Sensor Number | ||||||||
|---|---|---|---|---|---|---|---|---|---|
| 1 | 2 | 3 | 4 | 5 | 6 | 7 | 8 | 9 | |
| Offset (inches) | 0 | 8 | 12 | 18 | 24 | 36 | 48 | 60 | -12 |
| 1 inch = 2.54 mm. | |||||||||
Number of Drops and Load Levels
Four load level targets (6,000, 9,000, 12,000, and 16,000lb (2,724, 4,086, 5,448, and 7,264 kg)) with four drops at each load level were performed and recorded. Seating drops were also performed, but data were not recorded.
Test Locations/Lanes and Increments
The locations of the LTPP Program FWD testing are presented in table 39. The test location used to backcalculate the PCC elastic modulus and the modulus of subgrade reaction was J1. In addition, to determine the presence of loss of support, the test results at location J2 were used, and the results from locations J4 and J5 were used to establish the characteristics of joint load transfer. The pavement deflections were measured at 10 different locations along the section between 10:58 a.m. and 2:08 p.m. The distance between tests conducted at mid‑slab varied between 30 and 70 ft (9.2and 21.4 m), whereas the testing performed along the pavement edge and at the corners was at intervals varying between 9 and 23 ft (2.7 and 7 m).
| LTPP Code | Location |
|---|---|
| J1 | JPCP middle lane at middle panel |
| J2 | JPCP pavement edge at corner |
| J3 | JPCP pavement edge at mid panel |
| J4 | JPCP load transfer outer wheelpath at joint approach |
| J5 | JPCP load transfer outer wheelpath at joint leave |
| J6 | JPCP outer wheelpath at mid-panel (SPS-4) |
| J7 | JPCP pavement edge at corner on widen lane SPS-2 sections |
| J8 | JPCP pavement edge at mid panel on widen lane SPS-2 sections |
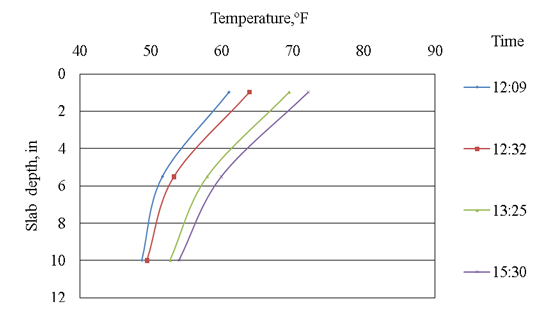
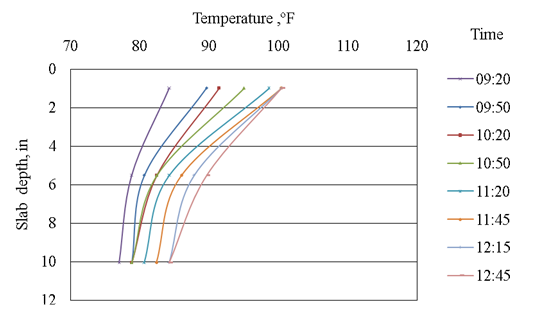
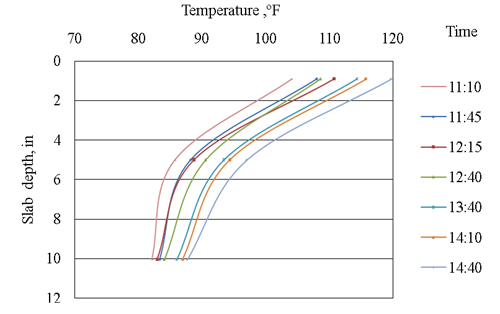
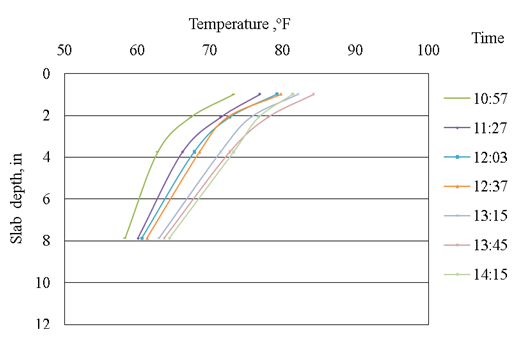
Slab temperature measurements were recorded at depths of 1, 5.5, and 10 inches (25.4, 139.7, and 254 mm) in drilled holes at half‑hour intervals during the deflection testing in 1996, 2000, and 2002. For the test performed in 2003, the temperatures were taken at depths of 1, 2, 3.7, and 7.9 inches (25.4, 50.8, 94, and 200.7 mm). Slab temperatures measured in conjunction with the FWD tests on test section 32‑0203 from 1996 to 2003 were extracted from the LTPP Program database and presented in figure 40 to figure 43. As observed in these figures, slab temperatures are season and time dependent. For instance, the average slab temperature for the 1996 test that was carried out in late March was 58 °F (14.4 °C), whereas the average temperature for the 2002 test performed in late June was 96 °F (35.6 °C). The effect of the slab temperature distribution on the backcalculation results is discussed in the following sections.
1 inch = 2.54 cm.
°F = 1.8 × °C + 32.
Figure 40. Graph. Slab temperatures for the FWD test performed on 03/26/1996—sunny to partly cloudy.
1 inch = 25.4 mm.
°F = 1.8 × °C + 32.
Figure 41. Graph. Slab temperatures for the FWD test performed on 06/15/2000—sunny.
1 inch = 25.4 mm.
°F = 1.8 × °C + 32.
Figure 42. Graph. Slab temperatures for the FWD test performed on 06/25/2002—sunny to cloudy.
1 inch = 25.4 mm.
°F = 1.8 × °C + 32.
Figure 43. Graph. Slab temperatures for the FWD test performed on 10/28/2003—sunny.
This section summarizes the data obtained from LTPP database for test section 32‑0203 regarding its subgrade, base, subbase, PCC material properties, traffic, climate, and depth of water table or stiff layer.
Subgrade
Samples were retrieved from the subgrade to determine the soil classification according to the AASHTO system.(2) Although the subgrade of test section 32‑0203 was not sampled, it was assumed to consist of AASHTO A‑4 soil in this study because this test section was located between test sections 32‑207 and 32‑211, which both had AASHTO A‑4 subgrades. The top 305 mm (12 inches) of the subgrade was treated with lime.
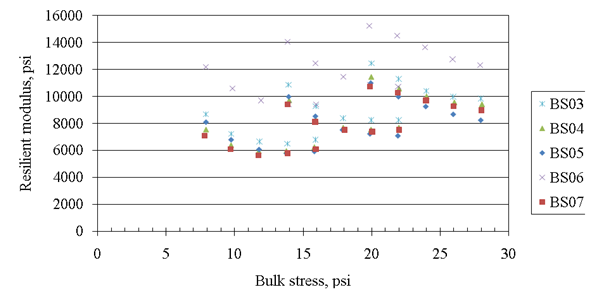
Laboratory resilient modulus testing was performed on several subgrade samples. In total, sixspecimens were tested for the project 32‑0200 sections, five of which were from sections that had AASHTO A‑4 subgrade. The results are depicted in figure 44. The sample ID is used as legend in figure 44, which also indicates from which section the sample was collected
(see table 40).
1 psi = 6.89 kPa.
Figure 44. Graph. LTPP Program data of laboratory resilient modulus testing for the subgrade.
No laboratory tests were performed on the Poisson’s ratio, coefficient of lateral pressure, or Atterberg limits for any of this pavement section. The Atterberg limits were established only on one sample (BS01 from test section 32‑0205), which yielded liquid and plastic limits of 42 and 23 percent, respectively. However, test section 32‑0205 was defined to have AASHTO A‑7‑6 subgrade, and the Atterberg limits could not be used for test section 32‑0203. Therefore, the default values suggested for AASHTO A‑4 subgrade in the MEPDG were used. The average moisture content was 16.3 percent.
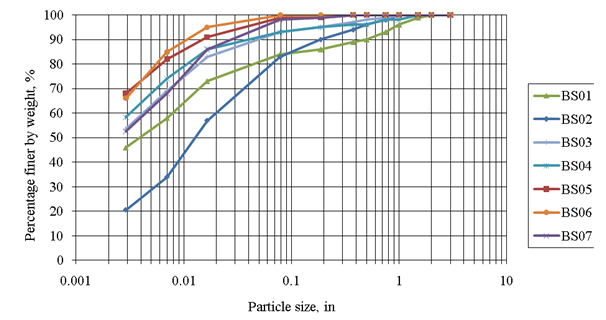
The particle gradation is summarized in table 40; gradation is also illustrated in figure 45. This was based on the assumption that test section 32‑0211, the closest section to test section 32‑0203, had the same subgrade as test section 32‑0203.
| Sieve Size | Average Percent Passing |
|---|---|
| 3 inch | 100.0 |
| 2 inch | 100.0 |
| 1.5 inch | 99.9 |
| 1 inch | 99.1 |
| 3/4 inch | 98.3 |
| 1/2 inch | 97.1 |
| 3/8 inch | 96.6 |
| No. 4 | 94.9 |
| No. 10 | 92.9 |
| No. 40 | 81.6 |
| No. 80 | 67.1 |
| No. 200 | 52.1 |
| 1 inch = 25.4 mm. | |
1 inch = 25.4 mm.
Figure 45. Graph. Gradation of the subgrade samples.
Granular Subbase
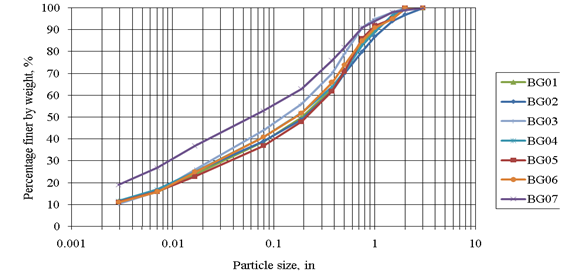
Aggregate gradation for the subbase material is summarized in table 41, with gradation also illustrated in figure 46. Average moisture content was determined to be 6.0 percent. No information regarding the Atterberg limits was available for the subbase, so the default values for crushed gravel were used for the analysis.
| Sieve Size | Average Percent Passing |
|---|---|
| 3 inch | 100.0 |
| 2 inch | 99.4 |
| 1.5 inch | 96.1 |
| 1 inch | 91.1 |
| 3/4 inch | 85.7 |
| 1/2 inch | 74.0 |
| 3/8 inch | 66.1 |
| No. 4 | 52.9 |
| No. 10 | 42.0 |
| No. 40 | 26.4 |
| No. 80 | 17.9 |
| No. 200 | 12.4 |
| 1 inch = 25.4 mm. | |
1 inch = 25.4 mm.
Figure 46. Graph. Gradation of the subbase samples.
Granular Base
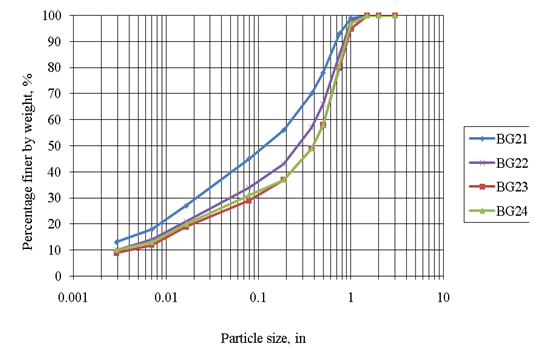
Aggregate gradation for the base layer is summarized in table 42; figure 47 illustrates base aggregate gradations. Three coarse aggregate samples were collected and classified as crushed gravel. The average moisture content was 5.0 percent, but no information regarding the Atterberg limits was available. Therefore, the default inputs for the crushed gravel material were used in the analysis. The resilient modulus of these samples was also measured, as illustrated in figure 48.
| Sieve Size | Average Percent Passing |
|---|---|
| 3 inch | 100.0 |
| 2 inch | 100.0 |
| 1.5 inch | 100.0 |
| 1 inch | 97.3 |
| 3/4 inch | 84.8 |
| 1/2 inch | 65.0 |
| 3/8 inch | 56.3 |
| No. 4 | 43.3 |
| No. 10 | 34.8 |
| No. 40 | 21.8 |
| No. 80 | 14.3 |
| No. 200 | 10.5 |
| 1 inch = 25.4 mm. | |
1 inch = 25.4 mm.
Figure 47. Graph. Gradation of the base samples.
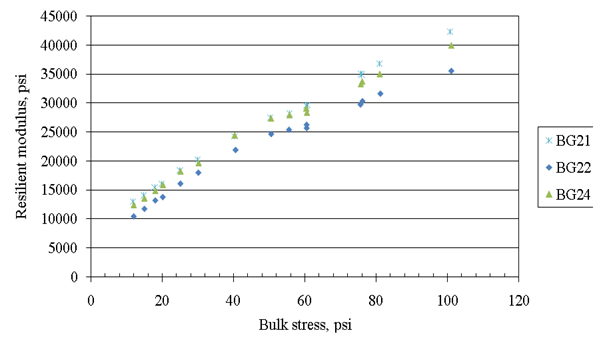
1 psi = 6.89 kPa.
Figure 48. Graph. LTPP data of laboratory resilient modulus testing for the aggregate base.
PCC Layer
The LTPP Program database contained the 28‑day compressive strength, flexural strength, static elastic modulus, and density data for the PCC of the project 32‑0200 sections. The available test results are summarized in table 43. Tests for the coefficient of thermal expansion (CTE) were also performed, but only on one sample (CP09) from test section 32‑0258 (which yielded a CTE value of 5.3×10‑6/°F (9.5 × 10‑6/ºC)).
| Laboratory Test | Average Test Resulta |
|---|---|
| Compressive strength (psi) | 3,423 |
| Modulus of rupture (psi) | 572 |
| Elastic modulus (psi) | 2,783,000 |
| Poisson’s ratio | 0.12 |
| Density (lb/ft3) | 138.6 |
| aBased on available data for odd-numbered sections. 1 psi = 6.89 kPa. 1 lb/ft3 = 0.0160 g/cm3. |
|
The Poisson’s ratio adopted was 0.12, as shown in table 43. The PCC measured Poisson’s ratio for test section 32‑0203 was 0.1, which was not representative of a typical value (between 0.15and 0.20). However, the research team noticed that the measured Poisson’s ratio was quite consistent within the odd‑numbered test sections (32‑0201, 32‑0203, etc.) with a mean of 0.12and a standard deviation of 0.02. The measurements were also consistent within the even‑numbered test sections (32‑0202, 32‑0204, etc.) with a mean of 0.15 and a standard deviation of 0.02. After looking into the PCC mix designs of all the sections, the team found that the mix design (material used as well as the proportioning) of the odd‑numbered sections was the same, and for these sections, the water‑to‑cement ratio was 0.49. On the other hand, for the even‑numbered sections, which also had a common mix proportioning, the water‑to‑cement ratio was 0.32. According to the study by Vu et al., PCC with higher water‑to‑cement ratios tends to present lower Poisson’s ratios because of its higher level porosity.(9) Considering the high water-to-cement ratio for test section 32-0203, the team concluded that the Poisson’s ratio was low, but the consistent measurement of the Poisson’s ratio made it reliable for use in design. The remaining properties summarized in table 43 are also based on the odd-numbered sections.
Although type IP cement was used in the PCC mix, Type I was used in the MEPDG design because type IP was not an available option in the software. The proportioning of the PCC mix for test section 32-0203 was extracted from the LTPP Program database and summarized in table 44. The curing method was not documented in the LTPP Program database, but a curing compound was assumed (because this was the default curing method in the MEPDG).
| Cement (lb/yd3) |
Coarse Aggregates Content (lb/yd3) |
Coarse Aggregate Type |
Fine Aggregates Content (lb/yd3) |
Water Content (lb/yd3) |
Water-to- Cement Ratio |
|---|---|---|---|---|---|
| 423 | 2,024 | Dolomite | 1,198 | 206 | 0.49 |
| lb/yd3 = 0.593 kg/m3. | |||||
For section test 32-0203, dowel bars were 18 inches (457.2 mm) long and 1.5 inches (38.1 mm) in diameter. Joints were spaced 15 ft (4.6 m) apart and sealed with silicone. In the LTPP Program database, the width of the widened design lane was 14 ft (4.3 m). No specific information was available regarding the shoulder type. In this design, no extra edge support from the shoulder was assumed.
The depth to the water table is also required for designing an overlay using the MEPDG. However, no such data was available for the project 32-0200 sections. Therefore, the default value of 10ft (3.05 m) in the MEPDG was adopted for the design.
The climatic data from the weather station at Elko, NV, was used in the MEPDG to represent the climate for the studied pavement section. This weather station was about 80 mi (128.8 km) east of the project 32-0200 sections and 500 ft (152.5 m) higher in elevation. The general climatic category for test section 32-0203 is dry-freeze.
In the LTPP Program database, the only available two-way annual average daily traffic (AADT) was reported as 5,880 in 1996, and it was also recorded that 926 trucks were counted in the design lane. Therefore, the percentage of trucks in the two-way AADT in the design lane was determined to be 16 percent. To establish a growth rate, traffic counts in terms of the two-way AADT performed by the Nevada Department of Transportation for the studied pavement were employed. Assuming the same percentage of trucks, the AADTT in the design lane was calculated from year 1990 to 2007 and presented in table 45. Through a simple regression analysis, a compound truck traffic growth rate was calculated as 2.3 percent, as depicted in figure 49.
Table 45. AADTT in the design lane of test section 32-0203 from 1990 to 2007.
| Year | AADTT |
|---|---|
| 1990 | 812 |
| 1991 | 824 |
| 1992 | 865 |
| 1993 | 846 |
| 1994 | 878 |
| 1995 | 900 |
| 1996 | 942 |
| 1997 | 866 |
| 1998 | 877 |
| 1999 | 1,054 |
| 2000 | 1,043 |
| 2001 | 1,030 |
| 2002 | 1,056 |
| 2003 | 1,016 |
| 2004 | 1,088 |
| 2005 | 1,080 |
| 2006 | 1,184 |
| 2007 | 1,248 |
Figure 49. Graph. Regression analysis for the estimated truck traffic growth rate.
This section presents the data checks; backcalculation analysis of the FWD data, LTE, and void detection; as well as a comparison of the backcalculation results with laboratory testing.
FWD testing on test section 32-0203 was performed on five separate occasions. These test dates were July 21, 1995; March 26, 1996; June 15, 2000; June 25, 2002; and October 28, 2003. To carry out the analysis representing the most current conditions, the FWD data collected on October 28, 2003, was selected for backcalculating the PCC elastic modulus and the modulus of subgrade reaction (k‑value), assessing void potential beneath the slab corners, and characterizing the joint performance. Data from 1996 to 2002 were also used to analyze the variation in the load transfer efficiency (LTE) and the slab support conditions over time.
The average load and deflection of the recorded four drops for the 9,000-lb (4,086-kg) target load were used in the backcalculation of PCC elastic modulus and k‑value. The first step in the data analysis was to plot the deflection basin based on the measured deflections for each test location. As illustrated in figure 50, the deflection basins for stations at 99.1, 308.1, 353, 413.1, and 468.9 ft (30.2, 94, 107.7, 126, and 143 m) did not present an acceptable profile because of the irregular relationship between their load positions and deflections. Therefore, the data from these test locations were not used in backcalculation. In addition, for the remaining stations (i.e., those at 24, 54.1, 158.1, 203.1, and 248 ft (7.3, 16.5, 48.2, 61.9, and 75.6 m)), the outlier data points were realigned by adjusting their position to obtain a smooth deflection basin. Figure 51 presents the adjusted deflection basins used in backcalculation.
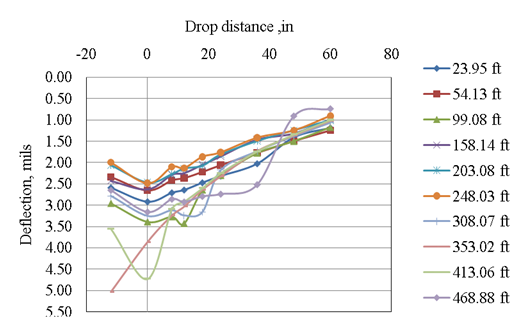
1 mil = 0.0254 mm.
1 inch = 25.4 mm.
Figure 50. Graph. Original deflection basins for test section 32-0203.
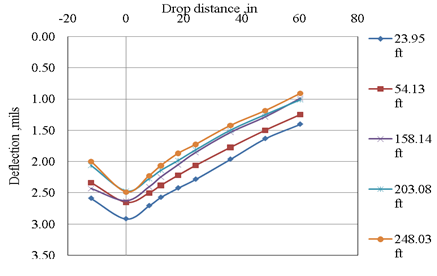
1 mil = 0.0254 mm.
1 inch = 25.4 mm.
Figure 51. Graph. Corrected deflection basins for test section 32-0203.
Table 46 summarizes the loads and deflections used for backcalculation. The loads and deflections used to determine joint load transfer characteristics and the presence of voids are shown in table 47 and table 48, respectively.
| Station (ft) | Location | Drop Load (lb) | Deflection, mil | |||||||
|---|---|---|---|---|---|---|---|---|---|---|
| Sensor 1 | Sensor 2 | Sensor 3 | Sensor 4 | Sensor 5 | Sensor 6 | Sensor 7 | Sensor 8 | |||
| 23.95 | J1 | 9,212 | 2.91 | 2.70 | 2.64 | 2.47 | 2.31 | 2.02 | 1.40 | 1.18 |
| 54.13 | J1 | 9,212 | 2.65 | 2.41 | 2.36 | 2.22 | 2.06 | 1.77 | 1.50 | 1.25 |
| 158.14 | J1 | 9,116 | 2.62 | 2.28 | 2.24 | 2.05 | 1.85 | 1.46 | 1.31 | 0.98 |
| 203.08 | J1 | 9,153 | 2.47 | 2.27 | 2.14 | 2.07 | 1.81 | 1.50 | 1.25 | 1.01 |
| 248.03 | J1 | 9,142 | 2.48 | 2.10 | 2.13 | 1.86 | 1.76 | 1.42 | 1.25 | 0.91 |
| 1 ft = 0.305 m. 1 mil = 0.025 mm. 1 lb = 0.454 kg. |
||||||||||
To graphically evaluate the deflection variation along the section, the deflections presented in table 46 were normalized to a standard 9,000-lb (4,086-kg) load and plotted against distance, as shown in figure 52. The deflections for stations at 99.1, 308.1, 353, 413.1, and 486.9 ft (30.2, 94, 107.7, 126, and 148.5 m) were not included, as discussed previously. As illustrated in figure 52, there was a variation in the structural response of the pavement along the section, with slightly higher deflections at the beginning of the section.
Table 47. Loads and deflections used to determine the joint load transfer characteristics of test section 32-0203.
| Station (ft) | Joint | Test Location | Drop Load (lb) | Deflection, mil | ||
|---|---|---|---|---|---|---|
| Sensor 9 | Sensor 1 | Sensor 2 | ||||
| 4.9 | 1 | J4 | 9,116 | 2.90 | 3.50 | 3.28 |
| 5.2 | 1 | J5 | 9,069 | 3.04 | 3.31 | 2.89 |
| 14.3 | 2 | J4 | 9,053 | 3.01 | 3.83 | 3.18 |
| 14.6 | 2 | J5 | 9,079 | 2.99 | 3.56 | 3.07 |
| 28 | 3 | J4 | 9,121 | 2.66 | 3.32 | 3.18 |
| 28.3 | 3 | J5 | 9,185 | 2.85 | 3.24 | 2.80 |
| 46.3 | 4 | J4 | 8,920 | 2.95 | 3.90 | 3.64 |
| 46.6 | 4 | J5 | 8,989 | 3.28 | 3.79 | 3.22 |
| 60 | 5 | J4 | 9,015 | 3.81 | 4.91 | 4.65 |
| 60.4 | 5 | J5 | 8,978 | 4.42 | 4.92 | 4.21 |
| 73.8 | 6 | J4 | 9,031 | 3.29 | 4.28 | 3.73 |
| 74.1 | 6 | J5 | 9,068 | 3.43 | 4.09 | 3.49 |
| 92 | 7 | J4 | 9,005 | 2.98 | 3.78 | 3.45 |
| 92.4 | 7 | J5 | 8,983 | 3.31 | 3.86 | 3.31 |
| 105.8 | 8 | J4 | 9,015 | 2.61 | 2.93 | 2.70 |
| 106.1 | 8 | J5 | 9,037 | 2.62 | 2.87 | 2.65 |
| 124.1 | 9 | J4 | 9,042 | 3.46 | 4.20 | 3.77 |
| 124.4 | 9 | J5 | 9,100 | 3.66 | 6.94 | 3.58 |
| 146.9 | 10 | J4 | 9,031 | 3.37 | 4.44 | 4.13 |
| 147.2 | 10 | J5 | 9,031 | 3.95 | 4.42 | 3.66 |
| 1 ft = 0.305 m. 1 mil = 0.025 mm. 1 lb = 0.454 kg. |
||||||
| Station (ft) | Location | Drop Load (lb) | Sensor 1 Deflection (mil) |
|---|---|---|---|
| 17.06 | J2 | 9,212 | 4.27 |
| 17.06 | J2 | 12,241 | 5.52 |
| 17.06 | J2 | 15,657 | 7.11 |
| 47.9 | J2 | 9,137 | 4.33 |
| 47.9 | J2 | 12,177 | 5.68 |
| 47.9 | J2 | 15,499 | 7.27 |
| 92.85 | J2 | 9,110 | 3.75 |
| 92.85 | J2 | 12,193 | 4.97 |
| 92.85 | J2 | 15,727 | 6.47 |
| 152.89 | J2 | 9,031 | 4.90 |
| 152.89 | J2 | 12,077 | 6.35 |
| 152.89 | J2 | 15,642 | 8.02 |
| 198.16 | J2 | 8,989 | 5.47 |
| 198.16 | J2 | 12,066 | 7.18 |
| 198.16 | J2 | 15,689 | 9.17 |
| 243.11 | J2 | 9,010 | 5.39 |
| 243.11 | J2 | 12,045 | 6.89 |
| 243.11 | J2 | 15,525 | 8.70 |
| 303.15 | J2 | 9,031 | 4.45 |
| 303.15 | J2 | 12,077 | 5.81 |
| 303.15 | J2 | 15,409 | 7.43 |
| 348.1 | J2 | 9,095 | 3.19 |
| 348.1 | J2 | 12,098 | 4.23 |
| 348.1 | J2 | 15,600 | 5.46 |
| 408.14 | J2 | 9,090 | 5.25 |
| 408.14 | J2 | 12,008 | 6.72 |
| 408.14 | J2 | 15,345 | 8.48 |
| 482.94 | J2 | 9,085 | 6.17 |
| 482.94 | J2 | 12,040 | 7.81 |
| 482.94 | J2 | 15,425 | 9.59 |
| 1 ft = 0.305 m. 1 mil = 0.025 mm. 1 lb = 0.454 kg. |
|||
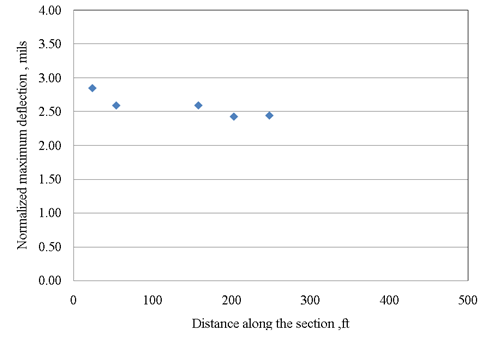
1 ft = 0.305 m.
1 mil = 0.0254 mm.
Figure 52. Graph. Deflections along the section.
Backcalculation of the test section 32-0203 deflection data was performed using the AREA60 method (discussed in chapter 5, volume I) to determine the k‑value and layer moduli. The analysis consisted of a two-layer system: PCC slab and spring foundation.
Backcalculation Results
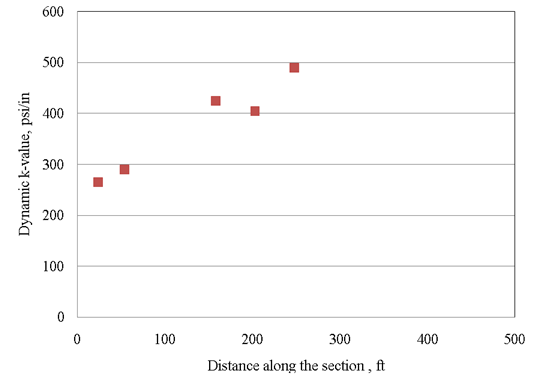
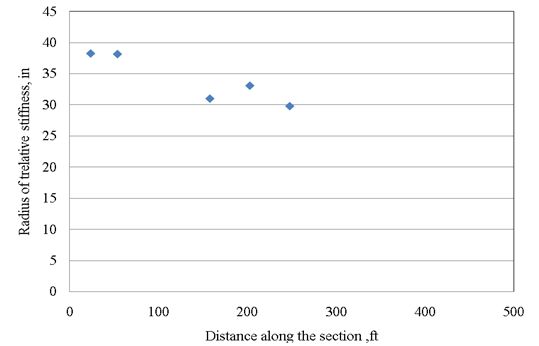
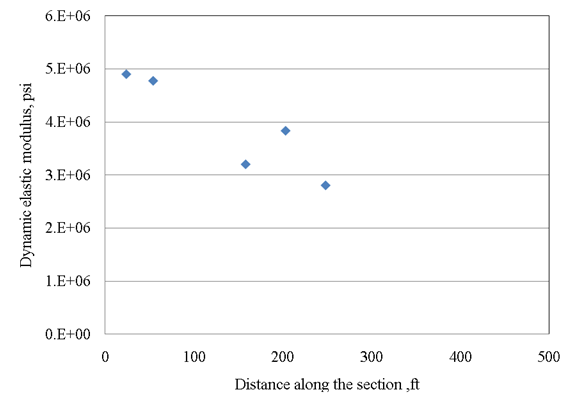
Table 49 presents a summary of the calculated AREA60 parameter as well as the calculated radius of relative stiffness for each station along the section. The dynamic k‑value and PCC elastic modulus for each station are presented in table 50. The average static values are also summarized in table 50, assuming a dynamic-to-static correction of 0.5 for the k‑value and 0.80 for the PCC elastic modulus.
| Station (ft) | AREA60 | Radius of Relative Stiffness (inches) |
|---|---|---|
| 23.95 | 43.88 | 38.27 |
| 54.13 | 43.84 | 38.18 |
| 158.14 | 39.78 | 31.03 |
| 203.08 | 41.11 | 33.11 |
| 248.03 | 38.94 | 29.83 |
| 1 ft = 0.305 m. 1 inch = 25.4 mm. |
||
| Station (ft) | Dynamic k-value (psi/inch) | Dynamic PCC Elastic Modulus (psi) |
|---|---|---|
| 23.95 | 265 | 4,900,000 |
| 54.13 | 290 | 4,750,000 |
| 158.14 | 425 | 3,200,000 |
| 203.08 | 405 | 3,850,000 |
| 248.03 | 490 | 2,800,000 |
| Average dynamic value | 375 | 3,900,000 |
| Average static value | 190 | 3,100,000 |
| 1 ft = 0.305 m. 1 psi/inch = 0.263 kPa/mm. 1 psi = 6.89 kPa. |
||
As shown in figure 53, the k‑values along the section presented an increasing trend that may suggest that the stiffness of the section varies. As stated by Hall et al., a COV in backcalculated k‑value less than 20 percent, after screening of outliers, is reasonable.(10) Significantly higher COVs would suggest significant changes in the subgrade soil type, the embankment thickness, or the depth to bedrock or water table. In this case, the COV of the backcalculated k‑values was 25percent, which suggests possible variations in subgrade support along the section. Because the subgrade of this section was not sampled, and there were no available data regarding the depth of the water table, it was not possible to definitely ascertain the causes of the variation in the structural response of the pavement.
The variation of the radius of relative stiffness along the section, which is the relative stiffness of the slab to that of the pavement foundation, is presented in figure 54. For this relationship, the COV for this parameter was close to 12 percent, which corresponded to the large COV found for the backcalculated PCC elastic moduli and the k‑values along the section.
The variation of PCC elastic moduli along the section is depicted in figure 55. According to the values presented in this figure, the COV for this property was around 22 percent, which was higher than the 15 percent that was typically assumed acceptable for a concrete mixture design. Moreover, the research team also found that the high backcalculated k‑values always correlated to low PCC elastic moduli. This could be an indication that the backcalculation technique was capturing the overall stiffness but it was overestimating the k‑value and, therefore, the elastic modulus of the PCC was being underestimated.
1 ft = 0.305 m.
1 psi/inch = 0.263 kPa/mm.
Figure 53. Graph. k‑values along the section.
1 inch = 25.4 mm.
1 ft = 0.305 m.
Figure 54. Graph. Radius of relative stiffness along the section.
1 psi = 6.89 kPa.
1 ft = 0.305 m.
Figure 55. Graph. PCC elastic modulus along the section.
Joint Load Transfer
Joint LTE and differential slab deflections were determined using the equations presented in chapter 5, volume I. Table 51 shows the lowest of the calculated LTEs between approach and leave side, and the differential deflections based on the deflections presented in table 47. As shown in table 51, most of the LTE values were above the acceptable level of 75 percent, except at joint 9, which exhibited only a fair LTE (between 50 and 75 percent). The fact that all of the differential deflections were less than 0.25 mm (10 mil), as presented in table 51, supports the fact that the joints were performing well. The deflection data used for determining the LTEs was collected at higher temperatures than recommended (typically 70 ºF (21 ºC)), which may contribute to joint lock-up. In a subsequent section of this report, it is shown that voids were not found to be present beneath the slabs, indicating that good load transfer was being provided for the majority of the time even in the presence of colder temperatures.
| Joint | LTE (percent) | Approach Slab Differential Deflections (mil) |
Leave Slab Differential Deflections (mil) |
|---|---|---|---|
| 1 | 99 | -0.4035 | 0.6004 |
| 2 | 87 | -0.8465 | 0.8268 |
| 3 | 98 | -0.3248 | 0.6594 |
| 4 | 92 | -0.6791 | 0.9449 |
| 5 | 99 | -0.5413 | 1.1024 |
| 6 | 90 | -0.8268 | 0.9843 |
| 7 | 96 | -0.4921 | 0.7972 |
| 8 | 100 | -0.2854 | 0.3051 |
| 9 | 59 | -0.5906 | 0.7283 |
| 10 | 97 | -0.5906 | 1.0630 |
| 1 mil = 0.0254 mm. | |||
Variation in LTE Over Time
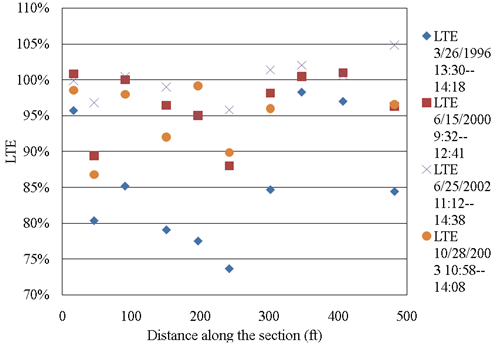
Figure 56 shows the LTEs from the available data between 1996 and 2003. As shown in the figure, the LTE range was different for each year. For instance, the range of LTEs for the testing performed in 1996 was from 75 to 100 percent, whereas for the FWD testing performed in 2002, the range of LTE was between 95 and 104 percent. This variation was related to the slab temperature at the time of testing. At warmer temperatures, slabs expand causing the joints to lock up. Therefore, a higher LTE is obtained. This effect is shown in figure 56. The lowest LTE was observed in 1996 when the FWD testing was performed during the spring (late March), and the highest LTEs were observed in 2002 when the testing was performed during the summer (late June). In addition, figure 56 shows that the trend of the variations in the LTE along the project was maintained for all test periods. This indicates that the performance level of the joints along the section remained relatively constant over time. If the LTE was low, repair of the joints would need to be performed.
1 ft = 0.305 m.
Figure 56. Graph. LTE values from 1996 to 2003.
Void Detection
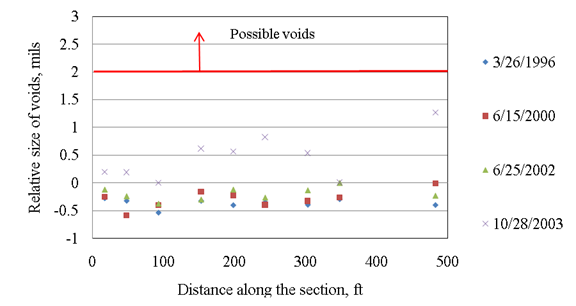
The presence of voids is determined based on the fact that pavement deflections respond nonlinearly when voids exist. The data presented previously in table 48 was used to plot edge deflections against the applied load for each station to assess the potential for voids in the method proposed by Crovetti and Darter.(11) The best-fit line of the data points should go through the origin if the response of the pavement is linear. When voids are present, a deflection occurs with a minimal applied load until the slab comes in complete contact with the base layer. Therefore, the presence of voids causes an upward shifting of the plot of load versus deflection, and the positive intercept on the y-axis determines the relative size of the voids. An intercept of the y-axis greater than 2 mil (0.05 mm) may be an indication of the existence of voids and the magnitude of the y-intersect determines the relative size of the voids. If voids are present, repairs would be needed as part of the rehabilitation.
The temperature distribution throughout the depth of the slab at the time the FWD testing is performed can be critical when using the deflection data for void detection. If a positive temperature gradient is present in the slab, then the corners of the slab will curl downward so that erosion of the base might have occurred while not being detected. If a negative gradient is present causing the slab corners to curl upward, erosion of the base might be detected even it has not occurred. To reduce the potential for false positive or false negative results, it is recommended that FWD testing be performed when the slabs are flat. The research team found that the slabs were most likely to be flat when a positive temperature gradient was present in the slabs due to the existence of built-in gradients.(12) As shown in figure 40 through figure 43, a positive temperature gradient was present in the slabs during the FWD testing. The extent of these gradients, which were assumed linear, is presented in table 52. As shown this table, these gradients presented similar magnitudes for the 1996, 2000, and 2003 tests. The temperature gradient of the slab for the 2002 test was about 1 °F (0.556 °C) higher than the rest of the tests, implying the presence of a more pronounced downward curvature of the slab at the time the FWD test was conducted.
| FWD Test Date | Average Temperature Gradient Throughout the Test Day (ºF/inch) | Average Slab Temperature (ºF) |
|---|---|---|
| 3/26/1996 | 1.27 | 58 |
| 6/15/2000 | 1.50 | 87 |
| 6/25/2002 | 2.21 | 96 |
| 10/28/2003 | 1.54 | 71 |
| 1 °F/inch = 0.041 °C/cm °F = 1.8 × °C + 32. |
||
The intercept values from the load versus deflection plots for the FWD tests performed in test section 32-0203 are summarized in figure 57. As shown in this figure, the y-intercepts for all the sections were negative values before 2003, and only the test in 2003 indicated the possible existence of loss of support. However, because the magnitudes of the y-intercepts for the 2003 test are smaller than 2 mil (0.05 mm), the existence of voids along the section was not probable at that moment. On the other hand, the observed trend from 1996 to 2003 may indicate a loss of support process that apparently started between 2002 and 2003 and was likely to develop with time.
1 mil = 0.0254 mm.
1 ft = 0.305 m.
Figure 57. Graph. Y-intercepts from void detection test results.
Determination of individual layer properties from the composite k‑value is a difficult task. The backcalculation only provided the elastic modulus for the PCC layer and the composite k‑value representing the stiffness of all the underlying layers (i.e., base, subbase and subgrade). On the other hand, the laboratory measurements are usually obtained for each individual layer. Efforts were made to break down the composite k‑value obtained in the backcalculation to provide the basis for the comparison. One possible solution was to use the method proposed in the Portland Cement Association (PCA) guide for pavement design to account for the increase in the static k‑value owing to the use of a base/subbase.(13) Another possible solution could be obtained using layered elastic analysis to match the measured deflections—similar to the conversion for new rigid pavement design within the MEPDG software. However, this approach was not investigated for this case study.
Bound Materials
As presented in table 50, the average backcalculated static PCC elastic modulus was 3.1 million psi (21,359,000kPa) whereas, according to the LTPP Program data, the average laboratory-measured static modulus is 2.8 million psi (19,292,000 kPa). The difference was insignificant when considering that the measured value was only 0.46 standard deviations away from the mean of the backcalculated values. However, this apparently good correlation was due to the relatively high standard deviation of the backcalculated values 750,000psi (5,000 kPa). As stated before, there was variation between the backcalculated PCC elastic modulus along the project, and it might suggest that the backcalculation technique was capturing the overall stiffness while overestimating the k‑value and, therefore, underestimating the elastic modulus of the PCC. The average static elastic modulus for the first portion of the section (station 0 ft (0 m) to station 54.1 ft (16.5 m)) was 3.9 million psi (26,871,000 kPa), whereas this value for the remaining of the section was 2.6 million psi (17,914,000 kPa)). Therefore, the laboratory measured values agreed well with the backcalculated values for the second portion of the section, but relatively poorly with the values obtained for the first portion.
Unbound Materials
The backcalculation procedures for rigid pavements provide a k‑value, whereas the laboratory testing of material samples results in the determination of a resilient modulus value. One available correlation for k‑value and resilient modulus is shown in figure 58.(2)

Figure 58. Equation. Correlation for k‑value and resilient modulus.
Where:
MR= Resilient modulus, psi.
k-value = Modulus of subgrade support, psi.
As discussed previously, the k‑value determined using the AREA60 backcalculation method is a dynamic k‑value and includes the contribution of the unbound base and subbase layers as well as the subgrade (and bedrock, if present). A factor of 0.5 is commonly applied to convert a dynamic k‑value to a static k‑value. So, for this section the dynamic k‑value corresponded to a static composite k‑value of approximately 52 kPa/mm (190 psi/inch), and a resilient modulus of 21,900psi (151,000kPa). These values are considered somewhat low for a composite material that includes the effects of both the subgrade and the aggregate base and subbase materials.
The PCA pavement design guide was used to account for the increase in the static k‑value due to the use of a base/subbase.(13) Based on table 53, a composite static k‑value of 190psi/inch (51kPa/mm) (0.5 times the backcalculated dynamic k‑value of 375 psi (2,584 kPa)) was contributed by a subgrade that has a static k‑value of 155 psi/inch (42 kPa/mm) and a 6-inch (152‑mm)-thick subbase. This suggests a resilient modulus of 16,900psi (116,300 kPa) for the material below the base layer, which is relatively low considering the presence of subbase aggregate and a lime-stabilized subgrade layer. A modulus value for the base layer would then need to be assumed, as discussed later.
| Subgrade k-value (psi/inch) | Subbase k-value (psi/inch) | ||
|---|---|---|---|
| 4-Inch Subbase | 6-Inch Subbase | 9-Inch Subbase | |
| 50 | 65 | 75 | 85 |
| 100 | 130 | 140 | 160 |
| 200 | 220 | 230 | 270 |
| 300 | 320 | 330 | 370 |
| 1 psi/inch = 0.263 kPa/mm. 1 inch = 25.4 mm. |
|||
The resilient modulus of the subgrade ranged from 6,000 to 15,000psi (41,340 to 103,350 kPa) for a bulk stress between 8 to 28 psi (55 to 193 kPa), as previously shown in figure 44. Considering the fact that resilient modulus testing was not performed on any samples from test section 32-0203 and recognizing the difficulty in determining the resilient modulus because of the unknown confinement condition, the typical resilient modulus suggested by the MEPDG for AASHTO A-4 subgrade, 15,000 psi (103,350 kPa) was adopted. This is much lower than the composite backcalculated k‑value, but only slightly lower than the estimated separate subgrade modulus.
With respect to the 5.7-inch (145-mm) granular base layer, although resilient modulus laboratory testing was performed for three sections (figure 48), the stress-dependent feature of this property makes it hard to determine, especially when the confinement in the field is unknown. Therefore, the resilient modulus suggested by the MEPDG, 25,000 psi (172,250 kPa), is used for the base, which corresponds to a bulk stress between 50 and 60 psi (345 and 413 kPa) according to figure 48. The granular base layer was determined to be A-1-a in the AASHTO system based on its gradation.(2) The resilient modulus was then determined using a correlation between the soil’s AASHTO classification and the typical range of resilient modulus.(2,13) The typical resilient modulus of AASHTO A-1-a soil was between 22,000 and 28,000psi (151,580 and 192,920 kPa), which agreed well with the default value suggested in MEPDG for crushed gravel. This value was slightly higher than the backcalculated composite k‑value, but was likely reasonable based on the aggregate layer being thin relative to the overall subgrade thickness.
The composite k‑value can be obtained based on the modulus that was determined previously for each layer and for comparison with the composite k‑value from the backcalculation. In the MEPDG (table 3.6.8), adjustment factors are provided between the backcalculated and laboratory-determined elastic modulus; for this study, values of 1.32 and 0.35 were used for the base/subbase and subgrade, respectively. Therefore, the laboratory-determined modulus as described previously (i.e., 15,000 psi (103,350 kPa) for the subgrade); 25,000psi (172,250 kPa) for the base, can be converted to the backcalculated modulus, namely 5,250 psi (36,170kPa) for the subgrade and 33,000 psi (227,370 kPa) for the base. The backcalculated modulus was then used to compute the composite k‑value based on figure3.3. in the 1993 AASHTO Guide for Design of Pavement Structures.(2) The result was approximately 300 psi/inch (80 kPa/mm) for a base with 5.7-inch (145-mm) thickness, which was much higher than the composite k‑value from the backcalculation (i.e., 190 psi/inch (50 kPa/mm)). This again verifies that the backcalculated modulus of the unbound materials tends to be smaller than the laboratory-determined modulus for the studied pavement section.
The objective of this study was to learn the reliability of using FWD backcalculated values in design based on the comparison between designs with inputs from laboratory tests and designs with inputs obtained from FWD backcalculation. Rehabilitation designs were analyzed for an HMA overlay, an unbonded JPCP overlay, and a bonded JPCP overlay for this section. Designs were determined using version 1.003 of the MEPDG software and the nationally calibrated performance models.(1)
The general inputs used for the design program were based on the available LTPP Program data (as previously summarized), estimated inputs from standard specifications, and on default values within the program when data were not available from other sources. The primary inputs that were evaluated for this case study were those corresponding to properties obtained from the backcalculation process (PCC elastic modulus and k‑value).
The rehabilitation design also considered the percentage of cracked slabs. As discussed in the previous section, all of the pavement slabs had cracked by 2003 (see table 37). In terms of the MEPDG design, the percentage of cracked slabs before restoration was then assumed to be 100percent. Because almost all the transverse cracks are working cracks, they should all have been repaired before the placement of the overlay. Therefore, the percentage of cracked slabs before the overlay was assumed to be 0 percent.
As mentioned previously, the top 12 inches (305 mm) of the subgrade was treated with lime. In the MEPDG, there is no lime stabilized subgrade, but there is a lime stabilized base. The use of a lime-treated base layer between the subbase and the subgrade, in an effort to reflect the top 12inches (305mm) of lime-treated subgrade, caused an error displayed as “Failed the ICM stability check,” which may be related to the much larger stiffness of a lime stabilized base layer compared with that of a lime stabilized subgrade. A second effort was then made by designating the subgrade as AASHTO A-2-4 soil instead of AASHTO A-4 soil to reflect the improvement of the subgrade resulting from the treatment. Furthermore, the AASHTO A-2-4 subgrade (16,000psi (110,240kPa)) might be combined with the aggregate subbase (assumed as the base, 25,000psi (172,250 kPa)), the weighted average can be used as the modulus for the subgrade (approximately, 20,000 psi (137,800 kPa)). However, no difference was found in terms of the design thickness of the overlay resulting from this change in the modulus of the subgrade. Therefore, the lime treatment top 12 inches (305mm) of the subgrade was neglected in this study and the subgrade remains AASHTO A‑4 soil, which is a conservative approach. Other possible modeling considerations (such as adjusting the subbase thickness and modulus) were not pursued because the subgrade appeared to have no influence on the design thickness.
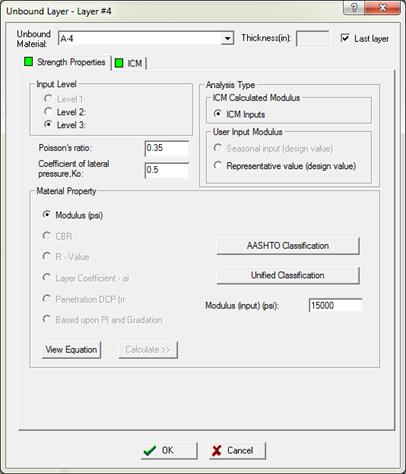
The climatic modeling (see figure 59) was used for the unbound layers. While a “Representative value” was also allowed, testing data and backcalculation results were not available for all of the months or seasons to estimate an appropriate representative value.
1 inch = 25.4 mm.
1 psi = 6.89 kPa.
Figure 59. Screen Capture. Unbound layer input screen illustrating ICM selection.
The overall design level for an HMA overlay over JPCP is level 3 and cannot be changed. The input level for the individual layers can be adjusted, with levels 1 through 3 for the HMA overlay and existing PCC, and levels 2 and 3 for unbound materials. For the HMA overlay analysis, the flexural strength and elastic modulus were entered for the existing PCC as required in level 1, and the unbound layer data were entered as level 3.
From the design runs performed during this case study, the HMA overlay design appeared to be very sensitive to the HMA properties of the overlay. The results presented later in this chapter are based on the following HMA mixture properties. The asphalt binder grade was selected based on the Superpave performance grading system using LTPPBIND Version 2.1 that was developed for the Federal Highway Administration in 1999. The Superpave PG obtained for the specific location of test section 32-0203 was 58-22 with a reliability of about 87 percent. The aggregate gradation, the effective binder content, and the percentage of air voids were extracted from a Strategic Highway Research Program (SHRP) level-1 mix design that had been used in the MnROAD HMA cells.(14) The effective binder content was 5.6 percent, the air voids were 4percent, and the aggregate gradation was presented in table 54.
Table 54. Aggregate gradation for the additional HMA overlay alternative design.
| Sieve Size | Value |
|---|---|
| 3/4 inch, percent retained | 0 |
| 3/8 inch, percent retained | 18 |
| No. 4, percent retained | 33 |
| No. 200, percent passing | 4 |
| 1 inch = 25.4 cm. | |
The performance criteria for the HMA overlay suggested by the MEPDG are presented in table 55. A design reliability of 90 percent was used and a 20-year performance period.
Table 55. Performance criteria for the 20-year HMA design.
| Performance Criteria | Limit |
|---|---|
| Initial IRI, inches/mi | 63 |
| Terminal IRI, inches/mi | 172 |
| Transverse cracking, percent slabs cracked | 15 |
| AC surface down cracking (long. cracking), ft/mi | 2,000 |
| AC bottom up cracking (alligator cracking), percent | 25 |
| AC thermal fracture (transverse cracking), ft/mi | 1,000 |
| Chemically stabilized layer (fatigue fracture) | 25 |
| Permanent deformation (AC only), inches | 0.25 |
| Permanent deformation (total pavement), inches | 0.75 |
| Reflective cracking, percent | 100 |
| 1 inch/mi = 0.0158 m/km. 1ft/mi = 0.19 m/km. 1 inch = 25.4 mm. AC = asphalt concrete. |
|
In the HMA overlay design, the modulus of rupture for the existing PCC layer is also required in the MEPDG. It can be obtained using the correlation between the PCC elastic modulus and the modulus of rupture provided within the MEPDG. Based on this correlation, a modulus of rupture of 3,790 kPa (550 psi) is obtained for an elastic modulus of 21,359,000 kPa (3.1 million psi).
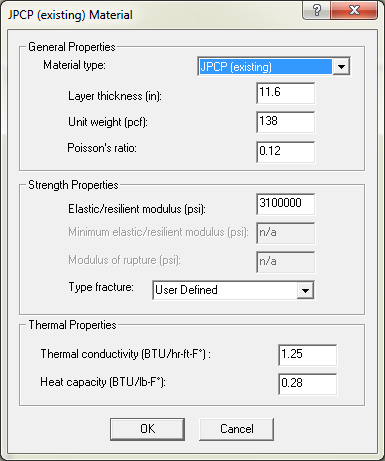
The same PCC properties as the existing PCC layer are used for the JPCP unbonded overlay design, which were as follows: unit weight of 138 lb/ft3 (2,211 kg/m3), Poisson’s ratio of 0.12, CTE of 5.3×10⁻⁶/°F (9.5 ×10⁻⁶/ºC), and a modulus of rupture of 570 psi (3,927 kPa). The PCC mix design used for the existing PCC layer as shown in table 44 was also used to remain consistent with these properties.
The existing PCC was not being rubblized or crack-and-seated, so the fracture type was left as “User Defined” (see figure 60). In addition, the existing PCC layer was fixed as a level 3 input in an unbonded PCC overlay design.
1 inch = 25.4 mm.
1 pcf = 16 kg/m3.
1 psi = 6.89 kPa.
1 BTU/h-ft-°F = 1.73 W/m-°C.
1 BTU/lb-°F = 4,186 J/kg-°C.
Figure 60. Screen Capture. Existing PCC layer input screen for unbonded PCC overlay.
The PCC slabs were designed as 15 ft (4.6 m) long and 14 ft (4.3 m) wide to be compatible with the existing PCC layer and the joints were sealed with silicon and doweled with 1.5‑inch (38-mm) bars. With respect to the required bond breaker layer (2 inches (51 mm) thick as suggested by the MEPDG), the same HMA was employed as was used in the HMA overlay design.
The performance criteria for the unbonded JPCP overlay suggested by the MEPDG are presented in table 56. A reliability level of 90 percent is used.
Table 56. Performance criteria for the 20-year unbonded JPCP design.
| Performance Criteria | Limit |
|---|---|
| Initial IRI (inches/mi) | 63 |
| Terminal IRI (inches/mi) | 172 |
| Transverse cracking (percent slabs cracked) | 15 |
| Mean joint faulting (inches) | 0.12 |
| 1 inch/mi = 0.0158 m/km. 1 inch = 25.4 mm. |
|
The inputs, as well as the performance criteria for the JPCP bonded overlay, were the same inputs as those used for the unbounded JPCP overlay with the difference that the bonded overlay did not include an asphalt interlayer. A bonded JPCP overlay also required the existing PCC modulus of rupture, similar to the HMA overlay design. In addition, the input level for the existing PCC layer can be based on levels 1 through 3 for a bonded PCC overlay.
To validate the reliability of using FWD backcalculation results in MEPDG designs, two design alternatives were originally planned for each kind of overlay, the first of which would employ the laboratory testing results as inputs, and the second would employ the backcalculated values as inputs. However, the research team later found (from a study on the conversion of layer moduli into k‑value, which is part of this report) that the MEPDG software did not always use the entered dynamic k‑value to represent the stiffness of all the layers beneath the base layer as is stated in the MEPDG documentation. Sometimes, the stiffness of the base layer is also taken into account in the composite k‑value. Therefore, a third alternative had to be designed to learn how the MEPDG uses the input k‑value. The details of the three design alternatives are presented in the following subsections.
The first design alternative served as a benchmark, where the measured or recommended material properties were used as inputs in the MEPDG. For this alternative, the backcalculated dynamic k‑value was not used to represent the stiffness of the supporting layers.
In the second design alternative, the backcalculated values, in terms of the dynamic elastic modulus for the existing PCC layer and the dynamic k‑value for the supporting layers, were used as inputs, assuming that the k‑value reflected the stiffness of all the layers beneath the base. Based on the FWD testing, the average backcalculated elastic modulus for the existing PCC layer was 3.1 million psi (21,359,000 kPa) (see table 50).
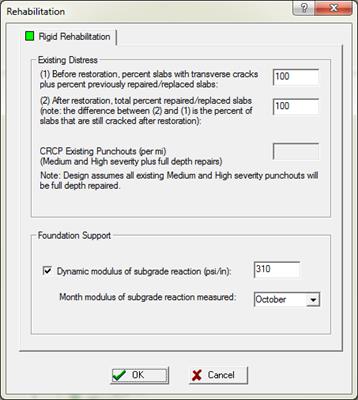
The average backcalculated dynamic k‑value is 375 psi/inch (101 kPa/mm). However, this k‑value was selected to represent the composite stiffness of all the layers beneath the PCC layer. As discussed previously, using the adjustment method in the PCA pavement design guide, an individual dynamic k‑value for the subgrade can be estimated.(13) Therefore, for the second alternative, the static k‑value of all layers beneath the 145-mm (5.7-inch) base was estimated to be 155psi (1,068kPa) for test section 32-0203. Thus, the dynamic k‑value for all the layers beneath the base is 310 psi/inch (84kPa/mm) and is entered in the “Rehabilitation” screen, as shown in figure 61. The rest of the inputs besides the dynamic elastic modulus for the existing PCC layer and the dynamic k‑value for all layers beneath the base were kept the same as those in the first alternative.
1 inch = 25.4 mm.
1 psi = 6.89 kPa.
Figure 61. Screen Capture. Dynamic k‑value input for overlay design options.
For the last alternative, the same inputs as those used in the second alternative were used, except that the dynamic k‑value was assumed to be 375 psi/inch (101 kPa/mm). It was assumed that this reflected the composite stiffness of all layers beneath the slab. If the stiffness of the base layer were included in the k‑value by the MEPDG, different design results may be expected for alternative 2 and 3.
In the design, the thickness of the overlay was varied until the thinnest HMA layer was obtained that still satisfied the performance criteria as shown in table 55. HMA overlays that were 12inches (305mm) thick were found capable of carrying the estimated future traffic, regardless of the different sets of inputs used, as summarized in table 57.
Table 57. Design thickness of HMA overlay for three alternatives.
| Alternative | Required Thickness (inches) |
|---|---|
| 1 | 12.0 |
| 2 | 12.0 |
| 3 | 12.0 |
| 1 inch = 25.4 mm. | |
The obtained design thickness was significantly greater than what would be typically constructed by a highway agency. The controlling distress predicted by the MEPDG for this HMA overlay design was rutting, which was both load- and material-related distresses. This implies that changes in the HMA mix design would substantially affect the design thickness of the HMA overlay. If rutting was not considered (such as assuming the rutting would be patched at some intermediate year), the required HMA overlay thickness became less than 4 inches (100 mm).
The research team noticed that during the design analyses, the k‑values reported in the design output files were the same, whether or not the dynamic k‑value was entered as an input. Therefore, additional design runs were executed to assess how the k‑value was being calculated. Based on the design runs, varying the subbase stiffness had very little influence on the determined k-value, which seemed to suggest the stiffness of the subbase layer was not taken into account in the calculated k‑value. In addition, the reported k‑values in the output file were identical for cases with varying base layer stiffness, indicating the stiffness of the base was likely not included in the k‑value calculation. Furthermore, it appears that the MEPDG ignored the entered dynamic k-value and calculated the k‑values based on the entered layer moduli because the summarized values were the same regardless of what dynamic k‑value was entered or when a dynamic k-value was not entered.
The design thickness of the unbonded JPCP overlay was the thinnest one that still satisfied the performance criteria shown in table 56. However, the use of unbonded JPCP overlays thinner than 178 mm (7 inches) is not recommended by the MEPDG. This is because the unbonded overlay acts independently from the supporting layers, so a minimum allowable thickness is needed to ensure adequate structural capacity. The research team found that a 7-inch (178-mm)-thick or thicker JPCP unbounded overlay can meet all criteria for the three alternatives, so the design thickness is determined to be 7 inches (178 mm) for each of the three alternatives, as shown in table 58.
Table 58. Design thickness of unbonded PCC overlay for three design alternatives.
| Alternative | Required Thickness (inches) |
|---|---|
| 1 | 7 |
| 2 | 7 |
| 3 | 7 |
| 1 inch = 25.4 mm. | |
As with the HMA overlay design, additional analyses were performed to assess how the k‑values are calculated within the design program. The output file k‑values for a stiff and less stiff asphalt interlayer were only approximately 10 percent different. The difference in k‑values between a low and high existing PCC elastic modulus are also approximately 10 percent different. These results seem to indicate that the stiffness of the interlayer and the existing PCC are not considered in the calculation of the k‑value.
The research team concluded that the base layer was taken into account by the difference in k‑values when using a stiff and weak base layer. In addition, the k‑values agreed well with the entered dynamic k‑value, suggesting that the MEPDG uses the entered value for unbonded PCC overlay designs. However, when no k‑value was designated, it was not explicit which layers were taken into account in the calculation of the k‑value.
The design thickness of the bonded JPCP overlay was determined by reducing the thickness of the overlay until the performance criteria shown in table 56 were no longer fulfilled. As presented in table 59, the design thickness for all the alternatives was 4 inches (100 mm). Thinner slabs would fail due to high IRI, while little cracking and a small amount of faulting occurred. The high IRI was not contributed mainly by distresses, but possibly some other site factors such as freezing index and fines in the supporting layers.
Table 59. Design thickness of bonded PCC overlay for three design alternatives.
| Alternative | Required Thickness (inches) |
|---|---|
| 1 | 4) |
| 2 | 4 |
| 3 | 4 |
| 1 inch = 25.4 mm. | |
The k‑values in the design output for a high and low base layer modulus had noticeable variation. Therefore, it seems that the modulus of the base layer was considered in the calculation of the k‑value for bonded JPCP overlay designs, which agreed with the assumptions made for bonded PCC overlays. It is also apparent that the calculated k‑values matched the entered dynamic k‑value.
It is reasonable that the design thickness of a bonded JPCP overlay is smaller than an unbonded JPCP overlay. Bonded JPCP overlays use the remaining structural capacity of the existing PCC, so their thickness can be relatively thin. On the other hand, unbonded JPCP overlays work independently so some restraints in the minimum thickness must be provided to guarantee their structural capacity. The research team concluded that the unreasonably thick HMA overlay can be attributed primarily to the HMA mix design used. As mentioned before, a thinner HMA overlay can be achieved by adjusting the HMA mix design properties. A thinner HMA overlay can also be considered with planned maintenance because all other performance criteria were met when not considering rutting.
For each kind of overlay, there is no difference in terms of the design thickness among the three design alternatives, which implies that it is quite reliable to employ the backcalculated dynamic elastic modulus for the PCC layer and the composite, dynamic k‑value for all layers beneath the slab in the MEPDG design. Furthermore, no difference in terms of the design thickness of the overlays was observed between alternative 2 and alternative 3 (adjusted k‑value and backcalculated k‑value) for any of the three types of overlay, indicating that the dynamic k‑value backcalculated from the FWD data can be used to represent the stiffness of the layers beneath the base, even though in reality it represents the composite stiffness of all layers beneath the slab. This is most likely because the base for test section 32-0203 was unstabilized and thus had a relatively small contribution to the overall stiffness. If a stabilized base were used, different design thicknesses could be expected among the three design alternatives.
Test section 32-0203 represents a rigid pavement on granular base cross section case study. The backcalculation of PCC elastic modulus and k‑value using the most recent data was only possible for the first half of test section 32-0203 (station 0 to 248 ft (0 to 75.6 m)) because of the inconsistency in the deflection basin profiles for the rest of the stations. However, the information included in the LTPP Program database for this section was sufficient to determine the load transfer characteristics and the support conditions for the entire section. The variation of the backcalculated k‑value and the PCC elastic moduli along the section can be an indication that the backcalculation technique was capturing the overall stiffness, but it appears to be overestimating the k‑value and, therefore, underestimating the elastic modulus of the concrete for several of the test locations.
The average laboratory-measured static PCC modulus 2.8 million psi (19,292,000 kPa) presented a good correlation with the average backcalculated static PCC elastic modulus of 3.1 million psi (21,359,000 kPa); however, the variation of the backcalculated values along the section was 22 percent, which was substantially higher than the 15 percent typically assumed acceptable.
The AREA60 method determines a composite k‑value, which is inclusive of the unbound base and subgrade layers. For the aggregate layers and lime-stabilized subgrade layer included in the pavement cross section, the backcalculated k‑value was relatively low. Using the PCA’s design method to back out a base layer contribution still resulted in a k‑value that appears low considering the pavement cross section.
The LTE values along the section were above the typical acceptable level of 75 percent. This high level was constant over time, and it was not affected by cold temperatures, indicating the doweled joints were performing well. According to the void detection analysis, it appears that voids were not present beneath the slab in this section of roadway. However, there was a possibility that some erosion had begun to occur beginning in 2002 based on the increase over time observed in the void potential plot.
Based on the latest available LTPP Program data, the studied section was in poor condition, with a large number of transverse cracks. The necessary MEPDG design inputs are not all available in the LTPP Program database for the studied test section 32-0203, or any other project 32-0200 sections. Therefore, based on the LTPP Program data, appropriate inputs for rehabilitation designs in the MEPDG were discussed and determined.
Three kinds of overlays—HMA overlay, unbonded JPCP overlay, and bonded JPCP overlay—were designed for the rehabilitation. The thinnest design thickness was obtained by using a bonded JPCP overlay. The MEPDG design runs provided an unreasonably thick HMA overlay design, which was attributed mainly to the HMA mix design properties assumed. However, by adjusting the HMA mix design or by assuming intermediate maintenance, a more reasonable HMA overlay design thickness (on the order of 100 mm (4 inches) can be obtained.
No difference in terms of the design thickness was found among the three design alternatives (laboratory/material default values, adjusted backcalculated k‑value and backcalculated PCC elastic modulus, and backcalculated PCC elastic modulus and k‑value), indicating the reliability of using both the backcalculated dynamic elastic modulus for the PCC layer and the dynamic k‑value for the supporting layers in the MEPDG design.
The research team found that the backcalculated k‑value that represented the composite stiffness of all layers beneath the slab can be directly entered into the MEPDG without having a significant influence on the design thickness for the pavement structure analyzed. However, this does not definitively mean that the MEPDG takes the stiffness of the base layer into account in the k‑value. It could be either because of the insensitivity of the design thickness on the input k‑value or because the unstabilized granular contributed very little to the composite stiffness of all layers beneath the slab. Other observations made regarding the calculation of k‑value within the MEPDG program include the following:
For the HMA overlay design, varying the subbase stiffness had very little influence on the determined k‑value, which seemed to suggest the stiffness of the subbase layer was not taken into account in the calculated k‑value. In addition, the reported k‑values in the output file were identical for cases with varying base layer stiffness, indicating the stiffness of the base was likely not included in the k‑value calculation. Furthermore, it appears that the MEPDG ignores the entered dynamic k‑value and calculates the k‑values based on the entered layer moduli because the summarized values were the same regardless of whether the dynamic k‑value was entered or not.
For the unbonded PCC overlay, additional design runs seemed to indicate that the stiffness of the interlayer and the existing PCC were not considered in the calculation of the k‑value. It did appear that the base layer was taken into account by the difference in k‑values when using a stiff and weak base layer. In addition, the k‑values agreed well with the entered dynamic k‑value, suggesting that the MEPDG uses the entered value for unbonded PCC overlay designs.
It appears that the modulus of the base layer was considered in the calculation of the k‑value for bonded JPCP overlay designs, which agreed with the assumptions made for bonded PCC overlays. It was also apparent that the calculated k‑values matched the entered dynamic k‑value.