U.S. Department of Transportation
Federal Highway Administration
1200 New Jersey Avenue, SE
Washington, DC 20590
202-366-4000
Federal Highway Administration Research and Technology
Coordinating, Developing, and Delivering Highway Transportation Innovations
| REPORT |
| This report is an archived publication and may contain dated technical, contact, and link information |
|
| Publication Number: FHWA-HRT-16-010 Date: March 2017 |
Publication Number: FHWA-HRT-16-010 Date: March 2017 |
In this case study, a rehabilitation alternative that consisted of a JPCP layer over an existing HMA layer (sometimes referred to as whitetopping) was considered for LTPP Program test section 30‑0113 (the project also used in case study 1). Project 30-0100 was located on I-15 near Great Falls, MT, and consisted of 12 test sections. Test section 30-0113 was a flexible pavement cross section with an HMA surface and aggregate base layer over subgrade. The original pavement, nominally a 4-inch (102‑mm) HMA surface on a 8-inch (203-mm) aggregate base, was constructed in 1997.
The structure and all other properties of the section used in the alternatives presented in previous sections of this report were kept identical.
This section presents the data checks and backcalculation analysis of the FWD data used in this case study.
Before conducting the backcalculation analysis, the available deflection data were screened. The dataset used for this case study was assessed as part of case study 1 and was not reassessed for this case study.
Backcalculation of test section 30-0113 outer wheelpath deflection data was performed using linear, static layered elastic analysis. The backcalculation analysis is discussed in case study 1; the use of the backcalculation inputs in the MEPDG software for whitetopping is covered in this case study.
The overall design level for this rehabilitation (PCC over existing HMA) was level 3, which cannot be adjusted within the MEPDG program. The required layer inputs used in the MEPDG are dependent on the overall design level selected for design. The bound layer inputs can be levels 1, 2, or 3, and the unbound layer inputs can be levels 2 or 3.
The general inputs used for the design program were based on the available LTPP Program data (as previously summarized), estimated inputs from standard specifications, and default values within the program when data were not available from other sources. The primary inputs that were evaluated for this case study were those corresponding to properties obtained from the backcalculation process (aggregate base modulus, subgrade modulus, and k-value).
The performance criteria used for the design of this whitetopping alternative are listed in table 83. An overall reliability level of 90 percent was selected for this case study as well as a 20‑year analysis period.
Table 83. MEPDG performance criteria for JPCP pavement.
| Performance Criteria | Limit |
|---|---|
| Initial IRI (inches/mi) | 63 |
| Terminal IRI (inches/mi) | 172 |
| Transverse cracking (percent slabs cracked) | 15 |
| Mean joint faulting (inches) | 0.12 |
|
1 inch/mi = 0.0158 m/km. 1 inch = 2.54 cm. |
|
The MEPDG (version 1.003) was used to design the whitetopping alternative for the LTPP Program test section 30-0113. Nationally calibrated performance models were used. For the concrete layer properties and the pavement design features, level 3 default values were used. Table 84 and table 85 summarize these values.
Table 84. Concrete layer properties used for the whitetopping design.
| Concrete Property | Value |
|---|---|
| Unit weight (lb/ft3) | 150 |
| Poisson’s ratio | 0.2 |
| CTE (×10-6/ºF) | 5.5 |
| Cementitious material content, (lb/yd3) | 600 |
| Water to cement | 0.42 |
| Aggregate type | Limestone |
| Curing method | Curing compound |
| 28-day PCC modulus of rupture (psi) | 690 |
|
1 lb/ft3 = 0.0160 g/cm3. °F = 1.8 × °C + 32. 1 lb/yd3 = 0.593 kg/m3. 1 psi = 6.89 kPa. |
|
Table 85. Design features used for the whitetopping design.
| Parameter | Value |
|---|---|
| Dowel diameter (inches) | 1 |
| Dowel spacing (inches) | 12 |
| Sealant type | Liquid |
| Joint spacing (ft) | 15 |
|
1 inch = 25.4 mm. 1 ft = 0.305 m. |
|
This section illustrates the procedure for using the backcalculated results as inputs for unbound and bound layers of the existing pavement structure within the MEPDG software.
Unbound Layers
The JPCP overlay rehabilitation design for an existing flexible pavement requires individual layer inputs, including layer modulus and material properties. The dynamic subgrade k-value is an optional input and is entered as part of the “Rehabilitation” screen input (see figure 81). The backcalculation results of the existing pavement were performed using layered elastic backcalculation, so a k-value was not determined. A k-value can be correlated to the determined subgrade modulus using available correlations, but it should be relatively similar to that determined internally by the MEPDG software. The unbound layer moduli can be entered in the layer input screen, but the adjusted value needs to be used because there is no correction factor input for this rehabilitation design.
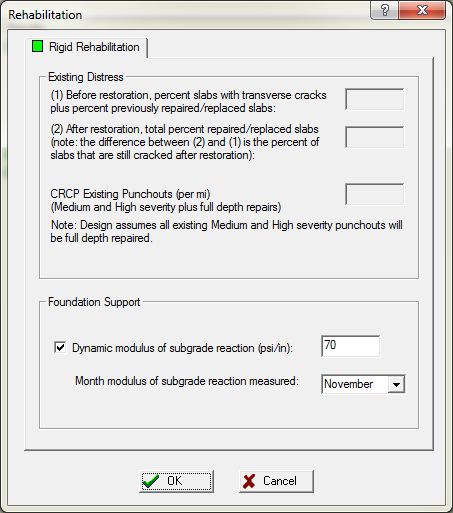
Figure 81. Screen Capture. Rehabilitation screen for JPCP over HMA.
Bound Layers
Although the existing HMA layer modulus was available from backcalculation, the MEPDG software did not use it as an input regardless of level hierarchy selected.
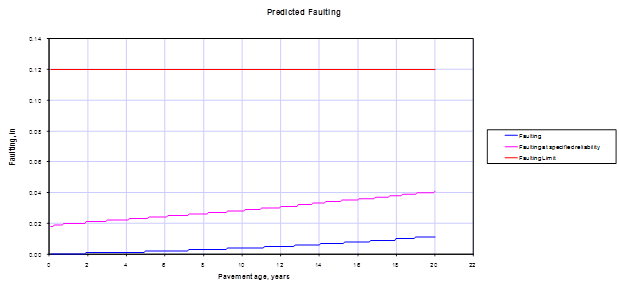
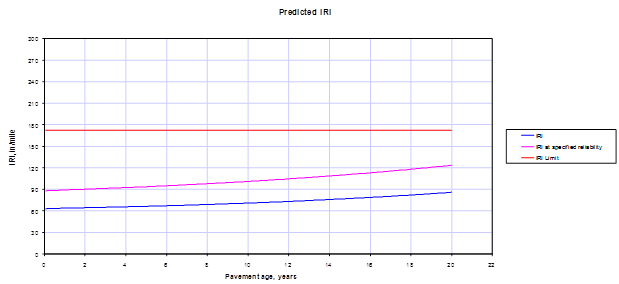
Using the properties mentioned in the previous section for the concrete overlay, a 7‑inch (178‑mm)-thick concrete overlay was determined to be suitable for this section in accordance with performance criteria presented in table 83. The MEPDG results for this analysis are shown in table 86 and in figure 82 through figure 84.
| Performance Criteria | Distress Target | Reliability Target | Predicted Distress | Predicted Reliability | Acceptable |
|---|---|---|---|---|---|
| Terminal IRI (inches/mi) | 172 | 90 | 85.9 | 99.84 | Pass |
| Transverse cracking (percent slabs cracked) | 15 | 90 | 4 | 95.91 | Pass |
| Mean joint faulting (inches) | 0.12 | 90 | 0.011 | 99.999 | Pass |
|
1 inch/mi = 0.0158 m/km. 1 inch = 25.4 mm. |
|||||
1 inch = 25.4 mm.
Figure 82. Graph. Joint faulting versus time for the whitetopping analysis design for test section 30-0113.
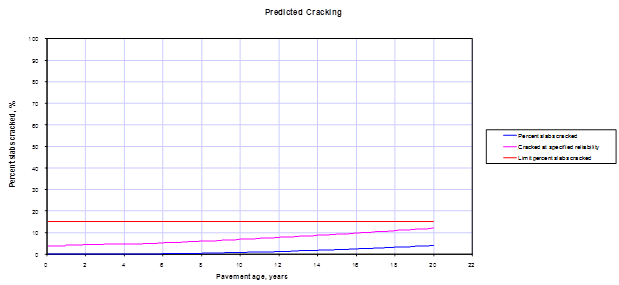
Figure 83. Graph. Transverse cracking versus time for the whitetopping analysis design for test section 30-0113.
1 inch/mi = 0.0158 m/km.
Figure 84. Graph. IRI versus time for the whitetopping analysis design for test section30‑0113.
An attempt to use a thinner overlay failed because of transverse cracking. Table 87 shows the results obtained for a 6-inch (152-mm) concrete overlay design.
| Performance Criteria | Distress Target | Reliability Target | Distress Predicted | Reliability Predicted | Acceptable |
|---|---|---|---|---|---|
| Terminal IRI (inches/mi) | 172 | 90 | 109.1 | 95.98 | Pass |
| Transverse cracking (percent slabs cracked) | 15 | 90 | 32.9 | 4.37 | Fail |
| Mean joint faulting (inches) | 0.12 | 90 | 0.008 | 99.999 | Pass |
|
1 inch/mi = 0.0158 m/km. 1 inch = 25.4 mm. |
|||||
The procedure used within the MEPDG to calculate the composite dynamic k-value for a whitetopping pavement was not specified in the MEPDG documentation. No information was found regarding how the pavement structure was modeled within the MEPDG or which layers of the pavement were used in determining the composite k-value. In an attempt to determine what layers were used within the MEPDG to establish the composite k-value when analyzing a concrete overlay on an HMA pavement, four additional runs were performed.
The MEPDG includes the following two options for defining the pavement structure:
Four additional runs were evaluated to help determine whether the stiffness of the base was included in the composite k-value calculation within the MEPDG. The pavement structures used for these four cases are provided in figure 85. These four runs also helped to determine whether the k-value input was actually used within the MEPDG. This was in question because there was no valid method available for backcalculating a k-value when the FWD testing was performed on an existing HMA pavement. The characteristics of these runs were as follows:
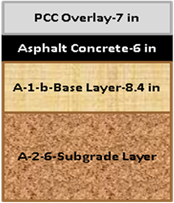
1 inch = 25.4 mm.
Figure 85. Diagram. Pavement structure used for the four runs.
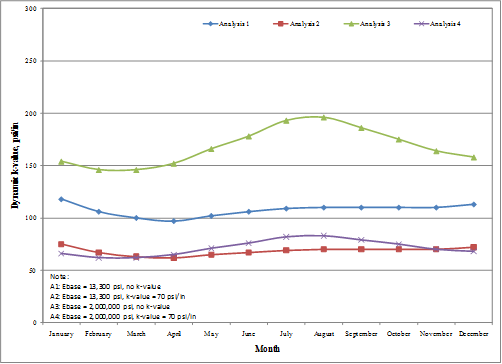
The monthly k-values calculated within the MEPDG for each of these runs are summarized in figure 86. Comparing the results of runs 1 and 3 shows that the difference between an aggregate base stiffness of 13,300 psi (91,700 kPa) and 2 million psi (13,790,000 kPa) resulted in k-values calculated by the MEPDG that were different. Therefore, it can be concluded that the aggregate base stiffness was considered in the calculation of the composite k-value within the MEPDG. A k-value of 70 psi/inch (19 kPa/mm) was provided as an input in the MEPDG for runs 2 and 4. The MEPDG output shows that this value is indeed used as the composite k‑value regardless of the aggregate base stiffness; however, there were slightly different climate adjustments.
1 psi = 6.89 kPa.
1 psi/inch = 0.263 kPa/mm.
Figure 86. Graph. Monthly k-values provided within the MEPDG output for the four runs.
Based on the results from these four runs, it appears that the MEPDG changed the original flexible pavement structure into an equivalent structure consisting of a PCC slab with the same properties as the PCC overlay topped with a base layer with the same properties as the existing HMA overlay; all of this was then supported by Winkler springs having a stiffness equal to composite k-value established using all layers under the existing HMA. Figure 87 shows schematically how the MEPDG changed the original structure into an equivalent structure when calculating the pavement response.
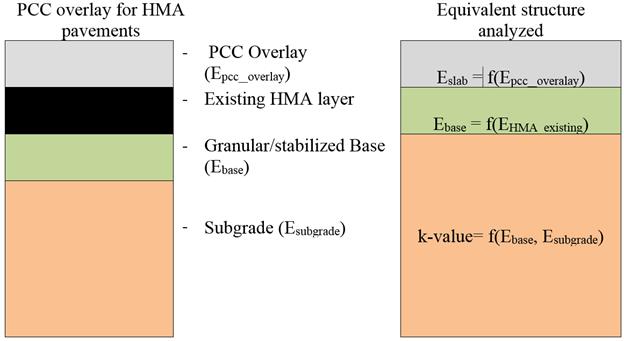
Figure 87. Diagram. Schematic equivalent pavement structure used within the MEPDG to
calculate the pavement response for whitetopping.