Verification of LTPP Virtual Weather Stations Phase I Report: Accuracy and Reliability of Virtual Weather Stations
Task 3: Determine Accuracy of Vws
Estimates and Verify The Vws Algorithm (Cont.)
Comparing Different Methods of
Calculating VWS Estimates
Climatic data from five weather stations (OWS) near SMP and AWS
sites were compared to the collected SMP and AWS data. The daily
data for the five closest weather stations (OWS data) were averaged
using three different methods: (1) without using a weight, (2) by
using the inverse distance square (1/R2)
weight, and (3) by using the inverse distance (1/R)
weight. Also, estimates were made based on the data from the
closest weather station. The resulting estimates were then compared
with the LTPP VWS estimates and SMP and AWS measured data.
Different Methods of Calculating
VWS
Four different methods of calculating VWS were compared with the
LTPP VWS estimates currently available in the IMS database to
investigate the possibility of improving the current LTPP
methodology. The four methods of estimating climatic conditions at
a site using data from nearby weather stations were:
- Closest: Estimate climatic conditions based on data from the
closest weather station.
- Weight 1/R2: Estimate the climatic
parameter based on averaging the data for up to five of the closest
weather stations weighted by the inverse squared distance.
- Weight 1/R: Similar to the previous method; however,
weighting by the inverse distance.
- No Weight: Calculate estimates based on a simple average
without using any weight, as shown in figure 31.
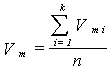
Figure 31. Equation. Average temperature
calculation.
where:
Vm = Calculated data element for day m for the
VWS.
k = Number of weather stations associated with the project
site (up to five).
Vmi = Value of a data element on day m for
weather station i.
Figure 32 shows the distribution of the percent contribution of
the closest weather station to the estimated value for all 880 LTPP
sites when using the 1/R2 rule. The percent
contribution is the ratio of the weight (1/R2)
of the closest weather station to the sum of the weights for all of
the weather stations. It shows that the closest weather station
contributed more than 70 percent to the VWS estimate for half of
the LTPP sites. For this reason, the LTPP VWS estimates are closer
to data from the closest weather station. Figure 33 shows results
for the 1/R rule. It shows that the contribution of the
closest weather station to the estimate is significantly less (less
than 50 percent half of the time) with this method. This
method provides results that are close to using a simple
average.
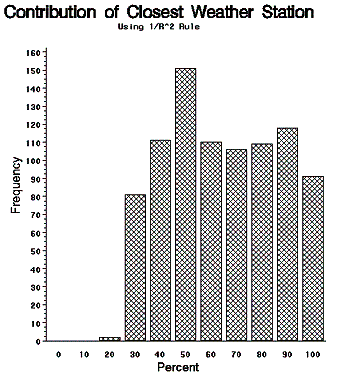
Figure 32. Bar chart. Percent
contribution of closest weather stations to VWS using the
1/R2 rule.
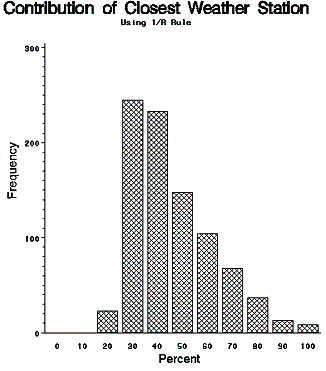
Figure 33. Bar chart. Percent
contribution of closest weather stations to VWS using the
1/R rule.
The overall daily and monthly summaries for the AWS and SMP
sections combined are shown in table 27.
Table 27. Summary statistics for error of daily and
monthly estimates of AWS and SMP maximum temperature using five
different calculation methods.
| Temp. |
Period |
Freq. |
Mean Error (Estimated-Measured), °C |
Standard Deviation Error, °C |
IMS
VWS |
Closest |
Weight
1/R^2 |
Weight
1/R |
No
Weight |
IMS
VWS |
Closest |
Weight
1/R^2 |
Weight
1/R |
No
Weight |
| Max. |
Daily |
30601 |
0.41 |
0.47 |
0.45 |
0.41 |
0.34 |
3.13 |
3.41 |
3.03 |
2.81 |
2.69 |
| Min. |
Daily |
30601 |
-0.14 |
-0.11 |
-0.03 |
-0.06 |
-0.12 |
2.58 |
3.05 |
2.65 |
2.43 |
2.33 |
| Max. |
Monthly |
1170 |
0.41 |
0.48 |
0.44 |
0.4 |
0.33 |
1.14 |
1.44 |
1.26 |
1.12 |
0.99 |
| Min. |
Monthly |
1170 |
-0.14 |
-0.11 |
-0.03 |
-0.06 |
-0.11 |
1.44 |
1.85 |
1.59 |
1.45 |
1.40 |
The following observations were made from table 27:
- The simple average method (No Weight column) provided the
lowest standard deviation of all the methods for the daily and
monthly estimates.
- The next lowest standard deviation was provided by the inverse
distance method (Weight 1/R column), which provided more
precise estimates (lower standard error) than the inverse distance
squared method (Weight 1/R2 column).
- The estimate based on the closest weather station (Closest
column) gave the highest standard error and the highest mean error.
This method provided the poorest climatic estimates.
- All methods gave a similar mean error of the estimate for the
daily and monthly estimates.
- The overall standard deviation of error of the simple average
method was at least 10 percent lower than the inverse squared
distance method (Weight 1/R2 column).
In summary, the SMP and AWS data showed that the simple average
method was the best method, while weighting by 1/R was the
next best. Estimates from the closest weather station were the
poorest. This validates the use of multiple weather stations in
estimates.
Comparing Different Methods of
Estimating
The four different methods of estimating daily climatic data
explained in the previous section and the VWS estimates currently
in the IMS were compared with the climatic data for the AWS
sections. Table 28 includes the mean and standard deviation of
error (difference between the AWS measured and estimated
temperatures) for the maximum air temperature for the five
different methods of estimating the daily temperature. Table 29 includes the same data for minimum
temperature. Similar data for SMP sites are included in tables
30 and 31.
Table 28. Summary statistics for error of daily estimates
of AWS maximum temperature using three different calculation
methods.
| No. |
AWS
ID |
Days
of
Data |
Mean Error (AWS-Estimate), °C |
Standard Deviation Error, °C |
IMS
VWS |
Closest |
Weight
1/R^2 |
Weight
1/R |
No
Weight |
IMS
VWS |
Closest |
Weight
1/R^2 |
Weight
1/R |
No
Weight |
| 1 |
10101 |
673 |
-0.05 |
-0.39 |
-0.05 |
-0.02 |
0 |
3.03 |
3.58 |
3.05 |
2.97 |
2.90 |
| 2 |
40100 |
604 |
4.98 |
7.02 |
6.56 |
5.63 |
4.14 |
1.28 |
2.18 |
2.03 |
1.80 |
1.52 |
| 3 |
40200 |
643 |
1.29 |
1.49 |
1.29 |
1.16 |
1.04 |
1.62 |
1.66 |
1.62 |
1.57 |
1.52 |
| 4 |
50113 |
579 |
0.05 |
0.29 |
-0.02 |
-0.08 |
-0.14 |
3.20 |
4.26 |
3.46 |
3.27 |
3.13 |
| 5 |
80200 |
443 |
-0.45 |
-0.48 |
-0.44 |
-0.31 |
-0.07 |
5.82 |
6.37 |
5.84 |
4.44 |
2.74 |
| 6 |
100100 |
395 |
-0.26 |
-0.43 |
-0.26 |
-0.21 |
-0.17 |
2.59 |
2.04 |
2.55 |
2.49 |
2.29 |
| 7 |
120101 |
201 |
0.05 |
0.23 |
0.04 |
-0.13 |
-0.33 |
2.23 |
2.43 |
2.23 |
2.03 |
1.82 |
| 8 |
200100 |
144 |
-0.58 |
-0.12 |
-0.12 |
-0.12 |
0.46 |
5.09 |
1.45 |
1.44 |
1.31 |
2.69 |
| 9 |
200200 |
141 |
0.45 |
1.20 |
0.50 |
0.18 |
-0.14 |
2.75 |
2.11 |
2.78 |
3.08 |
3.28 |
| 10 |
300800 |
706 |
1.40 |
1.47 |
1.41 |
1.14 |
0.65 |
2.48 |
2.51 |
2.48 |
2.44 |
2.69 |
| 11 |
310100 |
139 |
-0.38 |
-0.55 |
-0.37 |
-0.17 |
0.05 |
4.14 |
5.16 |
4.17 |
3.29 |
2.45 |
| 12 |
320200 |
547 |
0.82 |
1.06 |
0.83 |
0.61 |
0.35 |
1.51 |
1.45 |
1.50 |
1.67 |
1.98 |
| 13 |
350101 |
150 |
0.40 |
0.96 |
0.40 |
0.14 |
-0.08 |
2.69 |
3.13 |
2.71 |
2.55 |
2.45 |
| 14 |
350801 |
141 |
0.33 |
2.11 |
1.68 |
0.98 |
0.03 |
1.37 |
2.21 |
1.96 |
1.73 |
1.63 |
| 15 |
360800 |
391 |
0.58 |
0.67 |
0.59 |
0.57 |
0.56 |
2.33 |
2.46 |
2.35 |
2.46 |
2.67 |
| 16 |
370200 |
863 |
0 |
0 |
0 |
-0.03 |
-0.17 |
1.60 |
1.60 |
1.60 |
1.63 |
1.81 |
| 17 |
380200 |
389 |
0.48 |
0.50 |
0.48 |
0.46 |
0.44 |
4.06 |
4.40 |
4.09 |
3.03 |
1.59 |
| 18 |
390200 |
611 |
-0.42 |
-0.53 |
-0.42 |
-0.20 |
0.10 |
4.33 |
4.59 |
4.33 |
3.84 |
3.20 |
| 19 |
460800 |
66 |
-0.25 |
-0.60 |
-0.26 |
-0.15 |
-0.14 |
1.66 |
1.91 |
1.65 |
1.60 |
1.64 |
| 20 |
480801 |
69 |
0.89 |
1.45 |
0.90 |
0.72 |
0.55 |
1.36 |
0.71 |
1.35 |
1.93 |
2.57 |
| 21 |
490800 |
40 |
2.39 |
1.86 |
2.35 |
2.43 |
2.49 |
2.25 |
2.17 |
2.28 |
2.35 |
2.42 |
| 22 |
510100 |
358 |
-0.30 |
-0.05 |
-0.29 |
-0.45 |
-0.54 |
4.47 |
4.62 |
4.48 |
4.17 |
3.70 |
| 23 |
530200 |
597 |
-0.55 |
-0.90 |
-0.47 |
-0.14 |
0.21 |
3.07 |
3.65 |
2.95 |
2.48 |
2.07 |
| 24 |
530800 |
497 |
-0.35 |
-0.20 |
-0.21 |
-0.25 |
-0.40 |
3.61 |
2.10 |
2.08 |
2.12 |
2.77 |
| All Days |
9387 |
0.5 |
0.69 |
0.64 |
0.55 |
0.40 |
3.36 |
3.74 |
3.43 |
3.04 |
2.69 |
| Avg. Section |
391.1 |
0.44 |
0.67 |
0.59 |
0.49 |
0.37 |
2.86 |
2.86 |
2.71 |
2.51 |
2.40 |
Table 29. Summary statistics for error of daily estimates
of AWS minimum temperature using three different calculation
methods.
| No. |
AWS ID |
Days
of
Data |
Mean Error (AWS-Estimate), °C |
Standard Deviation Error, °C |
IMS
VWS |
Closest |
Weight
1/R^2 |
Weight
1/R |
No
Weight |
IMS
VWS |
Closest |
Weight
1/R^2 |
Weight
1/R |
No
Weight |
| 1 |
10101 |
673 |
-0.01 |
-0.75 |
-0.01 |
0.01 |
-0.01 |
2.07 |
2.60 |
2.07 |
2.01 |
1.98 |
| 2 |
40100 |
604 |
2.24 |
6.66 |
5.21 |
3.02 |
0.22 |
2.34 |
2.31 |
2.23 |
2.22 |
2.35 |
| 3 |
40200 |
643 |
-1.01 |
-1.46 |
-1.01 |
-0.55 |
0 |
1.54 |
1.83 |
1.54 |
1.39 |
1.34 |
| 4 |
50113 |
579 |
-0.47 |
-0.77 |
-0.82 |
-0.66 |
-0.45 |
2.03 |
3.01 |
2.23 |
2.02 |
1.83 |
| 5 |
80200 |
443 |
-1.05 |
-1.09 |
-1.06 |
-0.98 |
-0.93 |
2.70 |
2.97 |
2.70 |
2.06 |
1.51 |
| 6 |
100100 |
395 |
1.45 |
1.26 |
1.44 |
1.61 |
1.75 |
1.96 |
1.94 |
1.96 |
1.90 |
1.77 |
| 7 |
120101 |
201 |
-0.26 |
-0.35 |
-0.26 |
-0.15 |
0.05 |
1.20 |
1.35 |
1.20 |
1.12 |
1.20 |
| 8 |
200100 |
144 |
-1.36 |
-0.93 |
-0.93 |
-0.94 |
-0.61 |
2.98 |
1.31 |
1.30 |
1.24 |
1.61 |
| 9 |
200200 |
141 |
0.77 |
1.38 |
0.81 |
0.55 |
0.32 |
1.81 |
1.74 |
1.83 |
1.90 |
1.94 |
| 10 |
300800 |
706 |
-1.67 |
-1.58 |
-1.66 |
-1.98 |
-2.48 |
2.35 |
2.42 |
2.35 |
2.15 |
2.21 |
| 11 |
310100 |
139 |
-0.53 |
-0.81 |
-0.54 |
-0.29 |
-0.02 |
2.42 |
2.97 |
2.42 |
1.93 |
1.50 |
| 12 |
320200 |
547 |
-0.58 |
-0.62 |
-0.58 |
-0.57 |
-0.58 |
1.95 |
2.12 |
1.95 |
1.85 |
1.82 |
| 13 |
350101 |
150 |
-1.25 |
-0.88 |
-1.27 |
-1.47 |
-1.66 |
1.87 |
2.23 |
1.87 |
1.78 |
1.76 |
| 14 |
350801 |
141 |
-1.71 |
1.23 |
0.49 |
-0.52 |
-1.70 |
1.67 |
2.23 |
1.93 |
1.72 |
1.72 |
| 15 |
360800 |
391 |
-0.21 |
0.08 |
-0.19 |
-0.31 |
-0.44 |
1.71 |
1.89 |
1.72 |
1.74 |
1.83 |
| 16 |
370200 |
863 |
0.01 |
0.03 |
0.01 |
-0.15 |
-0.35 |
1.94 |
1.96 |
1.94 |
1.75 |
1.51 |
| 17 |
380200 |
389 |
-0.26 |
-0.33 |
-0.26 |
-0.05 |
0.24 |
2.76 |
2.97 |
2.77 |
2.13 |
1.42 |
| 18 |
390200 |
611 |
-0.27 |
-0.39 |
-0.27 |
-0.04 |
0.28 |
3.19 |
3.46 |
3.19 |
2.74 |
2.25 |
| 19 |
460800 |
66 |
0.49 |
0.38 |
0.50 |
0.54 |
0.57 |
2.17 |
2.44 |
2.17 |
2.06 |
1.98 |
| 20 |
480801 |
69 |
-0.04 |
0.96 |
-0.03 |
-0.43 |
-0.80 |
1.16 |
0.74 |
1.16 |
1.67 |
2.21 |
| 21 |
490800 |
40 |
2.88 |
2.69 |
2.82 |
2.88 |
2.97 |
2.92 |
2.97 |
2.96 |
3.01 |
3.09 |
| 22 |
510100 |
358 |
-0.86 |
-0.32 |
-0.84 |
-1.22 |
-1.51 |
3.06 |
3.19 |
3.06 |
2.80 |
2.41 |
| 23 |
530200 |
597 |
-0.89 |
-1.09 |
-0.71 |
-0.33 |
0.13 |
1.85 |
2.18 |
1.81 |
1.65 |
1.62 |
| 24 |
530800 |
497 |
-0.34 |
0.77 |
0.72 |
0.49 |
-0.36 |
1.62 |
1.76 |
1.70 |
1.50 |
1.45 |
| All Days |
9387 |
-0.30 |
0.01 |
-0.02 |
-0.15 |
-0.34 |
2.40 |
3.09 |
2.68 |
2.27 |
2.05 |
| Avg. Section |
391.1 |
-0.21 |
0.17 |
0.07 |
-0.06 |
-0.22 |
2.14 |
2.27 |
2.09 |
1.93 |
1.85 |


