U.S. Department of Transportation
Federal Highway Administration
1200 New Jersey Avenue, SE
Washington, DC 20590
202-366-4000
Federal Highway Administration Research and Technology
Coordinating, Developing, and Delivering Highway Transportation Innovations
 |
| This report is an archived publication and may contain dated technical, contact, and link information |
|
Publication Number: FHWA-HRT-11-050 Date: June 2011 |
Larry Wiser, HRDI-30, (202) 493-3079,
larry.wiser@dot.gov
PDF files can be viewed with the Acrobat® Reader®
This document is a technical summary of the Federal Highway Administration report, Impact of Design Features on Pavement Response and Performance in Rehabilitated Flexible and Rigid Pavements (FHWA-HRT-10-066).
The Long Term Pavement Performance (LTPP) program is a 20-year study of in-service pavements across North America. Its goal is to extend the life of highway pavements through various designs of new and rehabilitated pavement structures using different materials and under different loads, environments, subgrade soil, and maintenance practices. LTPP was established under the Strategic Highway Research Program and is now managed by the Federal Highway Administration.
This TechBrief presents a general comparison of performance for rehabilitation strategies for flexible and rigid pavement. The impact of overlay thickness, preparation prior to overlay, and mix type on performance was statistically evaluated using data from the Long-Term Pavement Performance (LTPP) Specific Pavement Study (SPS)-5 and SPS-6 experiments.
LTPP developed two SPSs to provide quality data for developing improved methodologies and strategies for flexible (SPS-5) and rigid (SPS-6) pavement rehabilitation. Techniques commonly used in the United States and Canada were applied to test sections on a continuous highway site, which guaranteed all sections were subjected to the same climate conditions and traffic and were constructed under the same subgrade and pavement structure. The factors considered in the experiment included the type of treatment, surface condition before rehabilitation was completed, environmental conditions, and traffic loading. There were 32 sites built for SPS-5 and SPS-6: 18 sites were rehabilitation projects over flexible pavements, 8 were asphalt concrete (AC) over joint plain concrete pavements (JPCP), and 6 were over joint reinforced concrete pavements (JRCP). These sites were monitored for periods ranging from 8 to 17 years. The project factorial is presented in table 1.
Table 1. SPS-5 and SPS-6 experiment factorial at each site.
Pavement Type |
Section/Treatment |
|
|---|---|---|
SPS-5/flexible |
0501: Control—No treatment |
|
Sections Without Milling |
Sections With Milling |
|
0502: Thin overlay (51 mm)—Reclaimed asphalt pavement (RAP) |
0506: Thin overlay—Virgin mix |
|
0503: Thick overlay (127 mm)—RAP |
0507: Thick overlay—Virgin mix |
|
0504: Thick overlay—Virgin mix |
0508: Thick overlay—RAP |
|
0505: Thin overlay—Virgin mix |
0509: Thin overlay—RAP |
|
SPS-6/JPCP and |
0601: Routine maintenance (control) |
0605: Maximum restoration |
0602: Minimum restoration |
0606: Maximum restoration—102 mm overlay |
|
0603: Minimum restoration— |
0607: Crack/break and seat—102 mm overlay |
|
0604: Saw and seal AC over joints—102 mm overlay |
0608: Crack/break and seat—203 mm overlay |
|
1 inch = 25.4 mm
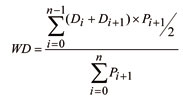
An important step for this analysis was the selection of an analysis parameter that could represent pavement performance and provide a means for comparison between different sections and different sites. The weighted distress average (WD) (unit area under the distress performance curve over time) over the survey period was selected as the performance measure. WD is a measure of pavement performance relative to the specific distress over the entire survey period, corresponding to the period in which performance is monitored. Moreover, it is a normalized value because it is divided by the total year survey period, allowing for comparisons when survey periods are different. It is calculated using the following equation:
 (1)
(1)
Where Di is the distress value measured at the ith survey, Pi + 1 is the period (in years) between survey i and survey i + 1, i is the survey number (i = 0 is the initial distress level immediately after the treatment), and n is the total number of surveys for the section.
WD is related to pavement performance over the entire survey period. This concept is similar to performance originally defined as area under the serviceability curve. The effect of variability from measurements by different surveyors is reduced. Most importantly, WD provided a parameter to compare sections with different survey periods.
The major challenge for a broad comparison of performance is the intrinsic variability in factors associated with pavement performance such as traffic, pavement structure, and climate. Each site in the SPS-5 and SPS-6 experiments was located on a different road segment with different in situ and climatic conditions. As a result, direct comparison was not appropriate. The alternative to simultaneously evaluating the performance of each rehabilitation strategy in all sites in SPS-5 and SPS-6 was to use the Friedman test, which is a nonparametric test (distribution-free) used to compare observations repeated on the same subjects. Unlike the more common parametric repeated measures such as analysis of variance (ANOVA) or paired t-test, the Friedman test makes no assumptions about the distribution of the data (e.g., normality). In addition, it can be used for multiple comparisons, as is the case for the SPS-5 and SPS-6 experiments that have multiple rehabilitation alternatives. The Friedman test uses the ranks of the data rather than their raw values to calculate the statistic. The test statistic for the Friedman's test is a Chi-square with n - 1 degrees of freedom, where n is the number of repeated measures (i.e., the number of sections in each site of the experiment).
Long-term performance of rehabilitation alternatives was evaluated using WD as the parameter for ranking performance through Friedman ANOVA. Major distresses were evaluated, and the outcomes for smoothness and fatigue cracking are summarized in this TechBrief.
Performance ranking based on smoothness long-term trends is shown in figure 1. Low ranks (e.g., 1) represent best performance. The bars represent the Friedman average ranking of rehabilitation strategies from all 18 sites in the SPS-5 experiment. Thick overlays show the best smoothness. There was no significant difference in smoothness between mix types (reclaimed asphalt pavement (RAP) versus virgin). Milling the surface prior to overlay created a statistically significant advantage for smoothness trends. The worst smoothness was observed in sections with thin overlays. Combined with thin overlays, milling provided a slight advantage over not milling, but no statistical difference was found. Figure 2 shows similar data for fatigue cracking. Thick overlays had less fatigue cracking than thin overlays. Virgin and RAP mixes had statistically equivalent cracking. Milling prior to overlay was shown to statistically lower fatigue cracking.
The results from the Friedman ANOVA were also used to develop a practical ranking of strategies (from best (B) to worst (W)). A statistical significance test was performed among all ranks shown in figure 1 and figure 2. Statistically equivalent performing strategies were grouped in similar ranks. These ranks are also presented in tabular form in figure 1 and figure 2 along with the design features of each strategy.
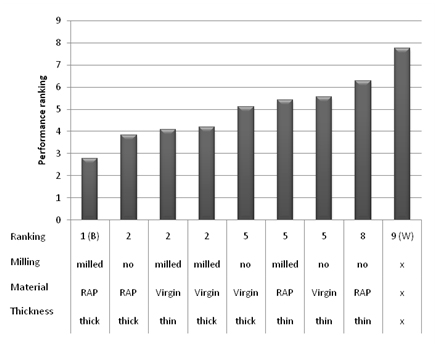
Figure 1. Graph. Performance ranking based on long-term roughness for SPS-5 experiment.
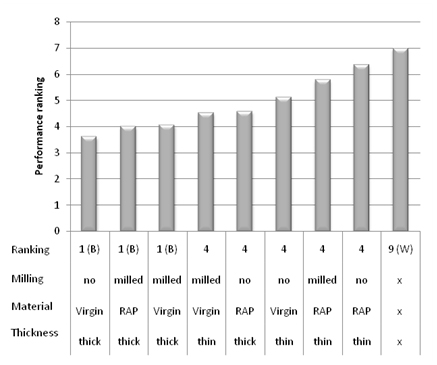
Figure 2. Graph. Performance ranking based on fatigue cracking for SPS-5 experiment.
A similar analysis was performed for rehabilitated rigid pavement sections that are part of the SPS-6 experiment. Since there were rehabilitation strategies involving hot mix asphalt (HMA) overlays, and pavements were monitored according to their surface layer type, smoothness was the only distress measured. This was common to all surface types in SPS-6.
Figure 3 shows the average ranking of strategies based on smoothness for JPCP sites obtained from the Friedman analysis. The best strategy for HMA overlays of JPCP was crack/break and seat with an 8-inch HMA overlay. In addition, 4-inch overlays with minimum, maximum, and saw and seal restorations were the second best strategies for JPCP. The worst for overlay rehabilitation for JPCP was a 4-inch overlay with crack/break. The best non-overlay rehabilitation strategy for JPCP was maximum preparation followed by minimum preparation and control. The results for JRCP were different (see figure 4). The best strategies were an 8-inch HMA overlay with break/crack and 4-inch overlays with minimum, maximum, and crack/break. The next best overlay was a 4-inch HMA overlay with crack/break and saw and seal. The non-overlay strategies of minimum and maximum preparation showed the same performance. The JRCP control strategy showed the worst smoothness performance. Strategies with the same ranking had statistically equivalent performances.
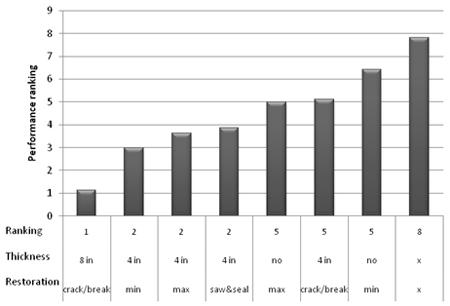
Figure 3. Graph. Performance ranking based on long-term roughness for SPS-6 JPCP sections.
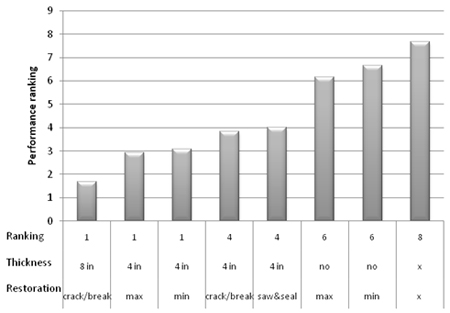
Figure 4. Graph. Performance ranking based on long-term roughness for SPS-6 JRCP sections.
Statistical evaluation of performance of different rehabilitation strategies for flexible and rigid pavements was conducted using LTPP SPS-5 and SPS-6 experiments. The results, based on statistical significance, indicate that thick overlays improved performance of rehabilitated flexible pavements for smoothness and fatigue cracking. Milling the existing HMA surface prior to overlay was effective in keeping the overlay smoother. Mix type (RAP or virgin HMA) did not have a statistically significant effect on performance.
Smoothness performance was significantly improved in all JPCP and JRCP sections overlaid with HMA. Thicker HMA overlays produced smoother pavements. In comparison, rigid pavement rehabilitation strategies without HMA overlay did not exhibit as smooth of a surface. The maximum preparation showed improved smoothness over minimum preparation for JPCP but not for JRCP. It must be noted that the construction costs would be different for these various rehabilitation strategies. The above results relate strictly to performance and can be used as one component of the decisionmaking process, along with cost, material availability, and contractor experience.
Researchers—This study was performed by Applied Research Associates, Inc., Elkridge, MD. Distribution—This TechBrief is being distributed according to a standard distribution. Direct distribution is being made to the Divisions and Resource Center. Availability—The publication from which this TechBrief was developed, Impact of Design Features on Pavement Response and Performance in Rehabilitated Flexible and Rigid Pavements (FHWA- HRT-10-066), is available from FHWA Product Distribution Center. Key Words—Pavement performance, Flexible pavement, Rigid pavement, Pavement rehabilitation, LTPP data, Data analysis, and SPS. Notice—This document is disseminated under the sponsorship of the U.S. Department of Transportation in the interest of information exchange. The U.S. Government assumes no liability for the use of the information contained in this document. The U.S. Government does not endorse products or manufacturers. Trademarks or manufacturers' names appear in this report only because they are considered essential to the objectives of the document. Quality Assurance Statement—The Federal Highway Administration (FHWA) provides high-quality information to serve the Government, industry, and public in a manner that promotes public understanding. Standards and policies are used to ensure and maximize the quality, objectivity, utility, and integrity of its information. FHWA periodically reviews quality issues and adjusts its programs and processes to ensure continuous quality improvement. |

