U.S. Department of Transportation
Federal Highway Administration
1200 New Jersey Avenue, SE
Washington, DC 20590
202-366-4000
Federal Highway Administration Research and Technology
Coordinating, Developing, and Delivering Highway Transportation Innovations
| REPORT |
| This report is an archived publication and may contain dated technical, contact, and link information |
| Publication Number: FHWA-HRT-12-030 Date: August 2012 |
Publication Number: FHWA-HRT-12-030 Date: August 2012 |
PDF Version (4.44 MB)
PDF files can be viewed with the Acrobat® Reader®
It was observed that the data generated for the dependent variable, deltaT, correlated well with the material, design, and climate parameters when transformed from deltaT temperature differential to deltaT temperature gradient. This involved dividing the deltaT temperature differential by the slab thickness. A step-wise regression analysis and Cp analyses were performed to select the variables that are correlated to the dependent variable and to select the best combination of variables to develop the model. After an iterative process to optimize the model, the equation developed to estimate the deltaT gradient variable is as follows:
![]()
Where:
deltaT/inch = Predicted average gradient through JPCP slab, °F/inch.
TR = Difference between maximum and minimum temperature for the month of construction, °F.
SW= Slab width, ft.
PCCTHK=JPCP slab thickness, inch.
uw = Unit weight of PCC used in JPCP slab, lb/ft3.
w/c = w/c ratio.
latitude = Latitude of the project location, degrees.
The model considers climate (TR, latitude), design (SW, PCCTHK), and material (uw, w/c) parameters. The model statistics are presented in table 53. The model was developed with 147 data points and has an R2 value of 0.4967 percent and an RMSE value of 0.3199 psi. Table 54 provides details of the range of data used to develop the model. Figure 215 shows the predicted versus measured for the proposed JPCP deltaT gradient model, while figure 216 shows the residual errors. Note that the measured data here refer to the deltaT gradient determined by matching MEPDG prediction to field performance. Figure 217 shows the predicted versus measured deltaT for the model.
|
Variable |
DF |
Estimate |
Standard Error |
t-Value |
Pr > t |
VIF |
|
Intercept |
1 |
-5.27805 |
1.06943 |
-4.94 |
< 0.0001 |
0 |
|
TR |
1 |
-0.00794 |
0.00396 |
-2 |
0.047 |
1.86047 |
|
SW |
1 |
-0.0826 |
0.03432 |
-2.41 |
0.0174 |
1.07141 |
|
PCCTHK |
1 |
0.18632 |
0.0195 |
9.55 |
< 0.0001 |
1.0642 |
|
uw |
1 |
0.01677 |
0.00669 |
2.51 |
0.0133 |
1.22792 |
|
w/c |
1 |
1.14008 |
0.2914 |
3.91 |
0.0001 |
1.14857 |
|
Latitude |
1 |
0.01784 |
0.0072 |
2.48 |
0.0144 |
1.85265 |
The model statistics for table 54 are as follows:
|
Parameter |
Minimum |
Maximum |
Average |
|
Temperature range |
21.2 |
64.5 |
47.4 |
|
Slab width |
12.0 |
14.0 |
12.5 |
|
PCC thickness |
6.4 |
14.3 |
9.6 |
|
Unit weight |
134 |
156 |
147 |
|
w/c ratio |
0.27 |
0.72 |
0.46 |
|
Latitude |
27.93 |
49.60 |
39.58 |
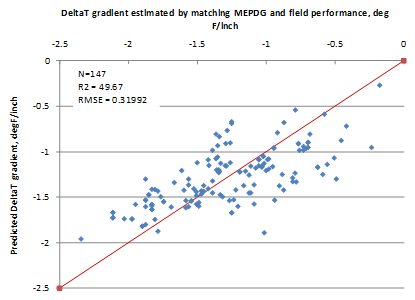
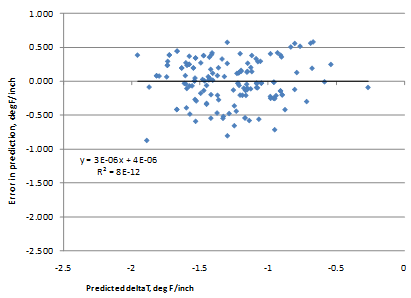
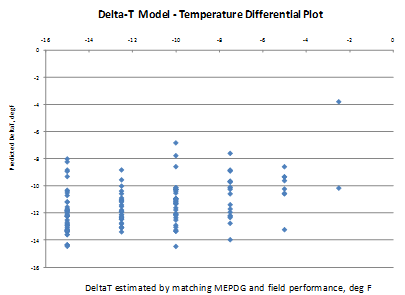
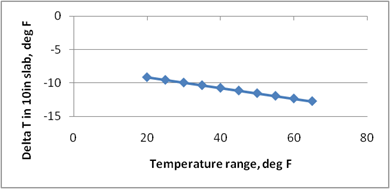
Figure 218 through figure 224 present the sensitivity analysis performed to examine the impact of varying the model parameters on its prediction. The parameters included are temperature range, slab width, slab thickness, unit weight, w/c ratio, and latitude. For each sensitivity analysis, the variable of interest was varied while holding all other variables constant at their typical values. Typical values used in this analysis were 24 °F, 12-ft slab width, 10-inch slab thickness, 145 lb/ft3 PCC unit weight, 0.40 w/c ratio, and 40 degrees latitude.
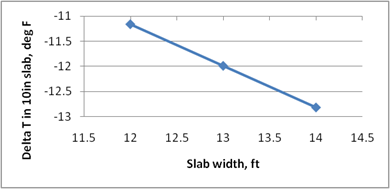
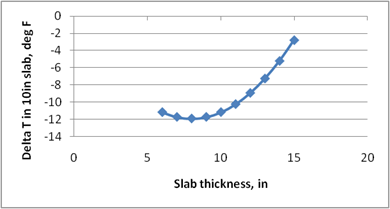
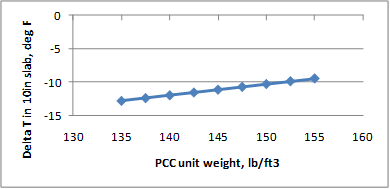
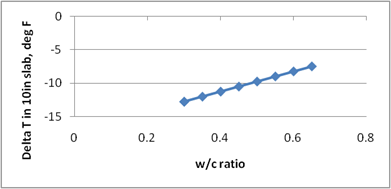
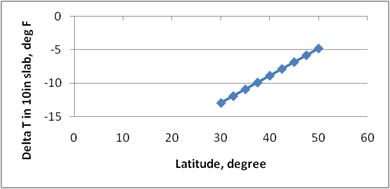
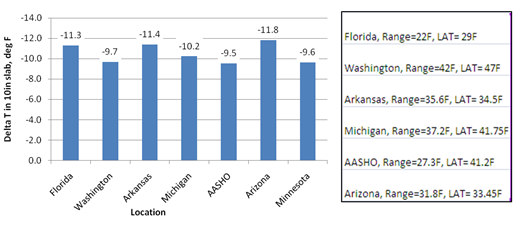
The following list contains brief observations from these sensitivity analyses: