U.S. Department of Transportation
Federal Highway Administration
1200 New Jersey Avenue, SE
Washington, DC 20590
202-366-4000
Federal Highway Administration Research and Technology
Coordinating, Developing, and Delivering Highway Transportation Innovations
| REPORT |
| This report is an archived publication and may contain dated technical, contact, and link information |
|
| Publication Number: FHWA-HRT-12-068 Date: December 2012 |
Publication Number: FHWA-HRT-12-068 Date: December 2012 |
This appendix describes the process of extracting profile measurements for each test section from longer measurements that cover multiple test sections. The process described ensured that repeat measurements within a given visit and sets of repeat measurements from multiple visits have consistent boundaries.
Searching for the longitudinal offset between repeat profile measurements that provides the best agreement between them is a helpful way to refine the synchronization. This can be done by inspecting filtered profile plots, but it is very time consuming. Visual assessment is also somewhat subjective when two profiles do not agree well, which is often the case when measurements are made several years apart. Rather than visual inspection, an automated procedure was used for finding the longitudinal offset between measurements.
The procedure is based on a customized version of cross correlation.(10) In this procedure, a basis measurement that is considered to have the correct longitudinal positioning is designated. A candidate profile is then searched for the longitudinal offset that provides the highest cross correlation to the basis measurement. A high level of cross correlation requires a good match of profile shape, the location of isolated rough spots, and overall roughness level. Therefore, the correlation level is often only high when the two measurements are synchronized. Great care was required for the profiles in this study, because local peaks in correlation were observed every 15 ft, where joints from the two profiles aligned. However, the highest correlation level was only observed when the profiles were truly synchronized. When the optimal offset is found, a profile is extracted from the candidate measurement with the proper overall length and endpoint positions. For the rest of this discussion, this process will be referred to as automated synchronization.
For this application, cross correlation was performed after the IRI filter was applied to the profiles rather than using unfiltered profiles. This helped assign the proper weighting to relevant profile features. In particular, it increased the weighting of short-wavelength roughness that may appear at joints. This enhanced the effectiveness of the automated synchronization procedure. The long-wavelength content within the IRI output helped ensure the longitudinal positioning was nearly correct, and the short-wavelength content was able to leverage roughness near joints to fine-tune the positioning.
In visits 01–11, the profiler covered all test sections in each pass with a single, long run. In visits 12–15, the profiler covered portions of the site in each pass, and the site was split into either four or five groups of test sections.
Profiles of individual test sections were extracted from the raw measurements using the following steps:
Data for visits 09–15 were provided after visits 01–08 were synchronized. Visits 09–15 were synchronized using steps 3–5 but going forward in time.
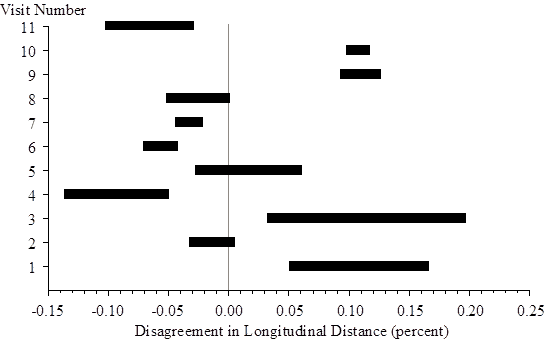
When the longitudinal placement of the individual sections within each measurement were compared to the layout within the basis set, the slope of the linear fit ranged from 0.9995 to 1.0000. Thus, the longitudinal distance measurement for the nine profile measurements of visit 08 was consistent within 0.05 percent. This is a very high level of agreement in longitudinal distance measurement. Figure 24 shows the disagreement in longitudinal distance measurement for visits 01–11 using the original basis set as a reference. In visits 12–15, the site was not covered in a single, long run in each pass, so the visits were excluded from this analysis. In the figure, a range of disagreement for each visit exists because up to nine repeat profile measurements were made. The variation between repeat measurements within a visit appears as the width of each bar in the figure. Because the longitudinal distance measurement was based on the rotation of a drive wheel, the variations were most likely caused by variations in speed, lateral wander, and tire inflation pressure.(11) If tire inflation pressure were the dominant cause, the disagreement would grow more positive with each successive repeat measurement as the tire heated up. This is because the tire rolling radius would increase, and the profiler would register less wheel rotation for the same travel distance. This appeared to be the case for visits 04–10, but the effect was never greater than 0.10 percent of the overall distance.

|
| © ADOT |
| Figure 24. Graph. Consistency in Longitudinal Distance Measurement. |
The variation between visits in figure 24 was caused by differences in distance measurement instrument calibration. The longitudinal distance measured by a profiler is not a true horizontal distance. It includes additional components because the profiler must travel up and down undulations in the road. This component can be minimized by calibrating the profiler to true horizontal distance. However, if a profiler operates on a road with grade changes and roughness that are not similar to the site used for longitudinal distance measurement calibration, some error will exist. For consistent results, tire inflation pressure must also be close to the level used during calibration.
Modest inconsistency in longitudinal distance measurement between visits is not critical as long as the profiles of individual sections are extracted using event markers rather than longitudinal distance from the start of each profile measurement. A high level of inconsistency, however, could interfere with comparisons between profile features and distress surveys. Errors in profile index values, such as IRI, are also roughly of the same order as errors in longitudinal distance measurement.(11) Figure 24 shows that longitudinal distance was measured with a very high level of agreement throughout all 11 visits.