U.S. Department of Transportation
Federal Highway Administration
1200 New Jersey Avenue, SE
Washington, DC 20590
202-366-4000
Federal Highway Administration Research and Technology
Coordinating, Developing, and Delivering Highway Transportation Innovations
 |
| This report is an archived publication and may contain dated technical, contact, and link information |
|
Publication Number: FHWA-RD-01-166 Date: November 2003 |
The purpose of this chapter is to provide an evaluation of the early observations based on initial performance data and to identify performance differences both within and between the SPS-1 projects. This is not intended to be a comprehensive analysis of the performance data of the SPS-1 experiment. Appendix A includes a summary of the amount of distress and performance data that have been collected at each of the 18 SPS-1 sites over time.
Six performance indicators were reviewed initially to evaluate potential differences between the test sections (both within and between projects) and to identify performance trends from the early observations. These performance and structural response indicators included fatigue cracking, rutting, longitudinal cracking in the wheel path and outside the wheel path, transverse cracking, IRI, and deflections measured by sensors 1 and 7.
The time-series data were plotted to observe trends for each of the monitoring data elements. The examples in figures 18 through 21 compare the performance of the test sections with and without drainage layers for all of the SPS-1 projects (between-project differences). As shown, many of these test sections have little to no distress at this time, making it difficult to identify any effect of the key experimental factors on performance. There also is extensive variability (i.e., traffic levels) between the test site companion full factorial projects, making any kind of graphical comparison very difficult to interpret.
Time-series data were also plotted for the individual projects to observe and evaluate trends between the test sections of the same project and to identify possible anomalies in the performance data. Examples of the time-series distress data plots are shown in figures 22 through 24. As shown, there is extensive variability in the data and, more importantly, many of the distresses (and deflections) abruptly decrease with time. This decrease in the magnitudes of the individual distresses (or inconsistent time-series data) is probably related to differences in the distress interpretation between different surveyors and measurement error. These inconsistent trends severely complicate graphical comparisons and other analyses based on early distress observations. Thus, only those distresses with reasonably consistent time-series data were used to evaluate early performance trends from the experiment. These distresses include rut depths, IRI, fatigue cracking, and transverse cracking.
Table 20 lists the percentage of the core test sections with distress magnitudes that can be used in comparative studies and in future calibration and validation studies of distress prediction models. As tabulated, relatively few of the core test sections have exhibited distress magnitudes that exceed the “minimum value” for each of the four distresses, with the exception of rutting; 18 percent of the test sections exceed the minimum rut depth of 7 mm.
The following provides a brief overview relative to the four major distress types or performance indicators.
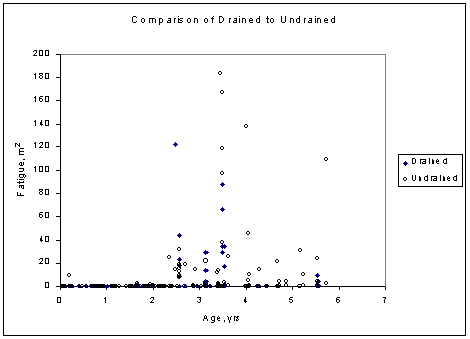
Figure 18. Area of fatigue cracking measured over
time comparing test sections with
and without
permeable base layers for all SPS-1 projects combined.
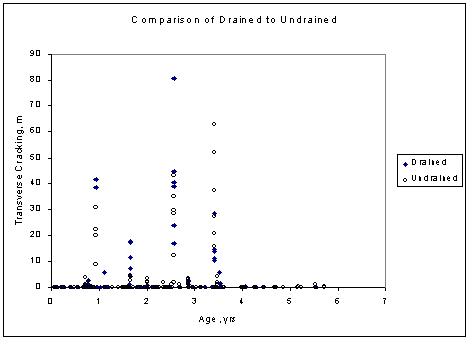
Figure 19. Total length of transverse cracks measured over time comparing test sections with
and without permeable base layers for all SPS-1 projects combined.
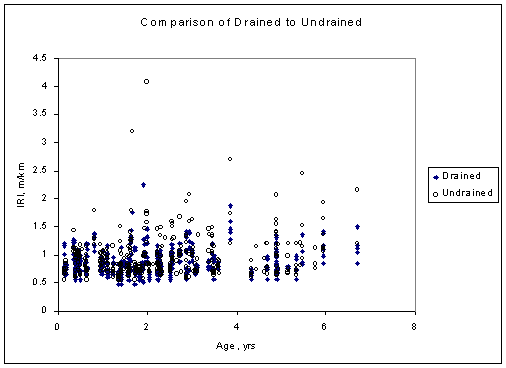
Figure 20. IRI values measured over time comparing test sections with and without permeable
base layers for all SPS-1 projects combined.
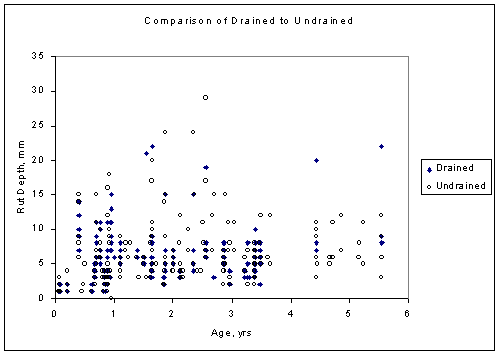
Figure 21. Rut depths measured over time comparing test
sections with
and without permeable base layers for all SPS-1 projects combined.
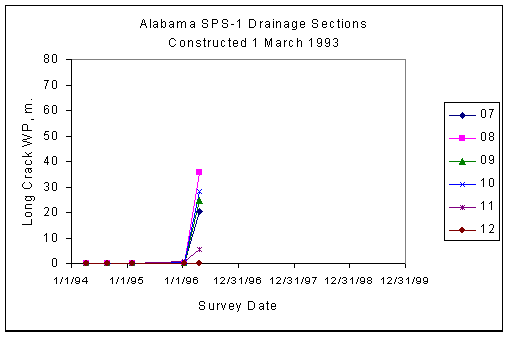
Figure 22. Longitudinal cracking in the wheel paths measured on different dates
for the core test sections of the Alabama project.
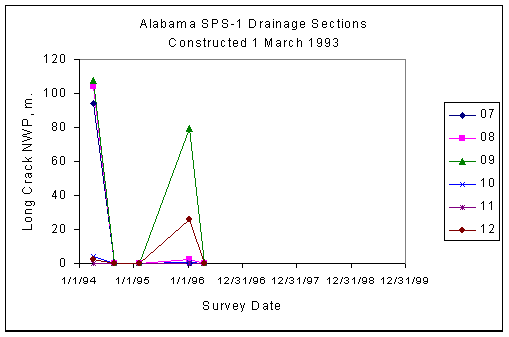
Figure 23. Longitudinal cracking outside the wheel paths measured on different dates
for the core test sections of the Alabama project.
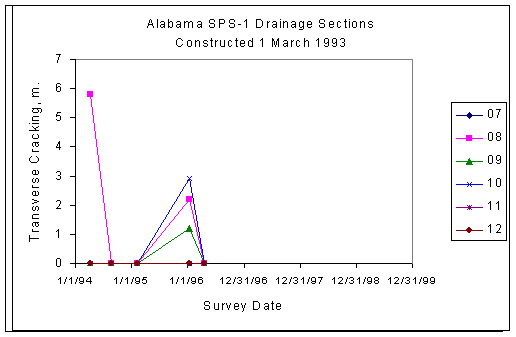
Figure 24. Transverse cracking measured on different dates for the
core test sections of the Alabama project.
Table 20. Percentage of the SPS-1 core test sections with distress magnitudes
exceeding the value noted.
Performance Indicator |
Distress Magnitude Minimal Value |
Core Test Sections Exceeding Minimal Value |
|
|---|---|---|---|
Percentage of Sections |
No. of Sections |
||
Rut Depth |
> 7 mm |
18.1 |
39 |
IRI |
> 1.4 m/km |
5.6 |
12 |
Fatigue Cracking |
> 25 m2 |
6.0 |
13 |
Transverse Cracking |
> 9 m |
5.6 |
12 |
Fatigue cracking has occurred on some of the test sections of the older projects. Table 21 shows the average amount of fatigue cracking observed at each project and the age of that project. Figure 25 shows the average area of fatigue cracking at a project compared to the age of that project and the total number of test sections with fatigue cracking. As shown in table 21 and figure 25, the number of sections with fatigue cracking is consistently less for the younger projects, while the average fatigue cracking for a project appears to be less age dependent. This observation suggests a substantial difference in the fatigue resistance of the flexible pavements and HMA mixtures between the projects. This trend may change as more data become available with time.
Table 21. Summary of the average area of fatigue cracking observed at each project.
Project |
Age, Years |
Core Test Sections with Fatigue Cracking, No. |
Area of Fatigue Cracking, m2 |
Initial IRI |
||
Average |
Standard Deviation |
Age, Yrs. |
IRI, m/km |
|||
|---|---|---|---|---|---|---|
Iowa |
7.0 |
10 |
2.0 |
3.78 |
2.3 |
0.970 |
Alabama |
6.4 |
6 |
15.1 |
31.2 |
2.9 |
0.686 |
Arizona |
6.0 |
7 |
4.0 |
7 |
0.5 |
0.778 |
Kansas |
5.8 |
8 |
44.8 |
51.5 |
0.6 |
0.811 |
Arkansas |
5.7 |
5 |
4.8 |
10.6 |
3.6 |
0.808 |
Ohio |
4.6 |
0 |
0.0 |
0.0 |
2.0 |
1.490 |
Nebraska |
4.1 |
1 |
1.2 |
4.2 |
0.3 |
1.140 |
Nevada |
4.0 |
5 |
5.1 |
13.1 |
1.7 |
0.713 |
Michigan |
4.0 |
0 |
0.0 |
0.0 |
1.4 |
0.783 |
Virginia |
3.7 |
1 |
11.5 |
39.9 |
1.1 |
1.002 |
Florida |
3.7 |
0 |
0.0 |
0.0 |
1.2 |
0.754 |
New Mexico |
3.7 |
0 |
0.0 |
0.0 |
1.4 |
0.623 |
Delaware |
3.2 |
1 |
15.3 |
52.8 |
0.6 |
|
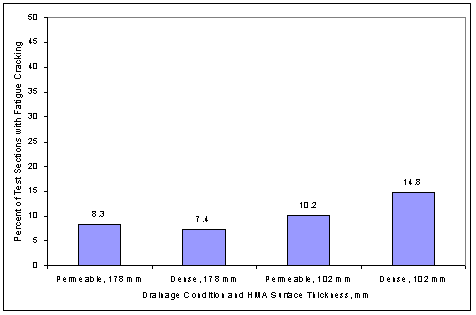
Figure 25. Graphical illustration of the average amount
of fatigue cracking observed on each of
the projects, as of
January 2000.
The Kansas test sections consistently have the greatest area of fatigue cracking, but are not from the oldest project. In fact, all eight of the test sections that have cracked show over 25 m2 of fatigue cracking. The Kansas SPS-1 project had a wet subbase that was difficult to compact (refer to table 19). In all probability, the wet subbase and low densities are the reasons for this large amount of fatigue cracking. These data will still be invaluable for comparative studies and for calibrating mechanistic prediction models once the materials test results become available.
All except two of the Iowa test sections have fatigue cracking, but the areas measured within each test section are small—the average fatigue cracking is 2.0 m2. Conversely, a large area of fatigue cracking has been recorded on one test section of the Delaware and Virginia projects. The reason for this large area of fatigue cracking in one test section when the other 11 have none is unknown, and both of these test sections are considered anomalies relative to each project.
Transverse cracking has occurred on all except one of the Iowa test sections. The length of the transverse cracks measured along the test sections that have cracked exceed 9 m. The only other projects exhibiting some transverse cracking are the Kansas and Arkansas projects. However, the total length of transverse cracking at these two sites is less than 9 m for all except one of the Kansas test sections. This transverse cracking is probably more related to the HMA mixture characteristics or properties than to any of the key experimental factors, including the climate.
The Arkansas, Iowa, and Kansas sites are the oldest projects in a freezing climate. The age of the Iowa project is 7 years, the Kansas project is 5.8 years, and the Arkansas project is 5.7 years. Thus, age also may be an important factor. In fact, mechanistic-based models consider the binder and mixture properties, climate, and age to be the most important factors in the occurrence of transverse cracking.
The Iowa, Kansas, and Nebraska projects have the most test sections with IRI values
greater than 1.4 m/km. These are the same projects that have extensive transverse and fatigue cracking. The occurrence of transverse and fatigue
cracking are probably causing the increased roughness (increased IRI values) at these sites. The authors have found from previous studies that the IRI is related to the standard deviation of the
rut depth, transverse cracking, fatigue cracking, and other distresses.(2613) Thus,
there are interactions between the performance measures, which will need to be considered in future studies using data from this experiment.
Rut depths exceeding 7 mm have been measured along 10 of the 18 SPS-1 projects—Alabama, Arizona, Iowa, Kansas, Michigan, Nebraska, Nevada, Virginia, Ohio, and Texas. These projects are located in very different climates. However, rut depths in only one of the test sections in the Michigan, Nevada, and Virginia projects exceeds 7 mm; the rut depths in the other 11 test sections within these 3 projects are less than 7 mm. Thus, those projects with the greatest rut depths have been in-place longer, with the exception of the Texas project (refer to table 21 for the age of the projects). The Texas project is located along a rural highway and has less traffic than any of the other 18 SPS-1 projects with only 10,000 ESALs per year (refer to table 8). In all probability, the rut depths measured along the Texas project are more related to the HMA mixture characteristics than to any key factor included in the experiment.
An analysis of variance (ANOVA) was completed for each of the four major distress types to determine if the main factors of the experiment had a significant effect on those distresses from these early observations. The major factors included in the ANOVA are listed below.
Results from this one-way ANOVA are summarized in table 22 and indicate that subgrade soil, drainage condition, type of base material, and HMA thickness have a significant effect on all distresses with the exception of rut depth. Although there are possible interactions between these factors, the one-way ANOVA demonstrates that the key factors of the SPS-1 experiment design are having an effect on the early performance observations.
Table 22. Summary of p-values from a one-way ANOVA to
determine the effect of
experimental
factors on selected performance indicators.
| Experimental Factor |
Performance Indicator/Surface Distress |
|||
|---|---|---|---|---|
| Rut Depths |
IRI |
Fatigue Cracking |
Transverse Cracking |
|
| Subgrade Soil Type |
0.132 |
<0.0001 |
0.034 |
0.006 |
| Base Type |
<0.0001 |
<0.0001 |
0.092 |
0.604 |
| Drainage Condition |
0.897 |
0.003 |
0.246 |
0.465 |
| Nominal Base Thickness |
0.254 |
0.003 |
0.898 |
0.589 |
| Nominal HMA Thickness |
0.556 |
<0.0001 |
0.013 |
0.815 |
| Age of Project |
<0.0001 |
0.001 |
<0.0001 |
0.068 |
The following summarizes the effect of the key factors of the experiment on the individual distresses. A description of the effects and possible reasons for those effects are discussed in the next section of this chapter.
The remaining sections of this chapter discuss the effect of each key factor of the experiment in relation to the magnitude and relative occurrence of observed distresses. Tables 23 through 26 summarize the differences in the average performance measures between the key factors of the experiment.
HMA pavements built over fine-grained subgrade soils exhibit higher IRI values than those pavements built over coarse-grained soils (table 23). More importantly, a much greater percentage of the HMA core test sections built over fine-grained soils in a freeze climate have exceeded 1.2 m/km (see figure 26). This observation is consistent with previous findings from evaluating the General Pavement Studies (GPS) test sections.(14)
The Iowa, Kansas, and Nebraska projects consistently have higher IRI values. The initial IRI values were reviewed to determine if these projects had higher IRI values immediately after construction. The initial IRI values and the age of the project when those values were measured are summarized in table 21. As shown, these projects did not exhibit the higher values after construction. As stated in chapter 4 and listed in table 21, the first longitudinal profiles were measured over 1 year after construction on 50 percent of the SPS-1 projects. Chapter 3 explained some of the reasons why data were not measured sooner following construction.
Table 23. Average performance differences of the test sections between the different
soil types included in the SPS-1 experiment.
| Distress or Performance Indicator | Soil Type | ||
|---|---|---|---|
| Fine-grained | Coarse-grained | ||
Rut Depth |
Mean, mm |
6 |
6 |
Std. Deviation, mm |
4 |
4 |
|
COV, %* |
74 |
71 |
|
| IRI | Mean, m/km |
1.03 |
0.78 |
Std. Deviation, m/km |
0.364 |
0.137 |
|
COV, % |
35 |
18 |
|
| Fatigue Cracking | Mean, m2 |
1.5 |
3.5 |
Std. Deviation, m2 |
11.8 |
16.7 |
|
COV, % |
802 |
481 |
|
| Transverse Cracking | Mean, m |
2.1 |
0.3 |
Std. Deviation, m |
8.7 |
1.8 |
|
COV, % |
410 |
547 |
|
Table 24. Average performance differences of the test sections between the different types
of base layers included in the SPS-1 experiment.
| Distress or Performance Indicator | Base Type | ||
|---|---|---|---|
| ATB | Unbound Aggregate | ||
Rut Depth |
Mean, mm |
4 |
7 |
Std. Deviation, mm |
3 |
5 |
|
COV, %* |
77 |
71 |
|
IRI |
Mean, m/km |
0.89 |
1.014 |
Std. Deviation, m/km |
0.280 |
0.433 |
|
COV, % |
31 |
43 |
|
Fatigue Cracking |
Mean, m2 |
1.6 |
6.2 |
Std. Deviation, m2 |
10.1 |
23.7 |
|
COV, % |
637 |
380 |
|
Transverse Cracking |
Mean, m |
1.5 |
0.9 |
Std. Deviation, m |
7.3 |
5.7 |
|
COV, % |
474 |
638 |
|
Table 25. Average performance differences of the test
sections between the different drainage
conditions included in
the SPS-1 experiment.
| Distress or Performance Indicator | Drainage Condition | ||
|---|---|---|---|
| Permeable Base | Dense Base | ||
Rut Depth |
Mean, mm |
6 | 6 |
Std. Deviation, mm |
4 | 4 | |
COV, %* |
70 | 75 | |
IRI |
Mean, m/km |
0.884 | 0.965 |
Std. Deviation, m/km |
0.243 | 0.367 | |
COV, % |
28 | 38 | |
Fatigue Cracking |
Mean, m2 |
1.8 | 3.5 |
Std. Deviation, m2 |
10.3 | 18.1 | |
COV, % |
584 | 518 | |
Transverse Cracking |
Mean, m |
1.5 | 1.3 |
Std. Deviation, m |
7.4 | 6.5 | |
COV, % |
482 | 490 | |
Table 26. Average performance differences of the test
sections between the different
HMA layer thickness included in the SPS-1 experiment.
| Distress or Performance Indicator | HMA Surface Thickness | ||
|---|---|---|---|
| Thin | Thick | ||
Rut Depth |
Mean, mm |
6 | 6 |
Std. Deviation, mm |
4 | 4 | |
COV, %* |
74 | 72 | |
IRI |
Mean, m/km |
0.970 | 0.884 |
Std. Deviation, m/km |
0.345 | 0.281 | |
COV, % |
36 | 32 | |
Fatigue Cracking |
Mean, m2 |
4.0 | 1.4 |
Std. Deviation, m2 |
20.0 | 7.5 | |
COV, % |
494 | 535 | |
Transverse Cracking |
Mean, m |
1.5 | 1.4 |
Std. Deviation, m |
7.3 | 6.5 | |
COV, % |
499 | 474 | |
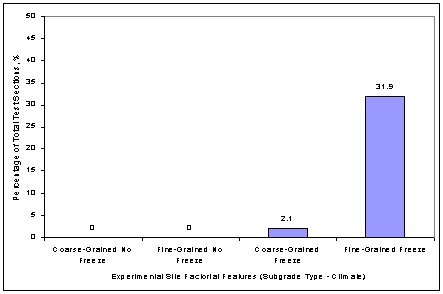
Figure 26. Percentage of the core test sections that exceed an IRI value of 1.2 m/km.
More transverse cracking has occurred on HMA pavements supported by fine-grained soils than on those supported by coarse-grained soils. This observation is consistent with some of the previous empirical models that have been developed for transverse cracking. However, the average lengths of transverse cracking could be biased toward the fine-grained soils because most of the greatest lengths of transverse cracking were observed on test sections from the Iowa project.
Greater rut depths have been measured on HMA pavements with unbound aggregate base layers than on those with ATB layers (table 24). Figure 27 shows the percentage of core test sections with rut depths exceeding 8 mm. As shown in figure 27, rutting in 33 percent of the core test sections with unbound aggregate base layers has exceeded 8 mm while rutting in only 18 percent of those test sections with dense-graded ATB layers has exceeded 8 mm. This observation suggests that a portion of the rutting measured at the surface is a result of permanent deformations in the unbound aggregate base layer. This observation is consistent with a finding made by the authors from studying the GPS test sections.(15)
The IRI computed from the longitudinal profiles is greater for those HMA pavements with unbound aggregate base layer than for those with ATB layers. Figure 28 shows the percentage of core test sections exceeding an IRI value of 1.2 m/km for the two different base types. The HMA pavements with a thick base layer are smoother than those with a thin base layer.
The HMA pavements with unbound aggregate layers have slightly more fatigue cracking than those with ATB layers. Figure 28 shows a comparison of the percentage of the core test sections with an IRI value greater than 1.2 m/km. As shown, the pavements with unbound aggregate base layers have a much higher percentage of fatigue cracking exceeding 1.2 m/km. This observation is consistent with the authors’ previous experience.(16)
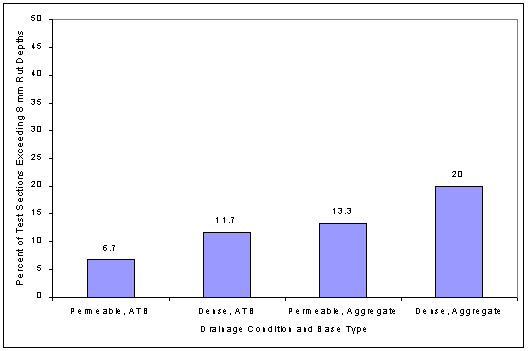
The HMA pavements with the permeable asphalt drainage layers are slightly smoother than those built without any drainage layer. However, the percentages of the core test sections with IRI values exceeding 1.2 m/km are about the same (refer to figure 28). In addition, a lower percentage of test sections with permeable asphalt drainage layers have rut depths exceeding 8 mm (refer to figure 27).
In general, the percentage of core test sections with fatigue cracking is slightly less for those test sections with permeable asphalt layers than for those without permeable base layers (refer to figure 29). However, the test sections with the thick HMA surface layer exhibited a greater average area of fatigue cracking than did the companion sections with the thin HMA surface layer. The Kansas project further confounds these results. As mentioned earlier, construction difficulties occurred on this project as a result of wet weather and difficulties in compacting the highly variable subbase (refer to table 19). The difficulty in compacting the subbase layer and the variable densities may have caused a weakness in all of those test sections.
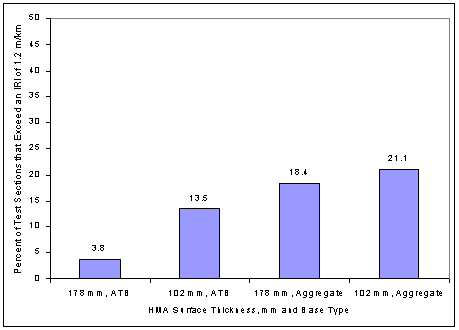
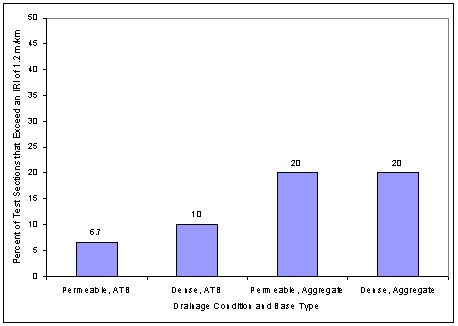
Figure 29. Percentage of core test sections that have fatigue cracking.
As expected, the pavements with thick HMA surface layers have much less fatigue cracking, as shown in figure 29 and tabulated in table 26. Fewer core test sections with thick HMA layers exceed an IRI value of 1.2 m/km (refer to figure 28) than those with thinner HMA. Figure 28 graphically shows that 22 percent of the test sections with thick HMA layer have exceeded an IRI value of 1.2 m/km, while almost 34 percent of the test sections with thin HMA surface layers have exceeded that value.
Some of these differences in performance may not be statistically significant at this time (for example, more fatigue cracking on thin HMA layers), but they demonstrate that the early observations from the SPS-1 experiment are consistent with previous experience. In other words, these early observations show the potential value of the SPS-1 experiment and that the experimental objectives and expectations can be met in the future with accumulated traffic loadings and increased age.
The construction and deviation reports also were found to be extremely valuable in explaining possible anomalies in the experiment and performance differences from the other projects and test sections. Use of these reports should reduce the possibility of biased conclusions. However, in order to extract the full benefit of this experiment, the planned materials testing program must be completed and the truck traffic data must be collected on those projects that have no data at this time.
The above findings are considered the most important relative to the overall success of the SPS-1 experiment. However, following are other findings that also confirm the reasonableness of the SPS-1 experimental data:

