U.S. Department of Transportation
Federal Highway Administration
1200 New Jersey Avenue, SE
Washington, DC 20590
202-366-4000
Federal Highway Administration Research and Technology
Coordinating, Developing, and Delivering Highway Transportation Innovations
 |
| This report is an archived publication and may contain dated technical, contact, and link information |
|
Publication Number: FHWA-RD-01-168 Date: July 2006 |
This chapter presents a summary of the SPS-5 experimental data in the IMS based on the LTPP data-collection guidelines at the time of the data extraction–January 2000. Appendix A provides a brief discussion and summary of each SPS-5 project, including a review of construction difficulties and deviations from the experimental plan. The construction and deviation reports provide detailed information about the location and construction of each project. These reports were prepared by the RCOs upon completion of the project.
The IMS is a very dynamic database that is continually updated and revised as new data are entered and checked for anomalies. Figure 2 is a generalized flowchart showing the movement of data and the data quality checks through LTPP. This flowchart is useful for understanding why some key data collected for a specific test section do not appear as Level E data in the LTPP database.
The quality of the data is the most important factor in any analysis. From the outset of the LTPP program, data quality has been considered of paramount concern. Procedures for collecting and processing data were defined and modified as necessary to ensure consistency across various reporting contractors, laboratories, equipment operators, or others. Although these procedures formed the foundation of quality control/quality assurance (QC/QA) and data integrity, many more components of a QC/QA plan were necessary to ensure that the data sent to researchers were as error free as practical.
LTPP has developed and implemented an extensive quality control (QC) program that classifies each data element into categories depending upon the location of the data in this QC process. Several activities comprise the overall QC/QA plan used on the LTPP data.
Figure 2. Chart. LTPP data collection and data movement flowchart.
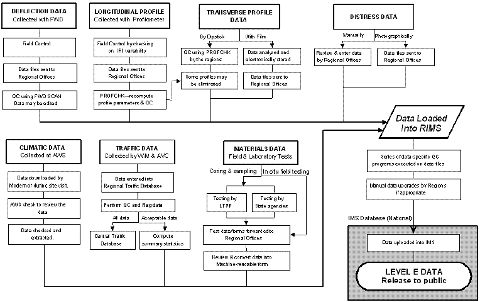
When the QC/QA programs are completed, the RCOs review the output and resolve any data errors. Often, the data entered are legitimate and accurate, but do not pass a QC/QA check. If this occurs, the RCO can document that the data have been confirmed using a comments table in the IMS and can manually upgrade the record to Level E.
Figure 2 shows the movement of data elements and quality checks completed on the data before it is released to the public. Only a fraction of the data fields are checked. A value of A is assigned automatically to a record on entry in the database. A value of B indicates the QC process was executed but a Level C check failed. Any record for which correct section information is stored in the database is available after the QC is completed. A record of the QC processing is included with the record. Because the checks are run in sequence A-E, the last successful check is identified on the record as the record status variable. A value of B or C indicates that a necessary data element was not available when the QC was processed and does not necessarily imply that the higher level QC was unsuccessful.
There are several reasons that some data may be unavailable from the publicly released IMS database; for example:
Therefore, the missing data identified in this report do not necessarily mean that the data were not collected or submitted by the owner agencies. There are several places where data may be delayed and not reach Level E. The results in this report are based only upon Level E because it was impossible to know the specific reasons the data did not pass all of the QC checks. Many reasons that prevent data from reaching Level E status are not the result of poor quality or unreliable data. The LTPP program is embarking on a system-wide effort to resolve all unavailable data so that future researchers can access them.
All data elements included in the SPS-5 experiment were reviewed for their availability and completeness in the LTPP database (see table 6). Although each element is important for different reasons, the data were subdivided into three categories for the review process: essential, explanatory, and informational.
Although the review of the SPS-5 experiment included all data elements, the detailed review concentrated on the elements identified as essential and explanatory because they are considered necessary to achieve the overall objectives of the experiment. Table 6 notes those data elements within each of the three different categories.
The key data elements that were evaluated and assessed for determining the quality level and completeness for each project were subdivided into the following types of data, which are discussed in this chapter:
| Module ID | Data Element | *Data Avail., % | Data Importance | ||
|---|---|---|---|---|---|
| Essential | Explanatory | Informational | |||
| Climatic (CLM) | Maximum avg annual humidity | 44.4 | X | X | |
| Minimum avg annual humidity | 44.4 | X | |||
| Annual Precipitation | 94.4 | X | |||
| Number of days with Intense Precipitation | 94.4 | X | |||
| Number of days with Precipitation | 94.4 | X | |||
| Annual Snowfall | 94.4 | X | |||
| Number of days with Snowfall | 94.4 | X | |||
| Mean Annual Temp | 94.4 | X | |||
| Avg Max Annual Temp | 94.4 | X | |||
| Avg Min Annual Temp | 94.4 | X | |||
| Max Annual Temp | 94.4 | X | |||
| Min Annual Temp | 94.4 | X | |||
| Days > 32C | 94.4 | X | |||
| Days < 0C | 94.4 | X | |||
| Freeze Index | 94.4 | X | |||
| Annual No of Freeze Thaw Cycles | 94.4 | X | |||
| Mean wind speed | 27.8 | X | |||
| Inventory (INV) - Original Pavement | Construction Date | 94.4 | |||
| Date Open to Traffic | 94.4 | X | |||
| Type of Aggregate Used in AC | 61.1 | X | |||
| Aggregate Durability | 16.7 | X | |||
| Pavement Type | 94.4 | X | |||
| Lane Width | 94.4 | X | |||
| Subdrainage type | 94.4 | X | |||
| Gradation of AC | 50.0 | X | |||
| Gradation of Unbound Base | 61.1 | X | |||
| Gradation of Subgrade | 44.4 | X | |||
| Functional Class | 94.4 | X | |||
| Location | 83.3 | X | |||
| Elevation | 94.4 | X | |||
| Layer Thickness | 94.4 | X | |||
| Asphalt Modifier | 0.0 | X | |||
| Aggregate in AC Specific Gravity | 16.7 | X | |||
| Asphalt Viscosity | 38.9 | X | |||
| Compaction Type | 11.1 | X | |||
| Laydown Temp | 38.9 | X | |||
| AC Bulk Specific Gravity | 33.3 | X | |||
| AC Max Specific Gravity | 38.9 | X | |||
| Asphalt Content | 72.2 | X | |||
| Air Voids | 61.1 | X | |||
| VMA | 27.8 | X | |||
| Marshall Stability | 27.8 | X | |||
| Marshall Flow | 22.2 | X | |||
| Hveem Stability | 22.2 | X | |||
| Hveem Cohesiometer | 5.6 | X | |||
| Asphalt Plant Type | 50.0 | X | |||
| Antistrip Agent | 27.8 | X | |||
| Moisture Susceptibility | 5.6 | X | |||
| Inventory (INV) - Original Pavement | Shoulder Type | 94.4 | X | ||
| Stabilizing Agent for Base | 33.3 | X | |||
| Stabilizing Agent for Subgrade | 0.0 | X | |||
| Subgrade CBR | 16.7 | X | |||
| Subgrade AASHTO Soil Class | 55.6 | X | |||
| Subgrade Resistance | 0.0 | X | |||
| Subgrade Reaction Modulus | 0.0 | X | |||
| Subgrade Atterberg Limits | 33.3 | X | |||
| Subgrade Optimum Moisture | 27.8 | X | |||
| Subgrade Max Density | 22.2 | X | |||
| Subgrade In Situ Density | 27.8 | X | |||
| Subgrade In Situ Moisture | 33.3 | X | |||
| Soil Suction | 0.0 | X | |||
| Expansion Index | 0.0 | X | |||
| Swell Pressure | 0.0 | X | |||
| Average Rate of Heave | 0.0 | X | |||
| Frost Susceptibility | 11.1 | X | |||
| Unbound Base AASHTO Soil Class | 66.7 | X | |||
| Unbound Base Atterberg Limits | 27.8 | X | |||
| Unbound Base Optimum Moisture | 44.4 | X | |||
| Unbound Base Max Density | 55.6 | X | |||
| Unbound Base In Situ Density | 38.9 | X | |||
| Unbound Base In Situ Moisture | 44.4 | X | |||
| Compressive Strength | 0.0 | X | |||
| Unbound Base CBR | 0.0 | X | |||
| Unbound Base Resistance | 5.6 | X | |||
| Unbound Base Reaction Modulus | 0.0 | X | |||
| Maintenance (MNT) | Cracking sealing | 16.7 | X | ||
| Patching | 5.6 | X | |||
| Asphalt Seal | 0.0 | X | |||
| Monitoring (MON) | Deflections | 94.4 | X | ||
| Temperature at Testing | 100.0 | X | |||
| Backcalculated Modulus | -- | X | |||
| Manual Distress | 100.0 | X | |||
| Photographic Distress | 83.3 | X | |||
| Friction | 77.8 | X | |||
| Longitudinal Profile | 94.4 | X | |||
| Transverse Profile | 94.4 | X | |||
| Construction | Primary Distress | 16.7 | X | ||
| Secondary Distress | 5.6 | X | |||
| No of Patches | 16.7 | X | |||
| Area of Patches | 16.7 | X | |||
| Type of Patching | 16.7 | X | |||
| Air Temp | 11.1 | X | |||
| Road Moisture | 11.1 | X | |||
| Layer Thickness | 94.4 | X | |||
| Thickness from Rod & Level | 61.1 | X | |||
| Type of Milling Maching | 83.3 | X | |||
| Cutting Head Width | 83.3 | X | |||
| Depth of Milling | 88.9 | X | |||
| Overlay Surface Preparation | 88.9 | X | |||
| Type of Tack Coat | 88.9 | X | |||
| Application Rate of Tack Coat | 77.8 | X | |||
| Mix Plant Type | 88.9 | X | |||
| Haul Distance | 8.9 | X | |||
| Type of Paver | 88.9 | X | |||
| Laydown Width | 88.9 | X | |||
| Lift Thickness | 83.3 | X | |||
| Compaction Type | 83.3 | X | |||
| Laydown Temp | 72.2 | X | |||
| Profile Index | 16.7 | X | |||
| Rut Width prior to Level Up | 5.6 | X | |||
| Rut Depth prior to Level Up | 5.6 | X | |||
| Rehabilitation (Overlay Data) | Type of Aggregate in AC | 66.7 | X | ||
| Aggregate Durability | 16.7 | X | |||
| Aggregate Gradation | 77.8 | X | |||
| Lab Aged Cement Viscosity | 22.2 | X | |||
| Design Air Voids | 66.7 | X | |||
| Design Asphalt Content | 72.2 | X | |||
| Design Marshall Stability | 38.9 | X | |||
| Design Marshall Flow | 27.8 | X | |||
| Design Hveem Stability | 27.8 | X | |||
| Design Hveem Cohesiometer | 5.0 | X | |||
| Asphalt Grade | 77.8 | X | |||
| Asphalt Viscosity | 38.9 | X | |||
| Asphalt Modifier | 11.1 | X | |||
| Gradation of Combined Aggregate (RAP & new) | 77.6 | X | |||
| Recycling Agent | 5.6 | X | |||
| Amount of New AC | 66.7 | X | |||
| Combined Specific Gravity | 38.9 | X | |||
| Combined Viscosity | 16.7 | X | |||
| Processing of Old Pavement | 55.6 | X | |||
| Gradation of Reclaimed Aggregate | 55.6 | X | |||
| Specific Gravity of Reclaimed Aggregate | 16.7 | X | |||
| Combined Lab Aged Cement Viscosity | 0.0 | X | |||
| Grade of New Asphalt | 77.8 | X | |||
| Viscosity of New Asphalt | 16.7 | X | |||
| Viscosity of Reclaimed Asphalt | 5.6 | X | |||
| Gradation of New Aggregate | 61.1 | X | |||
| Specific Gravity of New Aggregate | 33.3 | X | |||
| Durability of New Aggregate | 11.1 | X | |||
| Traffic (TRF) | Estimated ESALs | 5.6 | X | ||
| Estimated AADT | 44.4 | X | |||
| W4 Tables | 50.0 | X | |||
| Monitored AVC | 50.0 | X | |||
| Monitored AADT | 33.3 | X | |||
| Monitored ESALs | 0.0 | X | |||
| Materials Testing (TST) | Core examination | 83.3 | X | ||
| Bulk Specific Gravity | 66.7 | X | |||
| Max Specific Gravity | 66.7 | X | |||
| Asphalt Content | 61.1 | X | |||
| Moisture Susceptibility | 11.1 | X | |||
| Asphalt Resilient Modulus | 0.0 | X | |||
| Ash Content of AC | 55.6 | X | |||
| Penetration | 66.7 | X | |||
| Asphalt Specific Gravity | 66.7 | X | |||
| Viscosity | 66.7 | X | |||
| Aggregate Specific Gravity | 44.4 | X | |||
| Aggregate Gradation | 66.7 | X | |||
| Fine Aggregate Particle Shape | 27.8 | X | |||
| In Situ Density | 88.9 | X | |||
| Layer Thickness | 77.8 | X | |||
| Treated Base Type | 22.2 | X | |||
| Treated Base Compressive Strength | 5.6 | X | |||
| Unbound Base Gradation | 44.4 | X | |||
| Unbound Base Classification | 38.9 | X | |||
| Unbound Compressive Strength of the Subgrade | 0.0 | X | |||
| Unbound Base Permeability | 11.1 | X | |||
| Unbound Base Optimum Moisture | 33.3 | X | |||
| Unbound Base Max Density | 33.3 | X | |||
| Unbound Base Modulus | 5.6 | X | |||
| Unbound Base Moisture Content | 33.3 | X | |||
| Subgrade Gradation | 72.2 | X | |||
| Subgrade Hydrometer Analysis | 66.7 | X | X | ||
| Subgrade Classification | 77.8 | X | |||
| Subgrade Permeability | 0.0 | ||||
| Atterberg Limits | 66.7 | X | X | ||
| Subgrade Optimum Moisture | 72.2 | X | X | ||
| Subgrade Max Density | 72.2 | X | |||
| Subgrade Modulus | 72.2 | X | |||
| Subgrade Moisture Content | 72.2 | X | X | ||
* Data Availability–percentage of SPS-5 required tests for which data generally are available in the database.
This assessment includes the site identification and location, key equipment installed at the site, availability of the construction report, and important dates associated with each of the SPS-5 projects. The information for this review was obtained from the site construction report, deviation report, or the LTPP IMS tables entitled EXPERIMENT_SECTION and INV_AGE. All site-level records for the 18 SPS-5 projects are at level E, except for one. The Missouri project had very limited data in the database because at the time of this report it had only recently been constructed. Table 7 includes a summary of the site information and report availability for each project.
| Project | Region | Age, Years | Pavement Condition Before Overlay | AVC Equipment Installed | Report Availability | |
|---|---|---|---|---|---|---|
| Construction | Deviation | |||||
| Maine | North Atlantic | 4.1 | √ | – | √ | √ |
| Maryland | 7.2 | √ | √(1) | √ | √ | |
| New Jersey | 7.0 | √ | √(1) | √ | √ | |
| Minnesota | North Central | 8.9 | √ | √(1) | √ | √ |
| Missouri | 0.0 | √ | – | √(2) | – | |
| Manitoba | 10.0 | √ | √ | √ | √ | |
| Alabama | South | 7.7 | √ | – | √ | √ |
| Florida | 4.3 | √ | – | √ | √ | |
| Georgia | 6.2 | √ | – | √ | √ | |
| Mississippi | 8.9 | √ | √(1) | √ | √ | |
| New Mexico | 2.9 | √ | – | √ | √ | |
| Oklahoma | 2.1 | √ | – | √ | √ | |
| Texas | 7.8 | √ | √(1) | √ | √ | |
| Arizona | West | 9.2 | √ | √(1) | √ | √ |
| California | 7.3 | √ | √(1) | √ | √ | |
| Colorado | 7.9 | √ | √(1) | √ | √ | |
| Montana | 8.0 | √ | √ | √ | √ | |
| Alberta | 8.9 | √ | √(1) | √ | √ | |
Notes:
At the time of the preparation of this report, traffic monitoring equipment had been installed at 11 of the 18 SPS-5 sites, as shown in table 7. All 11 sites were 7 or more years old, while the 7 sites that did not have the equipment were less than 7 years old, except for the Alabama project. The seven sites without traffic monitoring equipment were considered significant to the experiment, especially when trying to validate the more sophisticated mechanistic-empirical design procedures. Specifically, reliable and site-specific traffic data were considered vital to NCHRP Project 1-37A, "Development of the 2002 Guide for the Design of New and Rehabilitated Pavement Structures."
The installation of automated weather station (AWS) equipment was not a requirement for the SPS-5 experiment.
All SPS-5 project sites were to have a fine-grained subgrade soil. However, both fine-grained and coarse-grained soils were included in the experiment. The effect of soil type has been included in the experiment by identifying the projects as "A" and "B" in the revised factorial shown in table 8. Four projects have both types of soils under specific test sections–California, Colorado, Georgia, and Manitoba, and are located in table 8 based on the predominant soil type at the site. Any data unavailable in the IMS will be presented in terms of this revised site factorial.
| Pavement Climate, Moisture–Temperature Surface Condition | Subgrade Soil Type | Climate, Moisture–Temperature | |||
|---|---|---|---|---|---|
| Wet-Freeze | Wet-No-Freeze | Dry-Freeze | Dry-No-Freeze | ||
| Fair | Fine grained | Site Cell 1.A: GA (8) 6.2 | Site Cell 2.A: | Site Cell 3.A: CO (2) 7.9 MN (3) 8.9 | Site Cell 4.A: OK (1) 2.1 TX (0) 7.8 |
| Coarse grained | Site Cell 1.B: | Site Cell 2.B: | Site Cell 3.B: AB (0) 8.9 MT (2) 8.0 | Site Cell 4.B: NM (0) 2.9 | |
| Poor | Fine grained | Site Cell 5.A: MD (5) 7.2 MO* (0) 0.0 | Site Cell 6.A: MS (1) 8.9 | Site Cell 7.A: MB (0) 10.0 | Site Cell 8.A: |
| Coarse grained | Site Cell 5.B: ME (1) 4.1 | Site Cell 6.B: FL (6) 4.3 AL (2) 7.7: | Site Cell 7.B: | Site Cell 8.B: CA (13) 7.3 AZ (2) 9.2 | |
Note: The values in parentheses are the number of supplemental sections for each project. The other value provided for each project is the age of that project in years, as of January 2000.
* The Missouri project is located in the cell for which it was nominated because the data for determining the correct cell assignment are unavailable at the time of data extraction.
As shown in table 8, no projects are located in site cell 2 (fair surface condition in a wet-nofreeze climate) and a replicate project is unavailable for site cell 7 (poor surface condition in a dry-freeze climate). Data for empty cells are not believed to be critical to the overall success of the SPS-5 experiment.
Chapter 3 presented a summary of the construction and specification requirements for each SPS-5 project. The Guidelines for Nomination and Evaluation of Candidate Projects(8) and Construction Guidelines(9) also established specific site-selection criteria and key variable construction guidelines, which were developed to control the quality and integrity of the experimental data from the SPS-5 experiment and should be considered in the construction adequacy evaluation and assessment.
One main objective of this study was to identify any confounding factors introduced into the SPS-5 experiment regarding construction deviations and/or other factors not accounted for in the original experiment design. It is extremely important to evaluate the types of variables that are considered key design factors in the SPS-5 experiment and to determine whether any deviation of the design parameters established for the design factorial would adversely affect the experiment expectations.
This part of chapter 4 evaluates the design versus actual construction of key variables identified in the experimental factorial and guidelines.
The SPS-5 experimental design called for each project to be located in one of four climatic zones: wet-freeze, wet-no-freeze, dry-freeze, and dry-no-freeze. The sites nominated in each zone were shown in table 1. The main purpose of this factor was to obtain SPS-5 projects in different climates, as well as a geographical distribution across the United States and Canada. Table 9 tabulates the average annual rainfall, mean annual air temperatures, and freeze index measured at each site.
The general climatic data include a site-specific statistical estimate, based on as many as five nearby weather stations, for each project. These estimates are called virtual weather stations. The IMS contains monthly and average annual summary statistics. Daily data for both the virtual and actual weather stations are stored offline. General environmental data available in the IMS are derived from weather data originally collected from the National Climatic Data Center (NCDC).
The SPS-5 project sites include a wide range of freeze index, temperature, and annual rainfall, as originally planned. The freeze index and average rainfall determine the climatic designation for each site. Those sites with an average annual rainfall greater than 1,000 mm are classified as wet and those with less than 1,000 mm as dry. Similarly, the sites with a freeze index greater than 60° C-days are classified as a freezing climate and those with less than 60° C-days are designated as a no-freeze climate.
The values used to determine the specific climatic cell assignment are arbitrary and are only used to ensure that the projects cover a diverse range of climates. An annual rainfall of 1,000 mm was used in some of the earlier LTPP studies for assigning a wet or dry climate to the site, while an annual rainfall of 508 mm is used in the latest version of DataPave®. A freezing index value of 60° C-days was used to determine whether the site falls into a no-freeze or freeze cell, while a different value is used in DataPave.
Some did not meet the above definitions based on the climatic data that had been collected as of the time of this report. For example, Minnesota and Texas both have annual rainfalls less than 1,000 mm, but are in experimental cells designated as wet. Similarly, Georgia has a freeze index of 66° C-days, but is in an experimental cell designated as no-freeze. These differences are not considered detrimental to the experimental plan because the SPS-5 sites have a diverse range of climatic conditions.
| Climate | Project ID | Predominant Type of Subgrade Soil | Average Annual Rainfall, mm | Mean Annual Air Temp, °C | Freeze Index, °C-days | Age,years | Traffic Data, number of days | Estimated KESALs per year | |
|---|---|---|---|---|---|---|---|---|---|
| AVC | WIM | ||||||||
| Wet-Freeze | MD | Silt | 1096 | 13.0 | 76 | 7.2 | 218 | 155 | X(1) |
| MN | Sandy clay | 637 | 3.6 | 861 | 8.9 | 717 | 702 | 57 | |
| NJ | Clayey sand | 1205 | 11.5 | 114 | 7.0 | 1,395 | 1,466 | 391 | |
| ME | Poorly graded sand | 1050 | 6.5 | 401 | 4.1 | 0 | 0 | X(1) | |
| MO | – | – | – | – | 0.0 | 0(2) | 0(2) | X(1) | |
| Wet-No-Freeze | TX | Clay | 992 | 18.3 | 17 | 7.8 | 385 | 7 | X(1) |
| GA | Sandy silt | 1428 | 13.1 | 66 | 6.2 | 0 | 0 | X(1) | |
| MS | Clayey silt | 1464 | 16.9 | 16 | 8.9 | 91 | 89 | X(1) | |
| FL | Poorly graded sand | 1488 | 23.6 | 0 | 4.3 | 0 | 0 | X(1) | |
| AL | Clayey sand | 1441 | 18.5 | 5 | 7.7 | 0 | 0 | X(1) | |
| Dry-Freeze | CO | Sandy clay | 417 | 9.5 | 214 | 7.9 | 338 | 1,058 | X(1) |
| AB | Clayey gravel | 524 | 2.0 | 787 | 8.9 | 0 | 0(3) | X(1) | |
| MT | Clayey gravel | 426 | 8.4 | 257 | 8.0 | 930 | 0(3) | X(1) | |
| MB | Sandy silt | 567 | 2.3 | 1047 | 10.0 | 0 | 0(3) | X(1) | |
| Dry-No-Freeze | NM | Silty sand | 325 | 15.1 | 6 | 2.9 | 0 | 0 | X(1) |
| OK | Clayey silt | 844 | 16.0 | 46 | 2.0 | 0 | 0 | X(1) | |
| AZ | Silty sand | 232 | 21.3 | 0 | 9.2 | 409 | 290 | 587 | |
| CA | Poorly graded sand | 119 | 19.4 | 1 | 7.3 | 32 | 32 | X(1) | |
Notes:
Original Pavement Condition
Each of the SPS-5 projects has been categorized based on the condition of the original pavement; a designation of fair or poor was assigned by the owner agency nominating the SPS-5 project. These ratings were purely subjective and not based on the actual amount of distress on the project–they were only used to ensure a range of surface conditions of the original pavement before rehabilitation.
Actual pavement condition data were collected before the rehabilitation of the test sections by the RCOs. These data included deflections from FWD testing, longitudinal profile, pavement distress, and transverse profile. Table 10 summarizes the average International Roughness Index (IRI), rut depths, fatigue cracking, and transverse cracking on each SPS-5 project before overlay placement. The pavement condition and distress data along each of the test sections are available; however, not all data have passed the QC checks for a Level E data status.
| Original Pavement Condition | State/Province | Average IRI, m/km | Average Rut Depth, mm | Average Fatigue Cracking, m2 | Average Transverse Cracking Length, m |
|---|---|---|---|---|---|
| Fair | Maryland | 1.64 | 7 | 62.5 | 33.2 |
| Minnesota | 2.70 | — | 0 | 128.8 | |
| Maryland | 1.86 | 7 | 76.9 | 18.6 | |
| Texas | 1.46 | 10 | — | — | |
| Georgia | 1.03 | — | 2.5 | 0.8 | |
| Colorado | 1.88 | 15 | 11.8 | 20.3 | |
| Alberta | 1.83 | — | 1.3 | 0.7 | |
| Montana | 1.36 | 13 | 115.6 | 70.4 | |
| New Mexico | 2.36 | — | 4.9 | 32.1 | |
| Oklahoma | 1.88 | — | 0.2 | 24.1 | |
| Poor | Alabama> | 1.14 | – | 21.5 | 1.6 |
| Florida | 1.16 | — | 183.1 | 34.5 | |
| Maine | 1,22 | 15 | 0.0 | 6.0 | |
| Mississippi | 2.19 | 19 | 1.9 | 59.9 | |
| Missouri | — | — | — | — | |
| Arizona | 1.84 | — | 74.4 | 277.2 | |
| California | 2.29 | 9 | 37.2 | 116.6 | |
| Manitoba | — | — | 7.7 | 4.7 |
Overall, the value of the individual performance indicators of the two pavement groups (fair and poor) appears to be minimal, but there is a large difference in the performance indicators between the projects included in the SPS-5 experiment, which satisfies the experiment design requirement.
Layer Thickness/Structure
The pavement structure data are divided into two elements, layer data and pavement design features. Important general design features such as drainage, lane width, and shoulder type are included in IMS tables INV_GENERAL and INV_SHOULDER. All key design-feature data were available for all SPS-5 projects with one exception–as of the time of this report, the data for the Missouri project had not yet been processed through the system. All available data were at level E.
The postconstruction pavement layer data for the SPS-5 test sections are available from two different sources. IMS table SPS5_LAYER_THICKNESS contains data from the rod-and-level measurements that were performed to determine the depth of milling and the thicknesses of the overlay layers. Estimates of the thicknesses of the layers of the pavement structure after construction are stored in the IMS table SPS5_LAYER. Finally, the representative thicknesses are stored in IMS table TST_L05B. These thicknesses are determined by the RCO by reviewing data from the rod-and-level measurements, thicknesses from cores recovered on-site, and any other available data. While IMS table SPS5_LAYER only provides thicknesses for the postconstruction layer structure, IMS table TST_L05B provides two sets of thicknesses–one for the preconstruction structure and one for the postconstruction structure.
All three of the above tables were examined to evaluate the thickness measurements and variation of the layer thickness data for each layer of overlay and existing pavement. The average thickness of each layer is provided in appendix B for all projects for which data were available. IMS table TST_L05B contains records for 14 of the 18 projects. Level E data for the Alabama, Missouri, New Mexico, and Oklahoma projects were unavailable. The Missouri, New Mexico, and Oklahoma projects were relatively new projects–the data had not passed all QC checks to achieve a Level E status at the time of data extraction for this study. The Alabama project was more than 7 years old.
IMS table SPS5_LAYER contains data for 16 of the SPS-5 projects; all available data were at level E. The Minnesota and Missouri projects did not have construction data in the database; and the Missouri project was new and very little data were available. The Minnesota project was more than 8 years old.
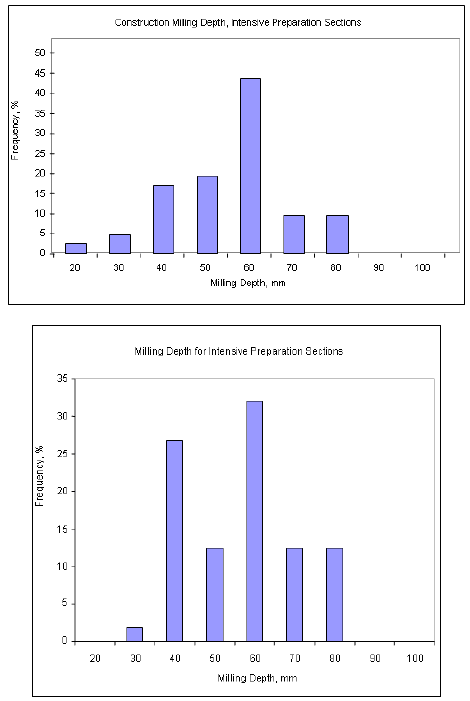
Histograms for the milling depth and the two overlay material thickness levels are shown in figures 3 through 5. These histograms review the distribution of layer thicknesses for all projects. Each shows the distribution of layer thicknesses from IMS table TST_L05B and from the construction data in IMS table SPS5_LAYER_THICKNESS. The distribution among the different methods is similar and the average values, taken from those thickness-determination methods, are approximately equal. These thickness variations represent typical construction practices and all data sets are distributed normally. The variations in layer thickness, which are greater than required by construction guidelines, are not believed to be detrimental to the experiment.
The experiment-wide average layer thicknesses were within the construction guidelines for each layer. The average thickness for some layers for some projects did not fall within the allowable deviation limits as shown in figures 3 and 4. All layers on all projects had at least one thickness measurement from the rod-and-level data that was outside allowable limits. It is believed that the construction guidelines called for an impractical tolerance.
Figure 3. Histograms. Thicknesses for the thin overlay layer (50 mm) from IMS tables SPS5_LAYER_THICKNESS (construction data) and TST_L05B.
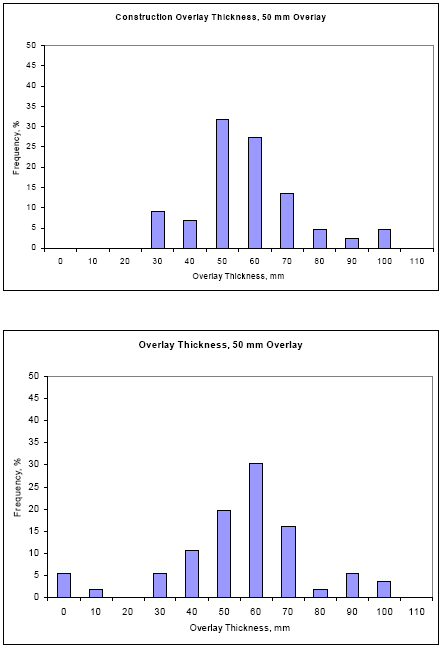
Figure 4. Histograms. Thicknesses for the thick overlay (125 mm) from IMS tables SPS5_LAYER_THICKNESS (construction data) and TST_L05B.
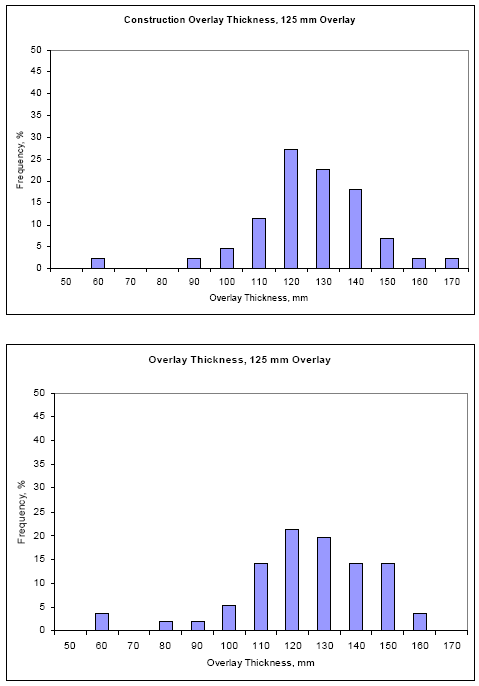
Figure 5. Histograms. Milling depth for sections with intensive surface preparation from IMS tables SPS5_LAYER_THICKNESS (construction data) and TST_L05B.
The pavement cross section and material types planned for each test section within the core experiment of each project generally were met and followed, based on construction guidelines.
The SPS-5 experiment design called for all projects to have a fine-grained soil. However, 9 of the 18 projects have a coarse-grained soil, and 4 have both types of soils (refer to tables 3 and 9). The variation in soil classification at these four sites (California, Colorado, Georgia, and Manitoba), as well as at the other 14 sites, is considered typical and this deviation from the experimental requirement should have no detrimental impact on the SPS-5 experiment.
Field and laboratory tests were conducted to establish the properties of each material included in the SPS-5 experiment. A round of testing was done on each project before construction of the overlay layers to establish the material characteristics of the existing pavement structure. A second round was done on the overlay mixtures to evaluate the material properties and variation of properties for the overlays. Many properties or material characteristics are those used in existing pavement design and analysis methods.
The material sampling and testing requirements are documented in the SPS-5 materials sampling and testing guidelines report. This report contains the development of the SPS-5 sampling and testing plans, field material sampling and testing requirements, and laboratory materials testing requirements for each SPS-5 project site. A generalized version of these plans is provided in chapter 3; specific testing requirements for each material are in appendix A.
Tables 11 through 13 summarize the available test data from selected tests for the subgrade soil, existing HMA layer, and HMA overlay for each SPS-5 project; table 14 provides a summary of the overall materials testing completed for the core test sections. As shown, a substantial amount of testing still needed to be completed, even for those tests identified as essential (see table 6). LTPP and the RCOs recognize the importance of the laboratory material tests and have taken action to obtain these data for all projects.
| Project | Age, years |
Subgrade Soil Testing | |||
|---|---|---|---|---|---|
| Gradation | Atterberg Limits | Moisture-Density Relations | Resilient Modulus | ||
| Manitoba | 10.0 | 100 | 0 | 100 | 0 |
| Arizona | 9.2 | 100 | 100 | 100 | 0 |
| Alberta | 8.9 | 100 | 100 | 100 | 66 |
| Mississippi | 8.9 | 100 | 100 | 100 | 100 |
| Minnesota | 8.9 | 100 | 100 | 100 | 0 |
| Montana | 8.0 | 100 | 100 | 100 | 33 |
| Colorado | 7.9 | 100 | 100 | 100 | 100 |
| Texas | 7.8 | 100 | 100 | 100 | 100 |
| Alabama | 7.7 | 100 | 100 | 100 | 100 |
| California | 7.3 | 100 | 100 | 100 | 0 |
| Maryland | 7.2 | 0 | 0 | 0 | 0 |
| New Jersey | 7.0 | 66 | 100 | 0 | 66 |
| Georgia | 6.2 | 50 | 50 | 50 | 75 |
| Florida | 4.3 | 33 | 33 | 33 | 33 |
| Maine | 4.1 | 100 | 100 | 100 | 0 |
| New Mexico | 2.9 | 0 | 0 | 0 | 0 |
| Oklahoma | 2.1 | 0 | 0 | 0 | 0 |
| Missouri | 0.0 | 0 | 0 | 0 | 0 |
| Project | Age, years |
Existing HMA Layer | |||||
|---|---|---|---|---|---|---|---|
| Core Exam. | Spec. Grav. Bulk/Rice | Asphalt Content | Moisture Suscep. | Gradation | Asphalt Viscosity | ||
| Manitoba | 10.0 | 0 | 0/0 | 0 | 0 | 0 | 0 |
| Arizona | 9.2 | 100 | 90/66 | 100 | 0 | 100 | 100 |
| Alberta | 8.9 | 100 | 100/100 | 100 | 0 | 100 | 100 |
| Mississippi | 8.9 | 100 | 0/0 | 0 | 0 | 0 | 0 |
| Minnesota | 8.9 | 10 | 33/0 | 0 | 0 | 0 | 0 |
| Montana | 8.0 | 100 | 100/100 | 100 | 0 | 100 | 100 |
| Colorado | 7.9 | 100 | 85/66 | 100 | 0 | 66 | 66 |
| Texas | 7.8 | 100 | 100/100 | 100 | 0 | 100 | 100 |
| Alabama | 7.7 | 50 | 0/0 | 0 | 0 | 0 | 0 |
| California | 7.3 | 0 | 0/0 | 0 | 0 | 0 | 0 |
| Maryland | 7.2 | 100 | 100/100 | 100 | 0 | 100 | 100 |
| New Jersey | 7.0 | 100 | 100/0 | 0 | 0 | 0 | 0 |
| Georgia | 6.2 | 100 | 100/0 | 75 | 0 | 75 | 75 |
| Florida | 4.3 | 80 | 70/0 | 0 | 0 | 0 | 0 |
| Maine | 4.1 | 100 | 100/100 | 100 | 0 | 100 | 0 |
| New Mexico | 2.9 | 0 | 0/100 | 100 | 0 | 100 | 100 |
| Oklahoma | 2.1 | 0 | 0/100 | 100 | 0 | 100 | 100 |
| Missouri | 0.0 | 0 | 0/0 | 0 | 0 | 0 | 0 |
| Project | Age, years |
HMA Overlay | |||||
|---|---|---|---|---|---|---|---|
| Core Exam. | Spec. Grav. Bulk/Rice | Asphalt Content | Moist. S., Strength, Creep. |
Gradation | Asphalt Viscosity | ||
| Manitoba | 10.0 | 100 | 0/0 | 0 | 0/0/0 | 0 | 0 |
| Arizona | 9.2 | 100 | 100/100 | 100 | 0/0/0 | 100 | 100 |
| Alberta | 8.9 | 100 | 100/100 | 100 | 0/0/0 | 100 | 100 |
| Mississippi | 8.9 | 75 | 0/0 | 0 | 0/0/0 | 0 | 0 |
| Minnesota | 8.9 | 10 | 10/0 | 0 | 0/0/0 | 0 | 0 |
| Montana | 8.0 | 100 | 75/100 | 100 | 0/0/0 | 100 | 100 |
| Colorado | 7.9 | 100 | 100/65 | 65 | 0/0/0 | 85 | 65 |
| Texas | 7.8 | 100 | 50/50 | 50 | 0/0/0 | 0 | 50 |
| Alabama | 7.7 | 50 | 0/0 | 0 | 0/0/0 | 0 | 0 |
| California | 7.3 | 0 | 0/0 | 0 | 0/0/0 | 0 | 0 |
| Maryland | 7.2 | 0 | 100/100 | 100 | 100/0/0 | 100 | 100 |
| New Jersey | 7.0 | 100 | 100/100 | 100 | 0/0/0 | 100 | 50 |
| Georgia | 6.2 | 100 | 100/0 | 0 | 0/0/0 | 0 | 0 |
| Florida | 4.3 | 100 | 100/100 | 100 | 100/0/0 | 100 | 100 |
| Maine | 4.1 | 100 | 100/50 | 100 | 100/0/0 | 100 | 100 |
| New Mexico | 2.9 | 0 | 0/0 | 0 | 0/0/0 | 0 | 0 |
| Oklahoma | 2.1 | 0 | 0/50 | 10/0/0 | 0 | 0 | |
| Missouri | 0.0 | 0 | 0/0 | 0 | 0/0/0 | 0 | 0 |
| Climate | Original Pavement Condition | State | Material | |||
|---|---|---|---|---|---|---|
| Surface | Base | Subgrade | Overlay | |||
| Wet-Freeze | Fair | MD | 100 | 100 | 17 | 69 |
| MN | 11 | 50 | 50 | 4 | ||
| NJ | 62 | 33 | 39 | 72 | ||
| Poor | ME | 84 | 57 | 86 | 61 | |
| MO | 0 | 0 | 0 | 0 | ||
| Wet-No-Freeze | Fair | TX | 98 | 100 | 100 | 40 |
| GA | 82 | 0 | 71 | 52 | ||
| Poor | MS | 46 | 0 | 100 | 17 | |
| FL | 55 | 44 | 44 | 83 | ||
| AL | 26 | 78 | 100 | 0 | ||
| Dry-Freeze | Fair | CO | 82 | 100 | 94 | 79 |
| AB | 95 | 100 | 89 | 78 | ||
| MT | 98 | 67 | 67 | 24 | ||
| Poor | MB | 4 | 67 | 67 | 24 | |
| Dry-No-Freeze | Fair | NM | 87 | 0 | 0 | 0 |
| OK | 34 | 0 | 0 | 2 | ||
| Poor | AZ | 87 | 83 | 100 | 71 | |
| CZ | 0 | 0 | 67 | 0 | ||
Note: More materials tests have been completed than summarized because some test results have not passed all QC checks to achieve a Level E data status in the IMS.
To evaluate the relative difference in construction of in-place properties, histograms of different material properties were prepared. Figures 6 and 7 show gradation test results for the percentage passing the number 4 and number 200 sieves for recycled and virgin overlay layers.
Figures 8 and 9 show the variation of air voids in both the virgin HMA and RAP overlay layers. These variations are substantial enough to cause a significant difference in performance. In fact, some air voids are greater than 10 percent, indicating inadequate compaction or other mixture problems. The differences in air voids need to be considered and accounted for in any analysis of performance data.
In summary, the between-project variation of different material properties can be large and will need to be considered as a secondary variable in completing a global analysis of SPS-5 results. The within-project variation, however, is much lower and typical of standard construction practices for a project.
Traffic data provide estimates of annual vehicle counts by vehicle classification and distribution of axle weights by axle type. Annual traffic summary statistics are stored in the IMS traffic module when available. These data are supposed to be provided for each year after the roadway was opened to traffic. For the SPS-5 experiment, traffic data are collected at the project site using a combination of permanent and portable equipment by the individual States agencies and/or Canadian provinces.
The SPS-5 experiment design calls for continuous AVC monitoring with WIM data collected at least 2 days of the year. IMS table TRF_MONITOR_BASIC_INFO was examined to identify the SPS-5 records with WIM, AVC data, and annual ESAL estimates. The availability of WIM and AVC was further classified as "at least 1-day" or "continuous."
Continuous AVC and WIM monitoring were defined for two different conditions. In the past, LTPP has defined continuous AVC monitoring as more than 300 AVC monitoring days in a given year, and continuous WIM as more than 210 WIM monitoring days in a given year. However, based on variability measurements and the minimum number of sampling days recommended in NCHRP Project 1-37A for sampling truck traffic, continuous AVC and WIM monitoring were defined as of the time of this report as more than 45 monitoring days in a given season.
Figure 6. Histograms. Gradation of aggregate in RAP overlay.
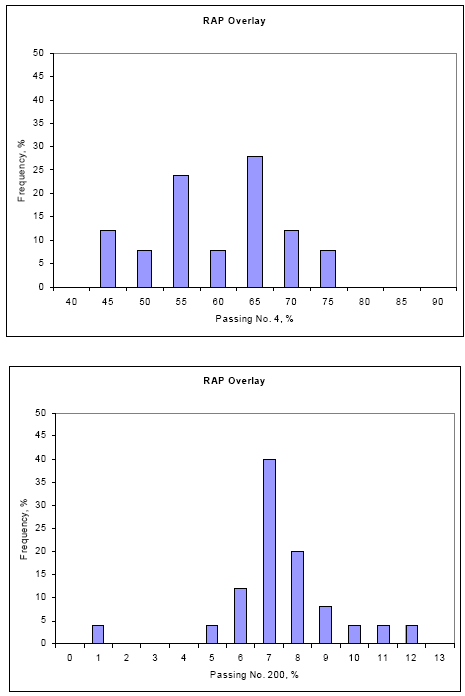
Figure 7. Histograms. Gradation of the aggregate contained in the virgin asphalt overlay.
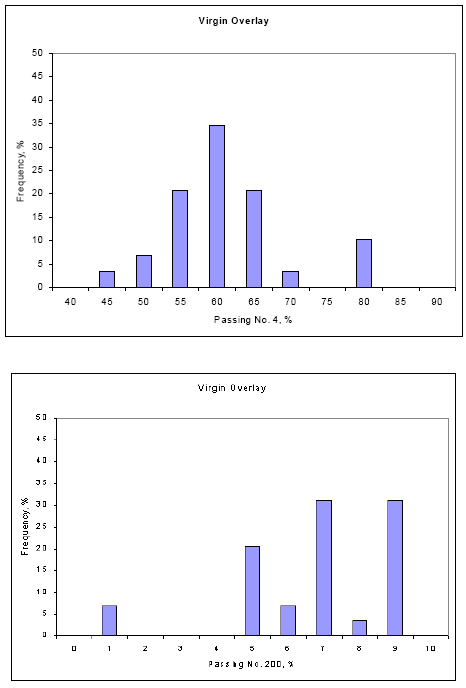
Figure 8. Histogram. Air voids measured on the virgin overlay.
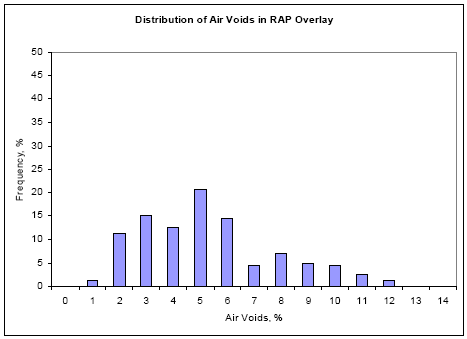
Figure 9. Histogram. Air voids measured on the RAP overlay.
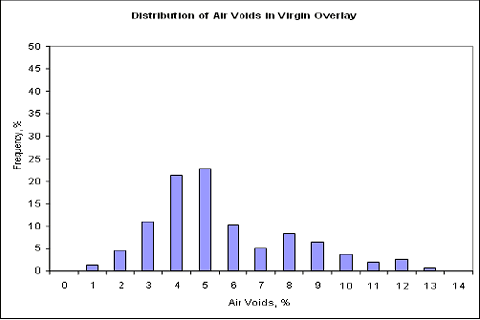
Table 7 identified sites where traffic monitoring equipment had been installed as of the time of this report. As shown, 11 projects had the required equipment, while 7 did not. Table 9 summarized the number of continuous AVC and WIM days available for each project. Half of the SPS-5 projects (9 projects) had no traffic data at Level E. This is considered a significant detriment to the experiment.
In the original SPS-5 experiment, traffic was incorporated as a covariate in the experiment design. A traffic level of at least 85,000 ESALs per year was required for each project. The actual ESALs per year at each site are tabulated in table 9. The requirement was met for two of the three projects for which ESAL estimates were available. The more important point is that a reliable estimate of the annual ESALs was unavailable for 15 of the 18 SPS-5 projects at the time of data extraction.
The range of traffic loads between the sites will need to be fully considered in any comparative analysis of these data. More important, the missing traffic data will severely restrict the use of the SPS-5 experiment for validating mechanistic-empirical design and analysis methods. On the positive side, WIM equipment has been installed at nine of the SPS-5 sites, but not all data collected is at Level E in the IMS. Table 15 shows that the older projects have the greater amounts of Level E traffic data. A concerted effort is being made by LTPP and the RCOs to have the traffic monitoring equipment installed at the remaining sites.
Several types of monitoring data are presented in the LTPP IMS, including distresses (from both manual and photographic surveys), longitudinal profiles, transverse profiles, deflection, and friction. Chapter 3 reviewed the required monitoring frequency for each data element for the SPS-5 experiment. In general, the requirements have been met for both the initial and long-term monitoring frequency. The number of measurements for each test section in each project are tabulated and discussed in appendix A.
Table 16 summarizes the minimum number of distress and other performance indicator measurements made at each SPS-5 site. Very few friction measurements had been performed on these projects, while there had been numerous deflection and longitudinal profile tests. Other than for the Missouri project, at least one survey for each of the monitoring data elements had been made at each site except for the friction and photographic surveys. As previously noted, the Missouri project had been constructed, but the data were unavailable at the time of data extraction. Table 17 summarizes the average time, in years, between each set of measurements for each performance indicator. Most monitored data have been measured more frequently than required by the guidelines.
| Project | Age, years | Equipment installed | Number of AVC days | Number of WIM days |
|---|---|---|---|---|
| Manitoba | 10.0 | √ | X(1) | X(1) |
| Arizona | 9.2 | √ | 409 | 290 |
| Alberta | 8.9 | √ | X(1) | X(1) |
| Mississippi | 8.9 | √ | 91 | 89 |
| Minnesota | 8.9 | √ | 717 | 702 |
| Montana | 8.0 | √ | 930 | |
| Colorado | 7.9 | √ | 1,064 | 338 |
| Texas | 7.8 | √ | 385 | 7 |
| Alabama | 7.7 | – | – | – |
| California | 7.3 | √ | 32 | 32 |
| Maryland | 7.2 | √ | 218 | 2 |
| New Jersey | 7.0 | – | 1,395 | 1,491 |
| Georgia | 6.2 | – | – | – |
| Florida | 4.3 | – | – | – |
| Maine | 4.1 | – | – | – |
| New Mexico | 2.9 | – | – | – |
| Oklahoma | 2.1 | – | – | – |
| Missouri | 0.0 | – | – | – |
Note 1. Traffic data collected at the site, but that data have not passed all of the QC checks to reach a Level E status in the IMS.
| Project | Region | Age, Years |
Deflection Surveys |
Distress | Transverse Profiles |
Longitudinal Profiles |
Friction Surveys |
|
|---|---|---|---|---|---|---|---|---|
| Manual | Photographic | |||||||
| Maine | North Atlantic | 4.1 | 3 | 3 | 1 | 4 | 3 | 3 |
| Maryland | 7.2 | 5 | 4 | 2 | 6 | 8 | 3 | |
| New Jersey | 7.0 | 4 | 3 | 2 | 6 | 5 | 2 | |
| Minnesota | North Central | 8.9 | 6 | 4 | 2 | 3 | 6 | 0 |
| Missouri | – | 1 | 2 | 0 | 0 | 0 | 0 | |
| Manitoba | 10.0 | 7 | 6 | 3 | 5 | 8 | 4 | |
| Alabama | South | 7.7 | 3 | 4 | 2 | 3 | 3 | 2 |
| Florida | 4.3 | 2 | 3 | 1 | 3 | 3 | 2 | |
| Georgia | 6.2 | 4 | 4 | 2 | 3 | 3 | 4 | |
| Mississippi | 8.9 | 6 | 2 | 3 | 4 | 6 | 0 | |
| New Mexico | 2.9 | 2 | 2 | 0 | 1 | 1 | 0 | |
| Oklahoma | 2.1 | 3 | 2 | 0 | 1 | 2 | 1 | |
| Texas | 7.8 | 5 | 3 | 2 | 5 | 5 | 4 | |
| Arizona | West | 9.2 | 7 | 4 | 3 | 6 | 7 | 3 |
| California | 7.3 | 5 | 4 | 3 | 8 | 8 | 1 | |
| Colorado | 7.9 | 6 | 4 | 2 | 6 | 9 | 1 | |
| Montana | 8.0 | 5 | 3 | 2 | 5 | 11 | 2 | |
| Alberta | 8.9 | 5 | 4 | 3 | 4 | 10 | 2 | |
| Project | Age, years |
Longitudinal Profiles |
Transverse Profiles |
Distress | Deflection Surveys |
|
|---|---|---|---|---|---|---|
| Manual | Photographic | |||||
| Manitoba | 10.0 | 1.3 | 2.0 | 1.7 | 3.3 | 1.4 |
| Arizona | 9.2 | 1.3 | 1.5 | 2.3 | 3.1 | 1.3 |
| Alberta | 8.9 | 0.9 | 2.2 | 2.2 | 3.0 | 1.8 |
| Minnesota | 8.9 | 1.5 | 3.0 | 2.2 | 4.5 | 1.5 |
| Mississippi | 8.9 | 1.5 | 2.2 | 4.5 | 3.0 | 1.5 |
| Montana | 8.0 | 0.7 | 1.6 | 2.7 | 4.0 | 1.6 |
| Colorado | 7.9 | 0.9 | 1.3 | 2.0 | 4.0 | 1.3 |
| Texas | 7.8 | 1.6 | 1.6 | 2.6 | 3.9 | 1.6 |
| Alabama | 7.7 | 2.6 | 2.6 | 1.9 | 3.9 | 2.6 |
| California | 7.3 | 0.9 | 0.9 | 1.8 | 2.4 | 1.4 |
| Maryland | 7.2 | 1.6 | 1.2 | 1.8 | 3.6 | 1.8 |
| N. Jersey | 7.0 | 2.6 | 1.2 | 2.3 | 3.5 | 1.6 |
| Georgia | 6.2 | 0.9 | 2.1 | 1.6 | 3.1 | 2.2 |
| Florida | 4.3 | 1.4 | 1.4 | 1.4 | 4.3 | 1.4 |
| Maine | 4.1 | 1.4 | 1.0 | 1.4 | 4.1 | 1.5 |
| N. Mexico | 2.9 | 2.9 | 2.9 | 1.5 | – | 1.4 |
| Oklahoma | 2.1 | 1.1 | 2.1 | 1.1 | – | 0.7 |
| Missouri | 0.0 | – | – | – | – | – |
Table 18 presents an overall summary of the SPS-5 projects (as of the time of this report), noting and identifying the project deviations, construction difficulties, and overall data completeness. These factors have been aggregated into an "adequacy code," which consists of a numerical scale from 0 to 5 that provides an overall rating of the project and test sections for fulfilling the original experimental objectives and expectations. A definition of this numerical scale for the adequacy code is given below.
Relatively few project deviations and construction problems were encountered during the construction of these projects. Of those difficulties and deviations noted, none are considered fatal to the overall expectations of the projects included in this experiment. However, there are some data elements at specific project sites that will have a negative effect on accomplishing the experiment objectives if they are not collected in the future. Primarily, these include traffic and some of the materials/layer properties. In fact, the essential material data elements and traffic data are considered vital to the SPS-5 experiment. The omission of these data elements is reflected in the overall adequacy code for each project.
As listed in table 18, only one project had an adequacy code of 0, the Missouri project. This project was recently constructed as of the time of this report and had little data in the database. It is expected that the adequacy code for this project will increase as more data become available and are entered into the IMS.
Three projects had an adequacy code of 2: Alabama, New Mexico, and Oklahoma. None had traffic monitoring equipment installed at the site; all had substantial materials test data that were unavailable; and not all of the preconstruction monitoring data were at Level E in the IMS.
Four projects (California, Florida, Georgia, and Manitoba) were assigned an adequacy code of 3 for a variety of reasons. A substantial amount of materials test data and some of the preconstruction performance data were unavailable at Level E. All other projects were assigned an adequacy code of 4 or 5.
| Project | Construction Difficulties and Deviations | Adequacy Code |
|---|---|---|
| Alabama | Mix laid at low temperature on 010507 Milling performed by project without cooling agent Delamination occurred on existing pavement during milling operation | 2 |
| Arizona | Milling exceeded allowable limits on some of the minimum restoration sections Some areas of re-milling due to milling width Overlay placed at low temperature on some areas | 3 |
| California | Segregation in first lift Frequent stops and starts of the paver Problems with compaction in some areas | 3 |
| Colorado | Control section was overlaid | 5 |
| Florida | The first 15 m of 120502 were milled Evidence of segregation in RAP mix Area of 120508 was not sufficiently tacked | 3 |
| Georgia | Delay in paving on 130502 produced surface anomalies | 3 |
| Maine | No restoration on minimum restoration Overlay thickness too large on some sections | 4 |
| Maryland | Number 4 sieve for virgin mix did not meet project requirements | 5 |
| Minnesota | Variation in subgrade from fine to coarse Town in the middle of project | 4 |
| Mississippi | Production plant breakdowns caused delays Problems maintaining consistent mix | 5 |
| Missouri | Recently constructed | 0 |
| Montana | Control section was overlaid Number 4 sieve for RAP mix did not meet project requirement | 5 |
| New Jersey | Depth of milling was not measured Milling extended into granular base in some areas Fracturing of aggregate at center longitudinal joint on both the binder and surface overlay layers | 5 |
| New Mexico | High air voids on RAP mix Control section was milled and overlaid | 2 |
| Oklahoma | First batch of RAP mix contained too much asphalt cement Number 4 sieve for both the RAP and the virgin mix did not meet the project requirement | 2 |
| Texas | Rain delays Problems with the mix designs Breakdown of production plant | 4 |
| Alberta | Tack coat bubbling through overlay surface course on 810502 Depression left by pneumatic roller on 810505 | 4 |
| Manitoba | Field sampling not conducted in accordance with guidelines Project located on coarse-grained soil Overlay thicknesses vary by more than 25 mm | 4 |

