U.S. Department of Transportation
Federal Highway Administration
1200 New Jersey Avenue, SE
Washington, DC 20590
202-366-4000
Federal Highway Administration Research and Technology
Coordinating, Developing, and Delivering Highway Transportation Innovations
 |
| This report is an archived publication and may contain dated technical, contact, and link information |
|
Publication Number: FHWA-RD-02-082 Date: August 2006 |
This site consists of two eastbound lanes of State Route 58 eastbound in Boron, CA, as well as an overhead structure carrying State Route 58 over a rail spur immediately before the test section. The individual test sites and test results are described in the following sections.
The Boron overhead, Bridge No. 50-353R 9-KER-58-R141.5, consists of two parallel structures carrying State Route 58 over the rail spur leading to the U.S. Borax mine in Boron, CA. Each structure consists of a three-span continuous bridge with no expansion joints. Each bridge has two traffic lanes and a shoulder. The bridge beams were cast integrally with the deck slab. The entire deck appears to be undergoing significant ASR, as manifested by widespread visible map cracking. The deck surface was treated with a methacrylate (HMWM) in 1995, into which a coarse, rounded sand was broadcast. Figure 35 shows a photograph of the deck surface.
Figure 35. Treated section on Boron overhead structure over State Route 58 looking east (Boron, CA).
The following information was excerpted from the CTL report (Stark to Surdahl letter, dated October 8, 1997):
This pavement section is located on State Route 58 between Barstow and Mojave near Boron on the Kern-San Bernardino county line in California. The pavement of interest was built between 1971 and 1974 as part of a four-lane divided section with 20.32-cm (8-inch) portland cement concrete slip-formed onto 10.16 to 15.24 cm (4 to 6 inches) of cement-treated base. The concrete was made using low-alkali cement (less than 0.60 percent equivalent to Na2O) and natural sand and gravel from a source in Barstow. In the early to middle 1980s, observations of this and several other concrete structures containing aggregate from the same source revealed deleterious ASR. In 1991, SHRP discussion with CALTRANS [California Department of Transportation] personnel revealed major surface cracking had been observed in the State Route 58 pavement. In 1988, a high molecular weight methacrylate (HMWM) had been applied to the pavement wearing surface in selected westbound sections near Boron to minimize cracking development and improve and prolong traffic service life, particularly with truck loading. A side effect would be to minimize any effects of deleterious ASR. In 1991, cores were taken as part of the SHRP program to confirm the occurrence of ASR and estimate the depth of penetration of the HMWM into the pavement concrete.
As noted in SHRP-C-343, six full-depth 10.16-cm (4-inch) diameter cores were taken from the experimental pavement section of Route 58, and sawed and finely lapped in the longitudinal direction for microscopic examination. The examinations confirmed that deleterious ASR had developed in the pavement concrete, and that the reactive aggregate constituents were cryptocrystalline volcanics of rhyolite to andesite composition. These were evidenced by reaction rims on aggregate particles, microcracks in the concrete, and ASR gel in cracks and voids. The examinations revealed that the applied HMWM penetrated and filled surface cracks to maximum depths of 51 to 62 mm (2 to 2.25 inch). Also, HMWM was found to have penetrated and filled cracks as little as 0.05 m (0.002 in) wide.
For a period of years since 1988 when HMWM was applied, improved performance was noted, compared with sections with no treatment. For more than 5 years, only minor additional surface cracking appeared, while more severe surface cracks continued to develop along transverse joints, and adjacent to other random cracks in untreated sections. Also, numerous small surface spalls continued to develop in the untreated sections but not in the treated sections.
By 1995, 7 years after application of HMWM on State Route 58, it became apparent to CALTRANS that pavement performance both with and without the treatment reached a state of deterioration that required full-surface overlay. In 1996, this asphalt overlay was completed. However, CALTRANS agreed to retain a short section of exposed pavement with HMWM. This is presently the only section still available for visual inspection.
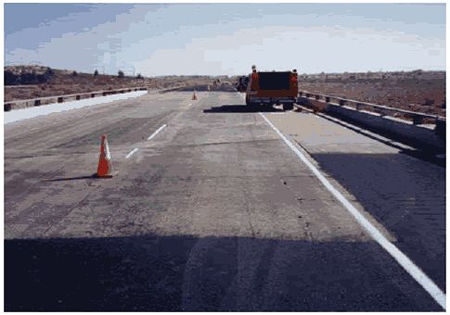
The test section described herein consists of two lanes of U.S. Route 52. Figures 36 and 37 show different views of the test pavement site, and figure 38 shows a plan of the test sections. The original test sections consisted of control 1, methacrylate 1, and methacrylate 2, all of which are located in the travel lane (number 2). Sections methacrylate 1 and methacrylate 2 were treated with a single coat of methacrylate into which a sand was broadcast. In 1995, three test sections in the passing lane (number 1); control 2, control 3, and methacrylate 3 were added alongside the existing test areas in the travel lane (number 2) by CALTRANS to evaluate the effect of traffic loading on the ASR damage. The Boron Overhead section was also added at this time. Lane 1 does not have the extreme damage present at the joints that lane 2 had. A coat of methacrylate was applied to the methacrylate 3 section in 1995, at the same time the bridge deck was treated. At that time, a second coat of methacrylate was added to section methacrylate 2 in the travel lane. Also, in 1995, the pavement on either side of the test section was overlayed with asphaltic concrete. The asphalt overlays were placed to reduce the maintenance liability of the large length of exposed ASR pavement adjacent to the test sections.
Figure 36. Photograph showing part of Boron, CA, test site, M2, Station 250.
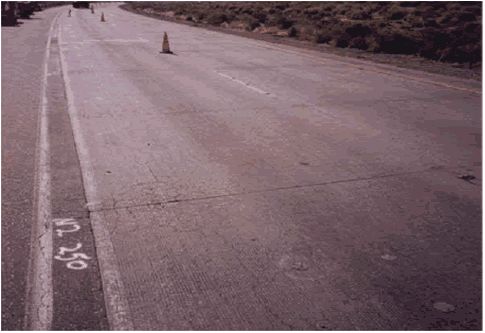
Figure 37. Photograph showing part of Boron, CA, test site, M3, Station 160.
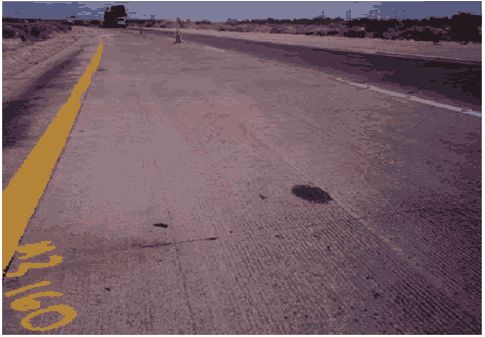
Figure 38. Plan view of Boron, CA, test site.
All the sections making up the Boron, CA, test site had map cracking over 100 percent of their area in 1998. Most of the map cracking was of low severity, but there was some medium and high severity also. Figure 39 shows an example of high-severity map cracking. Figure 40 shows a close-up view of typical map cracking at the Boron site. Figures 41 through 44 show the amount of each level of severity as a percentage of the total area for each section for all 5 years of the study. In the travel lane, control section 1 (C1) had more severe map cracking than the methacrylate sections (M1 and M2). The cracking was less severe in M2 than in M1. It appears that the second application of methacrylate to section M2 in 1995 has helped reduce cracking. In the passing lane, methacrylate section 3 (M3) is performing better than control section 3 (C3). Overall, the passing lane sections are performing better than the travel lane sections. A description of the map cracking in each section is as follows:
Figure 39. Example of high-severity map cracking (Boron, CA).
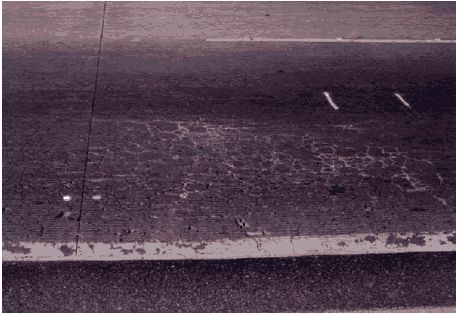
Figure 40. Close-up photograph showing typical map cracking (Boron, CA).
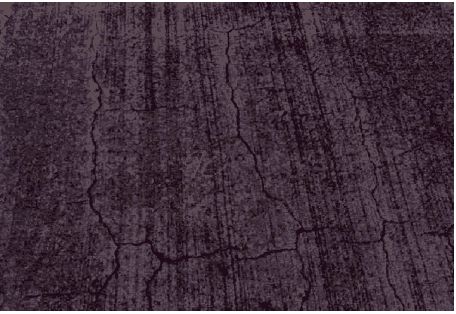
Figure 41. Map cracking as a percentage for each level of severity (Boron, CA, 1995).
Figure 42. Map cracking as a percentage for each level of severity (Boron, CA, 1996).
Figure 43. Map cracking as a percentage for each level of severity (Boron, CA, 1997).
Figure 44. Map cracking as a percentage for each level of severity (Boron, CA, 1998).
The widespread map cracking in the test sections made exact crack recording impossible. Therefore, only the large, clearly visible cracks were noted. The transverse joints were all completely distressed, with cracks and spalled areas occurring over the entire length of the joints. Figure 45 shows a photograph with an example of medium-severity joint distress. Figure 46 shows an example of high-severity joint distress. According to the LTPP criteria for rating joint distress, the entire length of each joint was rated at the highest severity level if at least 10 percent of the joint length had the higher severity distress.
Figure 45. Photograph showing medium-severity joint distress (Boron, CA).
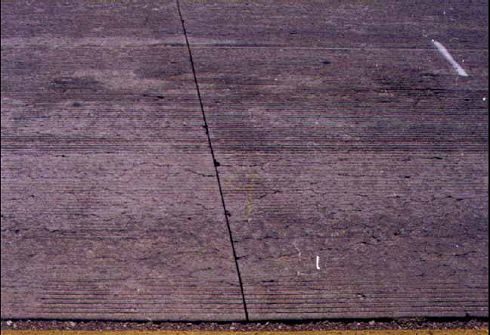
Figure 46. Photograph showing an example of high-severity joint distress (Boron, CA).
Figures 47 through 50 are a series of graphs illustrating the amount and severity of joint distress for each section. There is also a series of graphs showing the actual lengths of distress at each level in figures 51 through 54. Both series compare all sections for each year. The 1998 observations of the joint distress for individual sections are as follows:
Figure 47. Amount and severity of joint distress (Boron, CA, 1995).
Figure 48. Amount and severity of joint distress (Boron, CA, 1996).
Figure 49. Amount and severity of joint distress (Boron, CA, 1997).
Figure 50. Amount and severity of joint distress (Boron, CA, 1998).
Figure 51. True length of joint spalls at each level of severity (Boron, CA, 1995).
Figure 52. True length of joint spalls at each level of severity (Boron, CA, 1996).
Figure 53. True length of joint spalls at each level of severity (Boron, CA, 1997).
Figure 54. True length of joint spalls at each level of severity (Boron, CA, 1998).
In general, the sections in the travel lane had more severe joint distress than those sections in the passing lane. The control sections had the most severe joint distress in each lane relative to the treated areas. The second application of methacrylate to section M2 appeared to have helped, the severity of distress in M2 being less than that in section M1.
Visual surveys of the pavement sections were performed as previously done, with the wheelpath and centerline grading system changed to include sections with small, loose pieces in the high-severity (H) category. The wheelpaths and centerline were rated as follows:
Table 24 shows the number of slabs in each section at each level of severity for all years of the study. Some variability in the ratings occurred due to site lighting conditions and other inspection variations. In 1997, all the methacrylate-treated systems had a combination of low-and medium-severity cracking. There was little difference between section M2, which had the second application of methacrylate, and section M1, which only had one application. Both control sections had the most severe cracking with control section C1, which is in the No. 2 travel (truck) lane, having the most severe cracking. Section C1 had medium- and high-severity cracking while C3 had mostly medium severity with a small amount of low-severity cracking. In 1998, C1 still had the most severe cracking. The severity of cracking in all the other sections but M3 had increased. Sections M1 and M2 had medium-severity cracking over the wheelpaths of all slabs in 1998.
| Year | C1 | M1 | M2 | C3 | M3 | ||||||||||
|---|---|---|---|---|---|---|---|---|---|---|---|---|---|---|---|
| L | M | H | L | M | H | L | M | H | L | M | H | L | M | H | |
| 1994 | 0 | 27 | 5 | 1 | 32 | 0 | 0 | 32 | 1 | – | – | – | – | – | – |
| 1995 | 0 | 0 | 32 | 0 | 33 | 0 | 0 | 33 | 0 | 2 | 31 | 0 | – | – | – |
| 1996 | 0 | 6 | 26 | 3 | 30 | 0 | 17 | 15 | 1 | 5 | 28 | 0 | 32 | 2 | 0 |
| 1997 | 0 | 10 | 22 | 22 | 11 | 0 | 19 | 14 | 0 | 1 | 32 | 0 | 17 | 17 | 0 |
| 1998 | 0 | 10 | 22 | 0 | 33 | 0 | 0 | 33 | 0 | 0 | 29 | 4 | 17 | 17 | 0 |
Table 25 shows the number of slabs in each section at each level of severity for all 5 years of the study for the centerline area of the sections. The same trend is evident here as in the wheelpath ratings. The ratings for all sections except M3 were more severe in 1998. Sections M1 and M2 were actually rated less severe than M3 in 1997, but in 1998 they were rated more severe then in previous years. The two control sections were rated the most severely distressed with C1 rated more severe than C3. Overall, the ratings in the centerline areas were much less severe than for the wheelpath areas.
| Year | C1 | M1 | M2 | C3 | M3 | ||||||||||
|---|---|---|---|---|---|---|---|---|---|---|---|---|---|---|---|
| L | M | H | L | M | H | L | M | H | L | M | H | L | M | H | |
| 1994 | 26 | 6 | 0 | 31 | 2 | 0 | 33 | 0 | 0 | – | – | – | – | – | – |
| 1995 | 0 | 32 | 0 | 13 | 20 | 0 | 33 | 0 | 0 | 32 | 1 | 0 | – | – | – |
| 1996 | 3 | 22 | 7 | 33 | 0 | 0 | 30 | 3 | 0 | 30 | 3 | 0 | 33 | 0 | 0 |
| 1997 | 1 | 26 | 5 | 33 | 0 | 0 | 33 | 0 | 0 | 30 | 3 | 0 | 30 | 3 | 0 |
| 1998 | 7 | 25 | 0 | 8 | 25 | 0 | 27 | 6 | 0 | 4 | 29 | 0 | 30 | 3 | 0 |
At least four cores were removed from each section, with many of the removed cores extracted in small, already fractured pieces. The cores were 1.22 and 1.83 m from the shoulder stripe to reflect wheelpath and centerline areas, respectively. The specific locations were chosen to avoid interfering with previous cores. If a core was retrieved in a broken or damaged condition, another core was taken approximately 0.61 m east of the original core at the same distance from the shoulder stripe.
The cores were tested to determine the compressive strength and elastic modulus of the concrete in both wet and dry conditions. The cores were tested in a dry as-received condition, then soaked in lime-saturated water for 2 weeks and retested. After the wet modulus tests were performed, the cores were tested to determine their compressive strength. The results of the dry modulus testing are shown in table 26. The results of the wet modulus testing are shown in table 27.
| Section | 1995 | 1996 | 1997 | 1998 |
|---|---|---|---|---|
| Control 1(C1) | 1.60 | 0.98 | 1.15 | 1.25 |
| Methacrylate 1(M1) | 1.28 | 1.13 | 1.14 | 1.47 |
| Methacrylate 2 (M2) | 1.42 | 1.34 | 1.16 | 1.18 |
| Control 3 (C3) | – | 0.92 | 1.26 | 1.28 |
| Methacrylate 3 (M3) | – | 0.69 | 1.09 | 1.18 |
1 psi = 6.89 kPa
| Section | 1995 | 1996 | 1997 | 1998 |
|---|---|---|---|---|
| Control 1 (C1) | 1.28 | 1.10 | 1.08 | 1.47 |
| Methacrylate 1 (M1) | 1.00 | 0.99 | 1.12 | 1.82 |
| Methacrylate 2 (M2) | 1.19 | 1.30 | 1.09 | 1.49 |
| Control 3 (C3) | – | 0.90 | 1.05 | 1.50 |
| Methacrylate 3 (M3) | – | 0.72 | 0.99 | 1.12 |
1 psi = 6.89 kPa
The results of the modulus testing show there is not much difference in modulus from one section to another. The wet and dry modulus values were generally similar. The one consistent trend is that the modulus for section M3 was the lowest in every year.
The wet lime-saturated compressive strength results are given in table 28. The compressive strength results show no significant difference between the sections. Generally, there has been a decrease in strength of each section over the test years.
| Section | 1995 | 1996 | 1997 | 1998 |
|---|---|---|---|---|
| Control 1 (C1) | 4788 | 4270 | 3605 | 3731 |
| Methacrylate 1 (M1) | 4052 | 4510 | 4041 | 4371 |
| Methacrylate 2 (M2) | 4302 | 5137 | 3803 | 3609 |
| Control 3 (C3) | – | 3985 | 3495 | 3684 |
| Methacrylate 3 (M3) | – | 4280 | 3688 | 3744 |
The cores tested may represent a minimum strength or modulus for intact cores. If a core was taken and it fell apart as it was being removed, another core was drilled. This biases the results because only solid cores can be tested.
Relative humidity samples were removed from one or two locations in each section at various depth intervals, using a 38.1-mm-diameter bit and rotary hammer. The depth intervals and results of the relative humidity testing are shown in tables 29 through 33. Most of the relative humidity measurements were above 80 percent, especially below a depth of 10.2 cm. These results indicate that even though the pavement is located in a very dry climate, sufficient moisture is still present to sustain the ASR. The humidity results for the bridge were much lower than the pavement. This is encouraging and indicates that methacrylate treatment of bridge decks may be much more effective at slowing ASR than when treating pavements.
| Test Area and Section Number | Relative Humidity, Percent (at given depth interval) (inches) | ||||
|---|---|---|---|---|---|
| 0.5–1 | 2–2.5 | 4–4.5 | 6–6.5 | ||
| Number 1 (Passing) Lane | C3 | 88 | 89 | 93 | 92 |
| M3 | 69 | 81 | 87 | 87 | |
| Number 2 (Passing) Lane | C1 | 93 | 87 | 93 | 90 |
| M1 | 78 | 91 | 97 | 92 | |
| M2 | 59 | 97 | 96 | 90 | |
1 inch = 2.54 cm
| Test Area and Section Number | Relative Humidity, Percent (at given depth interval) (inches) | ||||
|---|---|---|---|---|---|
| 0.5–1 | 2–2.5 | 4–4.5 | 6–6.5 | ||
| Number 1(Passing) Lane | C3 | 36 | 63 | 62 | 86 |
| M3 | 46 | 72 | 86 | 90 | |
| Number 2 (Travel) Lane | M1 | 45 | 70 | 62 | 89 |
| M2 | 72 | 84 | 86 | 89 | |
| C1 | 68 | 64 | 90 | 89 | |
| Bridge | 37 | 55 | 66 | 65 | |
1 inch = 2.54 cm
| Test Area and Section Number | Relative Humidity, Percent (at given depth interval) (inches) | ||||
|---|---|---|---|---|---|
| 0.5–1 | 2–2.5 | 4–4.5 | 6–6.5 | ||
| Number 1 (Passing) Lane | C3 | 65 | 90 | 92 | 87 |
| M3 | 69 | 79 | 87 | 83 | |
| Number 2 (Travel) Lane | C1 | 56 | 89 | 84 | 80 |
| M1 | 81 | 90 | 86 | 72 | |
| M2 | 44 | 74 | 70 | 78 | |
1 inch = 2.54 cm
| Test Area and Section Number | Relative Humidity, Percent (at given depth interval) (inches) | ||||
|---|---|---|---|---|---|
| 0.5–1 | 2–2.5 | 4–4.5 | 6–6.5 | ||
| Number 1 (Passing) Lane | C3 | – | – | – | – |
| M3 | 40 | 62 | 86 | 96 | |
| Number 2 (Travel) Lane | M1 | 46 | 93 | 81 | 98 |
| M2 | 43 | 48 | 79 | 87 | |
| C1 | 50 | 76 | 92 | 90 | |
| Bridge | 32 | 46 | 44 | 56 | |
1 inch = 2.54 cm
| Test Area and Section Number | Relative Humidity, Percent (at given depth interval) (inches) | ||||
|---|---|---|---|---|---|
| 0.5–1 | 2–2.5 | 4–4.5 | 6–6.5 | ||
| Number 1 (Passing) Lane | C3 | 48 | 75 | 100 | 100 |
| M3 | 58 | 76 | 97 | 96 | |
| Number 2 (Travel) Lane | M1 | 100 | 100 | 100 | 100 |
| M2 | 100 | 54 | 100 | 93 | |
| C1 | 100 | 100 | 100 | 100 | |
| Bridge | 32 | 39 | 52 | 62 | |
1 inch = 2.54 cm
Two cores from each section were examined petrographically to document the condition of the concrete. The cores were cut length-wise and polished. These sections were then soaked overnight and dried, and the entire lapped surface was traversed under a stereo microscope. Each lapped surface was divided into five or more traverse areas and examined at magnifications of 10 to 30 times. Because of their smaller diameters (6.99 cm (2.75 inches)), the Boron overhead bridge cores were divided into four traverses. All instances of cracks, alkali-silica gel, and deteriorated or reacted aggregate particles were counted. The petrographer’s notes for each year are included in appendix C. Table 34 gives a numerical summary of the findings for 1997 and 1998.
| Core ID | Year | Cracks | Reactive Particles | Gel Locations | ||
|---|---|---|---|---|---|---|
| Micro | Large | Fine | Coarse | |||
| C1-1 | 1997 1998 | 190 86 | 0 5 | 20 21 | 8 22 | 67 49 |
| C1-2 | 1997 1998 | – 60 | – 0 | – 21 | – 23 | – 41 |
| C3-1 | 1997 1998 | 174 50 | 0 3 | 23 8 | 11 11 | 24 28 |
| C3-2 | 1997 1998 | 190 63 | 0 23 | 30 10 | 26 12 | 44 14 |
| M1-1 | 1997 1998 | 191 51 | 0 1 | 33 9 | 23 9 | 65 20 |
| M1-2 | 1997 1998 | – 84 | – 6 | – 15 | – 17 | – 32 |
| M2-1 | 1997 1998 | 135 72 | 0 3 | 24 7 | 29 12 | 59 12 |
| M2-2 | 1997 1998 | – 89 | – 3 | – 16 | – 8 | – 23 |
| M3-1 | 1997 1998 | 134 66 | 0 0 | 32 7 | 31 14 | 46 29 |
| M3-2 | 1997 1998 | – 67 | – 0 | – 13 | – 10 | – 24 |
| OH-1 Bridge | 1997 1998 | 22 29 | 0 2 | 0 8 | 0 7 | 0 29 |
| OH-2 Bridge | 1997 1998 | – 29 | – 1 | – 7 | – 11 | – 36 |
A summary description of the cores from each section follows:
HMWM resin was topically applied to desert pavement sections with moderate to severe ASR distress. The methacrylate has extended the pavement life by filling cracks bonding the pieces of concrete and reducing spalling, especially near joints. The service life extension of one coat of HMWM appears to be about 3 to 5 years. Two coats of resin improved performance further. It is envisioned that periodic reapplication of HMWM would reduce future concrete spalling and continue to extend the pavement life.
HMWM resin was also applied to a bridge deck having low to moderate ASR distress. The resin had been effective in bonding and sealing almost all of the cracks. No new visible cracking was noted over the study period. The relative humidity in the deck concrete is moderately low and to a level that should slow ASR deterioration. Preliminary results are promising and continued monitoring of this structure is recommended.

