U.S. Department of Transportation
Federal Highway Administration
1200 New Jersey Avenue, SE
Washington, DC 20590
202-366-4000
Federal Highway Administration Research and Technology
Coordinating, Developing, and Delivering Highway Transportation Innovations
 |
| This report is an archived publication and may contain dated technical, contact, and link information |
|
Federal Highway Administration > Publications > Research > Structures > Critical Literature Review of High-Performance Corrosion Reinforcements in Concrete Bridge Applications |
Publication Number: FHWA-HRT-4-093 |
Previous | Table of Contents | Next
Experimental techniques that historically have been employed to investigate corrosion phenomena associated with reinforcing steel in concrete (both plain carbon and corrosion resistant), have involved the following categories:
Typically, selecting one method over another recognizes a tradeoff between time and cost versus realistic simulation of actual service with each of these three factors increasing from 1-4. Also at issue is whether a specific method provides design relevant data (time-to-corrosion (ti, see figure 2) and Cl- threshold, for example) or simply information that facilitates ranking of materials. Thus, experiments in category 1 tend to focus on determining the interrelationship between Øcrit, pH, and Cl- concentration (see figure 7) using aqueous solutions that simulate pore water and employing either potentiodynamic anodic polarization or potentiostatic polarization to a relatively positive potential (or both). Methods in categories 2 and 3 use either mortar or concrete-coated specimens, often with relatively high w/c's, low cover, and admixed Cl- and measurement of corrosion potential or corrosion rate by polarization resistance or macrocell current determinations (or both). Time-to-corrosion can also be determined. Category 4 does not represent a specific experimental technique but rather a demonstration or prototype structure. Studies in each of these four areas are reviewed and discussed below.
McDonald et al. performed a comprehensive screening program on a wide variety of CRRs, including stainless steels, as a prelude to testing yard-type exposures.[33] This involved successive 1.75 hours wet-4.25 hours dry exposure in NaCl solutions of pH 7 and 13 of bars that had been bent about a mandrel of diameter 4 times that of the bars. The pH 7 solution simulated preconstruction atmospheric exposure or conditions within a concrete crack; the pH 13 solution simulated concrete pore water. Table 3 lists polarization resistance (PR) and corrosion rate (CR) results for the pH 7 case, and figure 8 shows the corrosion rate data graphically. These indicate that corrosion rate for the stainless steels varied by as much as an order of magnitude, with most data being in the range 0.1-1.0 mille-Amps per meter squared, depending on the specific alloy, or from 2-3 orders of magnitude less than for plain carbon steel.
|
pH 7 + 3 w/o NaCl |
|||||||
|
Reinforcement Type |
Bar Cond*** |
28 Days |
56 Days |
90 Days |
|||
|---|---|---|---|---|---|---|---|
|
PR, Ohm·m2 |
CR, mA/m2* |
PR, Ohm·m2 |
CR, mA/m2* |
PR, Ohm·m2 |
CR,·mA/m2* |
||
|
Plain Carbon (Black) |
As-Recorded |
0.05 |
520 |
0.14 |
186 |
0.05 |
520 |
|
Hole |
0.04 |
650 |
0.05 |
520 |
0.04 |
650 |
|
|
Type 304 |
As-Recorded |
100.40 |
0.26 |
52.42 |
0.50 |
90.96 |
0.29 |
|
Hole |
84.87 |
0.31 |
133.50 |
0.19 |
121.47 |
0.21 |
|
|
Type 304U** |
As-Recorded |
12.57 |
2.07 |
11.88 |
2.19 |
- |
- |
|
Hole |
6.03 |
4.31 |
9.70 |
2.68 |
9.17 |
2.84 |
|
|
Type 304N |
As-Recorded |
43.10 |
0.60 |
59.10 |
0.44 |
76.6 |
0.34 |
|
Hole |
52.70 |
0.49 |
67.63 |
0.38 |
124.88 |
0.21 |
|
|
Type 304 Clad |
As-Recorded |
93.41 |
0.28 |
81.21 |
0.32 |
186.77 |
0.14 |
|
Hole |
10.60 |
2.45 |
12.33 |
2.11 |
12.73 |
2.04 |
|
|
Abrade |
54.38 |
0.48 |
49.57 |
0.52 |
90.69 |
0.29 |
|
|
Nitronic 33TM |
As-Recorded |
38.53 |
0.67 |
57.11 |
0.46 |
97.63 |
0.27 |
|
Hole |
289.30 |
0.09 |
89.73 |
0.29 |
442.4 |
0.06 |
|
|
Type 316 |
As-Recorded |
48.67 |
0.53 |
21.57 |
1.21 |
29.78 |
0.87 |
|
Hole |
56.36 |
0.46 |
135.20 |
0.19 |
130.5 |
0.20 |
|
|
Type 317LN |
As-Recorded |
107.90 |
0.24 |
131.20 |
0.20 |
179.1 |
0.15 |
|
Hole |
37.20 |
0.70 |
93.88 |
0.28 |
168.34 |
0.15 |
|
|
Type XM19 |
As-Recorded |
133.90 |
0.19 |
115.40 |
0.23 |
350 |
0.07 |
|
Hole |
125.70 |
0.21 |
248.20 |
0.10 |
466.3 |
0.06 |
|
* Calculated as CR = 0.026*1000/PR.
** European source.
*** Six mm diameter hole (through cladding in the case of clad
bars).
Similarly, table 4 and figure 9 show comparable data for a 0.30N
KOH+0.05N NaOH solution (pH ![]() 13). Salt
concentration as NaCl for each of 3 successive 56 day test periods
was 3, 9, and 15 w/o, respectively. These yielded
Cl--OH- ratios of 1.5, 4.5, and 7.5,
respectively. The more corrosion-resistant materials were not
tested in the higher pH solution. In all cases, corrosion rates
were lower at pH 13 than at pH 7 by an amount that approached 1
order of magnitude.
13). Salt
concentration as NaCl for each of 3 successive 56 day test periods
was 3, 9, and 15 w/o, respectively. These yielded
Cl--OH- ratios of 1.5, 4.5, and 7.5,
respectively. The more corrosion-resistant materials were not
tested in the higher pH solution. In all cases, corrosion rates
were lower at pH 13 than at pH 7 by an amount that approached 1
order of magnitude.
As an alternative approach, Hurley and Scully performed potentiostatic exposures at potentials as high as +200 mVSCE on Types 304 and 316 stainless steel reinforcements in a saturated Ca(OH)2 solution with incremental Cl- as NaCl additions.[36] The threshold concentration, cth, represented as [Cl-]/[OH-] (molar basis), was related to a current density increase. Figure 10 shows their results as a plot of the [Cl-]/[OH-] molar threshold ratio as a function of potential.
|
pH 13 + NaCl |
|||||||
|
Reinforcement Type |
Bar Cond.** |
First 56 Days |
Second 56 Days |
Third 56 Days |
|||
|---|---|---|---|---|---|---|---|
|
PR,·Ohm·m2 |
CR, mA/m2* |
PR, Ohm·m2 |
CR, mA/m2* |
PR, Ohm·m2 |
CR,·mA/m2* |
||
|
Plain Carbon (Black) |
As-Recorded |
1.58 |
16 |
0.31 |
84 |
0.25 |
104 |
|
Hole |
0.77 |
34 |
0.37 |
70 |
0.33 |
79 |
|
|
Type 304 |
As-Recorded |
60.60 |
0.43 |
147.90 |
0.18 |
- |
- |
|
Hole |
40.31 |
0.65 |
121.70 |
0.21 |
- |
- |
|
|
Type 304 Clad |
As-Recorded |
68.91 |
0.38 |
32.67 |
0.80 |
15.26 |
1.70 |
|
Hole |
231.20 |
0.11 |
11.75 |
2.21 |
- |
- |
|
|
Abrade |
68.33 |
0.38 |
- |
- |
67.8 |
0.38 |
|
|
Nitronic 33 |
As-Recorded |
108.90 |
0.24 |
194.10 |
0.13 |
86.12 |
0.30 |
|
Hole |
- |
- |
54.60 |
0.48 |
222.4 |
0.12 |
|
|
Type 316 |
As-Recorded |
66.37 |
0.39 |
96.10 |
0.27 |
- |
- |
|
Hole |
95.60 |
0.27 |
116.90 |
0.22 |
- |
- |
|
* Calculated as CR = 0.026*1000/PR.
** Six mm diameter hole (through cladding in the case of clad
bars).
These authors also reported corrosion potential for various reinforcements based on tests in simulated pore water solutions and in Cl- contaminated concrete, as shown in figure 10, and reasoned that the +200 mVSCE control potential (figure 11) was an upper limit that should not be exceeded in service. As such, the thresholds at +200 mVSCE were projected as being conservative.
Comparable results were obtained by Bertolini et al. based upon both potentiodynamic polarization scans and potentiostatic tests at +200 mVSCE in solutions that simulated both alkaline and carbonated pore water.[37] Figure 12 reports their results as a listing of critical Cl- concentration for the different alloys that were investigated. A correspondence between cth and PRE/PREN is apparent, with the exception of the low carbon Type 304 and 316 stainless steels, for which relatively low thresholds are apparent. The reason for this is unclear.
Sorensen et al. performed potentiostatic exposures at 0 to +200 mVSCE using mortar prisms with Type 304 and 316 reinforcement and 0-8 percent admixed Cl- exposed in saturated Ca(OH)2 solution with 1 M NaCl.[38] Figure 13 shows the results for Type 304 stainless, both welded and unwelded, as a plot of anodic current density versus admixed Cl- concentration. The passive current density was in the range 10-1-10-2 mA/m2 for the unwelded stainless, or about 1 order of magnitude less than in aqueous solutions (see figures 8 and 9). The greater susceptibility of welded reinforcement to corrosion was attributed to air voids being entrapped at the irregular weld profile and to surface oxides. Enhanced surface roughness may also have been a factor.[39] Figure 14 presents data for these same specimens in a time-to-corrosion format.
Reduced performance for welded versus unwelded stainless steel was confirmed by experiments by Nürnberger et al., who performed preliminary potentiodynamic and subsequent, longer term potentiostatic tests upon both carbonated and uncarbonated mortar-coated austenitic and ferritic stainless steel specimens (welded and unwelded) as a function of admixed Cl- concentration.39 Figure 15 shows pitting potential data for their unwelded bars, including results for carbon steel specimens.
A = Austenitic
F = Ferritic
CS = Carbon Steel
Likewise, figure 16 compares these results with those for the welded condition. The trend is one where welding caused a relatively large reduction in Øcrit for the austenitic material but did not significantly impair performance for the ferritic or carbon steel specimens. This distinction presumably was a consequence of pitting susceptibility being relatively high in the ferritic and carbon steel, irrespective of whether or not these were welded.
Figure 17 attempts to interrelate cth data as reported by Sorensen et al. on a w/o cement basis for mortar specimens to [Cl-]/[OH-] assuming a 2:1 sand-to-cement ratio, 10 percent pore water, and OH- activity coefficient 0.7.[42] Also provided is the range of these two parameters (cth and [Cl-]/[OH-]) that has been reported historically for carbon steel in aqueous solutions or mortars (or both). The fact that the Sorensen et al. data include multiple values for the same material reflects the fact that different constant potentials were employed and cth decreased as potential was made more positive. The data suggest that cth for the stainless steel averaged about one order of magnitude greater than for carbon steel on a w/o cement basis, and from 1-2 orders of magnitude greater in terms of [Cl-]/[OH-].
Exposures in this category tend to span the gap between aqueous solution laboratory test cell experiments and actual field service structures. The accelerating features typically include relatively high w/c, low concrete cover, and frequent application of a concentrated salt solution under successive wetting and drying conditions.
Treadaway[40] and Treadaway et al.[41]] exposed concrete prisms reinforced with carbon steel, Types 405 and 430 (ferritic) stainless steels, and Types 304, 315, and 316 stainless steels outdoors in the United Kingdom for 10 years. Two mix designs were employed, one with an 8:1 aggregate:cement ratio, cement content 220 kg/m3, and w/c 0.75, and the second with parameters of 6:1, 290 kg/m3, and 0.60, respectively. Concrete cover was either 10 or 20 mm. Admixed Cl- concentration was as high as 3.2 percent (cement weight basis).
Figure 18 plots bar weight loss on an annual percentage basis versus admixed Cl- concentration for specimens with bars at both depths. This indicates that weight loss was highest for carbon steel and lowest for the Type 316 stainless steels. The other austenitics performed comparably. In general, corrosion rate increased with increasing Cl-, the effect being greatest for the carbon steel and minimal for the austenitics. In addition, corrosion intensity was greater for the lower cover steel and increased in proportion to the admixed Cl- concentration above 0.96 w/o. No explanation is apparent as to why the carbon steel exhibited higher corrosion rate with 0 compared to 0.32 and 0.96 w/o admixed Cl-. The ferritics performed satisfactorily at the lower Cl- concentrations, but suffered severe pitting at the higher concentrations.
Corrosion resistance of a ferritic stainless steels was also investigated by Callaghan and Hearn who exposed 12 w/o Cr reinforcement with 12 and 25 mm cover in relatively poor quality concrete prisms (no admixed Cl-) to a severe marine environment for 4.5 years.[42] Severe pitting occurred on reinforcement in companion black bar specimens, whereas attack on the stainless steels was minimal. The authors reasoned that the good performance of the ferritic stainless steels in their exposures, compared to that of Treadaway et al., resulted from chlorides not being admixed such that a more protective passive film formed.[41] It was concluded that such stainless steels may be the best choice for moderately aggressive environments.
McDonald et al. performed a series of exposures using double matted concrete slab specimens with a range of reinforcement types that included Types 304 and 316 stainless steels.[43] The average cement content and w/c were 370 kg/m3 and 0.47, respectively, and clear cover was 25 mm. The exposures involved 4 days wetting with 15 w/o NaCl at 16-27 ºC and 3 days drying at 38 ºC for 12 weeks, followed by 12 weeks of continuous ponding. The cycle then was repeated.
Average macrocell current density (anodic) on straight black bar control specimens during the 96-week tests, which was determined as the voltage drop across a 10 O resistor between the top and bottom bars, was 27.6 mA/m2, or 0.03 mm/year.[1] All specimens were cracked after 48 weeks. For specimens with straight and bent Type 304 SS reinforcement in both mats and with both cracked and uncracked concrete, macrocell current density was 0.016-0.039 mA/m2, or 0.0002-0.0005 mm/year. However, for sound slabs with black bottom bars, this current density was 8.8 mA/m2 (0.01 mm/year), and minor rust staining was apparent on the concrete surface. For cracked slabs with black bottom bars, current density was even higher at 20.8 mA/m2 (0.02 mm/year). No surface staining was noted on this last specimen type, nor for any Type 304 stainless steel reinforcements.
That Type 304 SS top reinforcement exhibited corrosion when coupled to black bottom bars is surprising, because it requires potential of the black bars minus voltage drop between the two mats to be more positive than Øcrit of the stainless steel. This finding contrasts with the results of Hope, who performed dual compartment aqueous exposures of stainless steel-black steel couples and concluded that these two reinforcement types could be mixed, provided concrete surrounding the black bars remained Cl--free.[44] Even if chlorides are present here, the black bars should corrode and provide galvanic cathodic protection to the stainless steel.
In contrast, macrocell corrosion rate for slabs with Type 316 stainless steel reinforcement was in the range 0.039-0.070 mA/m2 (0.0005-0.0009 mm/year), irrespective of the presence of a concrete crack or a black bar bottom mat. No rust staining or concrete cracking was noted.
Clemeña and Virmani reported results for 0.5 w/c concrete slabs that were exposed outdoors in Virginia to successive 3 days wet-4 days dry cycles using a saturated NaCl solution for 700 days.[45] Reinforcement types, which were both bent and straight, included carbon steel, Types 304, 316LN, and 2205 stainless steels, and Type 316 stainless steel clad bars. Clear cover over the reinforcement was 25 mm. Some of the clad bars contained two intentionally drilled 3 mm diameter holes that extended to the carbon steel core. Slabs for which the top bars were stainless steel and bottom bars were carbon steel were included. Researchers came to the following conclusions:
Rasheeduzzafar et al. also conducted outdoor exposures in eastern Saudi Arabia of concrete specimens reinforced with black, galvanized, ECR, and stainless clad reinforcing bars.[46] The mix design consisted of 390 kg/m3 Type V cement, w/c = 0.45, and admixed Cl- concentrations as NaCl of 2.4, 4.8, and 19.2 kg/m3. Clear cover was 25 mm. No details regarding the clad alloy were provided. After 7 years, the clad-reinforced slabs exhibited no indications of corrosion or cracking, whereas cracks were present in at least some of the slabs with each of the other reinforcement types.
Flint and Cox performed a series of seawater immersion and tidal exposures on concrete specimens with partly embedded Type 316 SS for up to 12.5 years.[47] This study focused on the possibility of crevice corrosion at the steel-concrete interface. Such attack was negligible but with some corrosion occurring at the steel-concrete-seawater interface, as has been reported to be particularly significant in the case of carbon steel reinforcement.[48]
Several authors have conducted experimental programs that involved various combinations of aqueous solution, mortar-coated, and concrete embedded exposures. Among these are the tests of Darwin et al., who employed a two-compartment galvanic cell with simulated pore solution and mortar chunks in both compartments and 1.6 molal NaCl in one and no Cl- in the other.[49] In one set of tests, bare or uncoated specimens were employed; in a second set of tests, the specimens were mortar coated. In a third set, both sound and cracked macrocell-type concrete slab specimens were subjected to the Southern Exposure protocol.[50] Results were reported in terms of corrosion rate as determined from macrocell current, rather than cth, with the stated reason being that the latter parameter is achieved quickly in the vicinity of concrete cracks, such that all reinforcement types are likely to corrode at these locations. This rationale may be appropriate for some, but not all, types of reinforcement.
Figure 19 shows typical results for mortar-coated, aqueous solution exposed specimens during the 15-week period. Generally, corrosion rates were approximately constant after about week 10. On this basis, the long-term corrosion rate of black steel was highest. The rate for MMFXTM was approximately a factor of 2 less, while that for 2201 (unpickled) was less an additional factor of 2. In contrast, corrosion rates for 2201P (pickled), 2205, and 2205P (pickled) were typically 0.1 mm/year (0.086 mA/m2) or less. Also, although there was no significant distinction between the corrosion rates for 2205 and 2205P, the rate for 2201 exceeded that for 2201P.
Figure 20 shows the average corrosion rate for the different reinforcement types during 48 weeks of Southern Exposure. These data are qualitatively consistent with those from the mortar-coated tests, although steady state appears to have been reached for the more active metals in the case of Southern Exposure; but it is unclear that this was always so for the mortar coated specimens. Corrosion rate for the stainless steels was consistently 2-3 orders of magnitude less than for the actively corroding reinforcements. Also, alloys that performed well apparently remained passive, irrespective of test condition.
As noted above, there was a difference in performance for 2201 SS but not 2205 SS in the aqueous exposures, depending on surface treatment (as-received versus pickled). Unpickled specimens were not included in the Southern Exposure concrete specimens, so no such comparison is possible here. This distinction between specimens with the two preparation methods apparently resulted because surface penetrating nonmetallic inclusions or iron/steel particles from handling equipment became embedded and corroded (or both). This leaves surface irregularities that, for metals with relatively low passivation tendency in a sufficiently high Cl- concentration electrolyte, can result in pit initiation according to the mechanism described above.
Figure 21 compares corrosion rates for the different environments investigated by Darwin et al. and indicates that these increased generally in proportion to the anticipated conductivity of the electrolyte (highest corrosion rates in the aqueous solution and lowest in sound concrete).[53] Comparisons here should be made with caution, however, because bars with little or no tendency for passivation (black steel) were apparently active upon initial exposure, whereas bars with an intermediate passivation tendency apparently either activated slowly, or active corrosion spread progressively with time. On this basis, the low resistivity electrolyte test conditions with high initial Cl- failed to provide due credit for a corrosion initiation period, which may be extensive. As such, the aqueous exposures provide information on which different reinforcements can be ranked, but do not facilitate life-prediction modeling. This rationale disregards the presence of mortar or concrete cracks, however. If (1) chlorides accumulate rapidly at the base of these cracks, (2) the resulting corrosion initiates early in the structure's life cycle, and (3) this corrosion controls service life, then the data can be viewed as applicable.
General
Data for several relatively unique corrosion-resistant alloys (in addition to the standard ferritic, austenitic, and duplex SSs) were represented in some of the assessments discussed above. These include Nitronic 33, MMFX, 3Cr12TM, and clad SS. Each of these is discussed in greater detail below.
Nitronic 33
Limited data for Nitronic 33, which conforms to American Society for Testing and Materials (ASTM) Specification A580, Grade XM-29, were reported above in conjunction with tables 3 and 4 and figure 8. In addition, Jenkins reported the results of laboratory aqueous exposures and field evaluations.[51] This alloy is of particular interest to the U.S. Navy because of its nonmagnetic properties in addition to relatively good corrosion resistance and high strength. Nominally, the composition of Nitronic 33 is 18 percent Cr, 12 percent Mn, and 3.5 percent Ni. The material tested by Jenkins had a yield strength of 800 MPa. Potentiodynamic polarization scans in aqueous solutions indicated a full range of passivity for pH = 12.1, 11.6, and 11.2 and Cl- concentrations of 0-6,000 parts per million (ppm). At pH 10.0, full passivity was exhibited at a Cl- concentration of 2,000 ppm, but at 6,000 ppm, Øcrit was +100 mV (reference electrode not stated). The program also involved evaluating driven piles that were placed at the Port of Tacoma, WA. No Nitronic 33 corrosion activity was detected, although age of the pilings was only 17 months when measurements were taken.
MMFX
Within the past several years, a proprietary alloy, initially designated as MMFX (subsequently MMFX-I and then MMFX-II), has been marketed as a CRR alternative for concrete bridge deck service. Composition is nominally that of low carbon steel but with 9-10 w/o Cr. As such, it does not meet the classification of stainless steel, because a minimum of 12 w/o Cr is required for this designation. Nonetheless, such a Cr amount may contribute to enhanced corrosion resistance compared to carbon steel. Mechanical strength of MMFX exceeds that of conventional reinforcement. For example, Darwin et al. determined the average 0.2 percent offset yield strength, tensile strength, and elongation for 5 specimens in each of 3 heats as 910 MPa, 1139 MPa, and 7.1 percent, respectively.[52]
Corrosion resistance of this steel is ascribed to a special thermomechanical treatment that yields a microstructure comprised of packet martensite and nanosheets of untransformed austenite. This is stated to reduce or eliminate microcells that otherwise cause corrosion. However, microcells invariably exist irrespective of microstructure. Also, it is unclear why microcells should necessarily be a factor in bridge deck service where corrosion, once initiated, is controlled predominantly by macrocells. It can be reasoned that the MMFX microstructure may have a reduced exchange current density for the oxygen or hydrogen reduction reactions (or for both), in which case reduced corrosion rate could result. Corrosion data for MMFX, as reported by Darwin et al., were indicated above in conjunction with figures 20 and 21, where a reduced rate compared to carbon steel by a factor of 2-3 is apparent.[53] In addition, Lopez conducted salt fog exposures of MMFX specimens to 1,000 hours using 5 w/o NaCl and a repetitive 1-hour fog (ambient temperature)-1-hour dry (35 ºC) cycle; the results are shown in figure 22.[53] While the data scatter is relatively large, corrosion rate of the MMFX was, on average, 44 percent less than for the carbon steel. It should be interesting to determine via parallel experiments if corrosion performance of MMFX in concrete service affords any advantage compared to 12 w/o Cr ferritic SSs (see below).
Also of concern is the relatively high strength of MMFX compared to carbon steel reinforcement. Based on concrete beam tests, Ansley concluded that designers using MMFX reinforcement should consider detailing and the lack of a distinct yield point for this material.[54] Ansley also indicated that lap splices and hook elements that are adequate for Grade 60 reinforcement may be insufficient with MMFX.
Proprietary Ferritic Stainless Steels
Ferritic stainless steels, designated as 3Cr12 and CRS 100, with approximately 12 w/o Cr are being produced as reinforcement. The composition of these is essentially the same; the 3Cr12 conforms to European Standard EN 10088 Grade 1.4003. These are relatively low-cost alternatives to Types 304 and 316 and may prove suitable choices for moderate, although probably not severe, chloride exposures.
Clad Stainless Steel
Bars of this type are potentially available from two suppliers. Both employ Type 316 stainless steel as the cladding and innovative manufacturing technologies. One company packs a stainless tube with carbon steel scrap and hot rolls this into reinforcing bars. This production method allows any cladding alloy to be employed instead of 316 SS, with cost varying accordingly. The other company plasma-coats steel billets and then rolls these. The plasma method lacks the flexibility of the first method, because the technology is relatively insensitive to clad material cost.
Several of the evaluation programs noted above included clad SS reinforcement.[39, 48] As such, clad bars potentially afford the corrosion resistance of the SS cladding but at a reduced cost compared to solid SS bars. Concerns include corrosion at cut ends where the carbon steel core is exposed and corrosion at cladding defects. On one hand, the relatively small anode-to-cathode area ratio that is likely to accompany clad defects or exposed bar ends should facilitate such an attack. On the other hand, stainless steels serve as a relatively poor catalytic surface for the cathode reaction, as revealed by the experiments of Sorensen et al., who performed potentiodynamic polarization scans and determined that the current density at -700 mVSCE was 9 ±2 mA/m2 for Type 304 SS, 31 ±11 mA/m2 for Type 316, and 143 ±68 mA/m2 for carbon steel.42
Cui and Sagüés[55,56] and Clemeña and Virmani[49] both exposed concrete specimens containing SS clad reinforcement, where holes had been drilled intentionally through the cladding to the carbon steel core. In the Cui and Sagüés experiments, the concrete was admixed with either 5 or 8 w/o Cl- (cement weight basis) and exposed indoors under ambient laboratory conditions or at 40 ºC and 100 percent relative humidity. Clemeña's and Virmani's experiments were wet-dry cyclic ponded with a saturated NaCl solution, as noted above. Cui and Sagüés measured corrosion activity at the clad defect sites, although the magnitude of this tended to moderate with time in some cases. This finding that corrosion moderated with time was attributed to progressively developing corrosion products.
Companion numerical modeling results were in general agreement with the experimental findings, and predicted that corrosion rate should increase with increasing defect size and decrease with increasing concrete resistivity. For a 1 mm diameter clad break and 30 kO·cm concrete, corrosion rate was projected as approximately 14 mA/m2 (0.18 mm/year). Clemeña and Virmani, however, reported no electrochemical indications of corrosion on their clad bars with defects after 700 days' exposure.[49] This could have resulted because their specimens contained no admixed chlorides, such that time was provided before chlorides arrived at the steel depth for the passive film to stabilize. Clearly, more experimental information is needed before definitive conclusions can be reached regarding the importance of exposed carbon steel core material.
While there has been only limited utilization of CRR in concrete construction to date, a small inventory of such structures does exist, nonetheless. These can provide information that can be used to develop a database of experience. A summary of these structures is provided below.
Progresso Pier
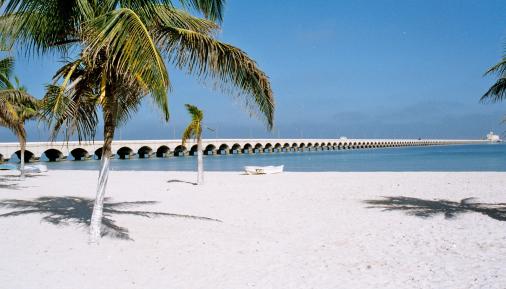
Probably the best example of stainless steel reinforced concrete structures in aggressive, Cl- environments is the 1,752-m long pier at the Port of Progreso de Castro in Yucatán, Mexico. Constructed between 1939-1941, the pier is now more than 60 years old. Approximately 200,000 kg of 30 mm diameter, nondeformed Type 304 SS was employed. The pier consists of 146 12-m span hinged arches, each of which is supported at the ends by reinforced girders positioned on massive nonreinforced concrete piles. Figure 23 shows a general photograph of the pier.
Several inspections and evaluations of the pier condition have been performed during the past decade.[57, 58] These have indicated no visible signs of deterioration, despite the fact that no maintenance apparently has been performed. Figure 24 shows a photograph of two arches and piling and reveals the generally good condition of the structure. It has been determined that the concrete is of relatively poor quality with a w/c of 0.50-0.70, porosity 19-24 percent, and resistivity 0.6-2.5 kO·cm. Based on acid soluble analyses of samples from two cores, Cl- concentration at the bar depth (78 mm) was determined as 1.2 w/o concrete. This, coupled with the tropical marine environment, constitutes severe exposure conditions for the reinforcement. In the most recent inspection, no corrosion stains or corrosion-induced cracks were observed along the entire structure.[61] However, stress corrosion cracking (SCC) was stated to have affected exposed bent end hooks. Occurrence of SCC in Type 304 SS in near-neutral or alkaline Cl- environments at ambient temperatures is unexpected and warrants further investigation. Also, severe localized corrosion was noted at a location where the reinforcement had been exposed previously. Figure 25 provides a photograph of this damage.
Detroit, MI (Interstate (I)-696 over Lenox Road)
As a part of this bridge construction project, Type 304 SS reinforcement was placed in the eastbound lanes in 1984, and ECR was used in the westbound lanes. During an inspection in 1993, cores were removed from the eastbound lanes to assess the concrete and reinforcement. Three of the cores contained 16 mm diameter reinforcement. No concrete cracking that could be attributed to corrosion was noted, neither on the bridge generally nor in the cores. Minor corrosion staining in conjunction with a noncorrosion-related crack was apparent on one of the extracted bar sections. Acid soluble Cl- determinations at the reinforcement depth (75-165 mm) indicated values of 0.54, 0.26, and 0.22 w/o cement (0.078, 0.037, and 0.032 w/o concrete) for the three cores, which is near the threshold for black steel. The inspection and analysis results are described in greater detail elsewhere.[59]]
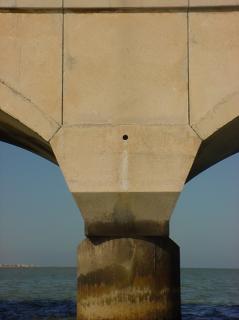 Figure 24. Photograph of hinged arches and piling. |
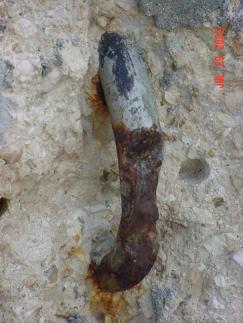 Figure 25. Corrosion of an exposed reinforcing bar. |
Trenton, NJ (I-295 over Arena Drive)
The northbound and southbound bridges for this project were constructed in 1983-1984 using ECR in the northbound bridge and Type 304 clad SS from a source in England in the southbound bridge. The design employed steel girders, stay-in-place metal decking, a reinforced concrete bridge deck, and a 25-37 mm latex-modified concrete overlay. During an inspection in 1993, minor delamination of the overlay was detected in some locations.[59] Four cores, two from delaminated and two from sound locations, containing a total of nine clad SS segments, were acquired. No corrosion was apparent on any of these, except beneath a plastic capped cut bar end where the carbon steel core was exposed. This attack was attributed to a low pH environment that developed here, such that passivity was not maintained. No adhesive had been used in conjunction with placing the cap. Acid soluble Cl- concentration at the steel depth (50-62 mm including overlay) was low and in the range 0.009-0.013 w/o concrete.
Ontario, Canada
In 1996, a 21-m long, single-span bridge was constructed as a demonstration project on Highway 407 over Mullet Creek in Ontario, Canada. The two-lane structure consists of a 235-mm thick concrete deck slab reinforced with 11,000 kg of Type 316LN SS in both mats at a design cover for the upper mat of 80 ±20 mm on prestressed concrete I-beams. Probes were installed for corrosion monitoring purposes. The SS was shipped in coils that subsequently were straightened using conventional carbon steel equipment. This resulted in iron embeddments that were visually unappealing but did not compromise performance. Inspections performed within the first year of construction revealed corrosion potentials for the reinforcement in the passive range (-0.26 VCSE with standard deviation 0.06). Minor shrinkage cracks were disclosed on parapet walls but with none on the deck.[60]
In 1998, the Ontario Ministry of Transportation (OMT) established a policy that the top mat of 400 series bridges (100,000 or more vehicles per day) and all barrier walls would be stainless steel. Requiring this for the top mat only was based on a research study that showed no occurrence of corrosion for black steel electrically connected to Types 316LN or 2205 stainless steels, as long as chlorides were not present at the black steel.[61]
In conjunction with the above policy, OMT constructed a two-lane, three-span, continuous 225-mm thick by 37.5-m long concrete deck on galvanized steel plate girders bridge on Highway 9 over the South Holland Canal in Ontario, Canada, in 1999 using Type 316L stainless steel clad bars as the top mat. Despite bar quality control and delivery schedule issues, researchers concluded that the use of this reinforcement type is viable.[62]
Footnote
[1] This review
employs the units used by the original authors. The following
conversions may be used for converting between the different
units:
1 mA/m2 = 0.1 µA/cm2
= 0.011 mm/year = 11.5 µm/year = 0.43 mils/year.

