U.S. Department of Transportation
Federal Highway Administration
1200 New Jersey Avenue, SE
Washington, DC 20590
202-366-4000
Federal Highway Administration Research and Technology
Coordinating, Developing, and Delivering Highway Transportation Innovations
| REPORT |
| This report is an archived publication and may contain dated technical, contact, and link information |
|
| Publication Number: FHWA-HRT-12-054 Date: December 2012 |
Publication Number: FHWA-HRT-12-054 Date: December 2012 |
Georgia State University conducted a motorist survey for GDOT. The report, 2006 Motorist Survey Pilot Statewide Results, describes the survey methodology, questions, and results.(35) While the survey primarily concentrates on performance, it also considered the importance of various physical and operational improvements. This appendix provides some of the material relevant to ITS evaluations.
Figure 73
and
figure 74
show traffic flow performance ratings for freeways, and
figure 75
and
figure 76
show these ratings for non-freeway routes. Results are also provided in the
report for each GDOT district.
Figure 77
illustrates the priorities chosen by survey respondents, and
figure 78
presents performance versus importance that may assist in resource allocation.
 survey question, \"How would you grade GDOT's performance in terms of managing traffic flow and congestion? (Results weighted to normalize district representation).\" A scale of 0 to 4 is shown, with 0 being an \"F\" grade and 4 being an \"A\" grade. The results are as follows: electronic messages sings: 2.9, sufficient travel lanes-off-peak: 2.8, responding to incidents: 2.8, predictable travel times: 2.6, reasonable travel times: 2.4, minimizing delays at work zones: 2.1, and sufficient travel lanes at peak times: 1.9.")
Figure 73. Illustration. Interstate traffic flow scores.
 survey question, \"How would you grade GDOT's performance in terms of managing traffic flow and congestion? (Results weighted to normalize district representation).\" A scale of 0 to 4 is shown, with 0 being an \"F\" grade and 4 being an \"A\" grade. Results are as follows for scores A, B, C, D, and F: electronic messages signs: 29.7, 42.3, 19.7, 6.2, and 2 percent, respectively; sufficient travel lanes-off-peak: 22.9, 43.5, 24.5, 6.5, and 2.5 percent, respectively; responding to incidents: 20.8, 46.4, 23.7, 6.3, and 2 percent, respectively; predictable travel times: 14.7, 43.5, 28.2, 9.4, and 4 percent, respectively; reasonable travel times: 12, 40.4, 30.6, 11.4, and 6 percent, respectively; minimizing delays at work zones: 7.9, 29.3, 34.7, 19.4, and 9 percent, respectively; and sufficient travel lanes at peak times: 7.8, 27.3, 30.1, 21.4, and 14 percent, respectively.")
Figure 74. Illustration. Distribution of interstate traffic flow scores.
 survey question, \"How would you grade GDOT's performance in terms of managing traffic flow and congestion? (Results weighted to normalize district representation).\" A scale of 0 to 4 is shown, with 0 being an \"F\" grade and 4 being an \"A\" grade. Results are as follows: sufficient travel lanes-off-peak: 2.6; predictable travel times: 2.5; responding to incidents: 2.5; reasonable travel times: 2.4; electronic messages signs: 2.3; minimizing delays at work zones: 2.1; and sufficient travel lanes at peak times: 1.9.")
Figure 75. Illustration. Non-interstate traffic flow scores.
 survey question, \"How would you grade GDOT's performance in terms of managing traffic flow and congestion? (Results weighted to normalize district representation).\" A scale of A, B, C, D, and F is shown with the following results: sufficient travel lanes-off-peak: 15.6.9, 45.5, 27.7, 8.4, and 3 percent, respectively; predictable travel times: 12.8, 42.9, 31.6, 8.4, and 4 percent, respectively; responding to incidents: 14, 41.7, 31.8, 9, and 4 percent, respectively; reasonable travel times: 10.5, 40.8, 32.6, 10.8, and 5 percent, respectively; electronic messages signs: 14.9, 32.3, 30.3, 13.8, and 9 percent, respectively; minimizing delays at work zones: 6.3, 30.6, 36.8, 18.2, and 8 percent, respectively; and sufficient travel lanes at peak times: 6.1, 26.9, 33.9, 21.1, and 12 percent, respectively.")
Figure 76. Illustration. Distribution of non-interstate traffic flow scores.
 survey question, “Please choose the five options from the list below that you feel should be of the highest priority for GDOT. n = 3.720.” A scale is shown with highest priority, second, third, fourth, fifth, and none. The results for highest, second, third, fourth, fifth, and none are as follows: maintain existing highways: 31.6, 18.2, 12.7, 8.7, 6.9, and 22 percent, respectively; improve safety: 28.5, 17.7, 11.1, 8.8, 8.6, and 25.4 percent, respectively; add more lanes to State routes: 20.7, 21.3, 15.1, 9.7, 7.6, and 25.6 percent, respectively; build new highways: 25.2, 16.6, 11.6, 9.0, 8.4, and 29.1 percent, respectively; add more lanes to interstates: 28.3, 17.0, 11.4, 6.2, 7.1, and 30.0 percent, respectively; add passing lanes: 16.4, 17.6, 14.0, 9.9, 6.1, and 36.0 percent, respectively; improve traffic signalization: 16.5, 15.1, 13.0, 8.8, 6.1, and 40.4 percent, respectively; increase coverage of High-Emergency Response Operators (HERO) program: 16.0, 13.9, 12.7, 7.9, 7.7, and 41.7 percent, respectively; add more high-occupancy vehicle and truck lanes: 17.3, 12.3, 10.8, 8.7, 7.9, and 43.1 percent, respectively; add sidewalks along roads: 10.5, 8.6, 9.8, 9.0, 15.8, and 46.4 percent, respectively; and add interstate message boards: 9.1, 11.2, 12.6, 9.1, 8.4, and 49.6 percent, respectively.")
Figure 77. Illustration. Motorist priority rankings.
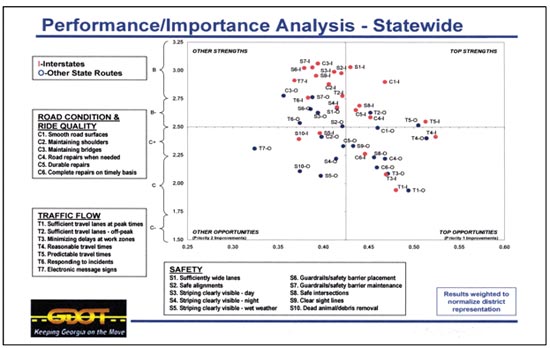
Figure 78. Illustration. Performance versus importance plot.

