U.S. Department of Transportation
Federal Highway Administration
1200 New Jersey Avenue, SE
Washington, DC 20590
202-366-4000
Federal Highway Administration Research and Technology
Coordinating, Developing, and Delivering Highway Transportation Innovations
 |
| This report is an archived publication and may contain dated technical, contact, and link information |
|
Publication Number: FHWA-HRT-04-091
Date: August 2004 |
||||||||||||||||||||||||||||||||||||||||||||||||||||||||||||||||||||||||||||||||||||||||||||||||||||||||||||||||||||||||||||||||||||||||||||||||||||||||||||||||||||||||||||||||||||||
Signalized Intersections: Informational GuidePDF Version (10.84 MB)
PDF files can be viewed with the Acrobat® Reader® CHAPTER 2 — ROAD USER NEEDSTABLE OF CONTENTS
2.2.1 Human Factors Common to All Road Users LIST OF FIGURES
LIST OF TABLES
2.0 Road User NeedsThe purpose of this chapter is to describe road user needs. The description is based on three assumptions:
A discussion of user needs requires an understanding of human factors principles for all intersection users. This chapter begins with an overview of human factors research and is followed by a description of user needs for motorists, pedestrians, and bicyclists. The chapter concludes with a discussion of applying human factors principles to the planning, design, and operation of signalized intersections. Documents marked with an asterisk in the reference list provide additional coverage of user needs and human factors and helpful background reading. 2.1 Overview of Human FactorsHuman factors research deals with human physical, perceptual, and cognitive abilities and characteristics and how they affect our interactions with tools, machines, and workplaces. The goal of human factors analysis in road transportation is to:
At signalized intersections, the application of human factors principles to the problems of safety and efficiency requires an approach that is both systems oriented and human-centered. A systems approach recognizes the interaction between the road user and road/roadway environment. This acknowledges that no one element can be analyzed and understood in isolation. A human-centered approach recognizes road users as the operative element within the system-the decisionmakers and focuses the engineering effort on optimizing their performance. Human factors analysis, particularly as it relates to any element of the transportation system (including signalized intersections), includes the following tasks:
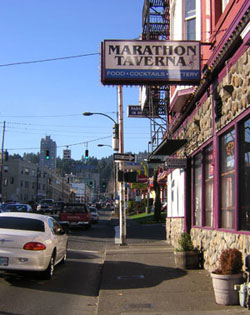
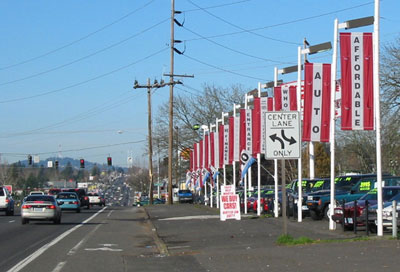
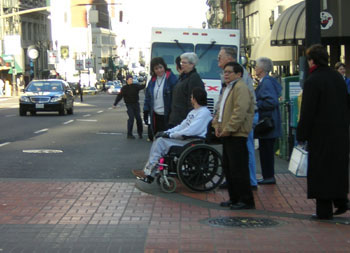
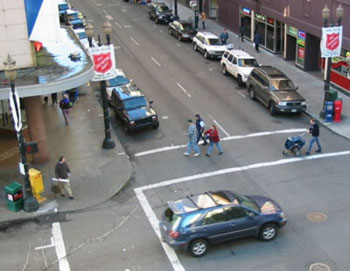
Signalized intersections serve a variety of road users, chiefly motorists, bicyclists, and pedestrians. Within each road user group, there are multiple user types. For example, motorists include passenger car and commercial truck drivers. Bicyclists include recreational and commuting bicyclists, as well as a wide range of ages and abilities. Pedestrians include all age groups (children, adults, elderly), some of whom have cognitive, mobility, or vision impairments. Each road user has unique abilities and characteristics, all of which need to be considered in the design of an intersection. The basic function of signalized intersections is to sequence right-of-way between intersecting streams of users. These intersections thus serve multiple functions: they allow motorists to access new streets and change directions in travel; they are junctions for bike routes; and they provide a primary connection to and from activity centers for pedestrians. Intersections also serve as public right-of-way and include space for public utilities such as power and communication lines; water, sanitary sewer, and storm drainage pipes; and traffic signs and signal equipment. Each road user has specific needs traversing an intersection. Motorists and cyclists must detect the intersection on approach, assess its relevance from a navigational perspective, respond to the applicable traffic controls, and negotiate the intersection. In a similar manner, pedestrians must identify the crossing location, maneuver to and position themselves accordingly at the crossing, activate a crossing device, and respond appropriately to the traffic controls. All users must remain vigilant for potential conflicts with other road users. Under ADA, all people, including those with disabilities, have the right to equal access to transportation.(7) Designing facilities that cannot be used by people with disabilities constitutes illegal discrimination under the ADA. Designing safe and usable facilities demands an understanding that persons with disabilities have varying abilities, use a variety of adaptive devices, and may have multiple impairments. Road users are limited in the amount of information they can process. For vehicle drivers and bicyclists, the pace at which information is encountered increases with travel speed. The number of choices facing drivers and bicyclists at any one time should be minimized, and information presented should be concise, complete, explicit, and located sufficiently in advance of the choice point to allow for a comfortable response. 2.1.1 Positive GuidanceIn the 1980s, FHWA's office of Human Factors brought forth a series of documents advocating the explicit application of human factors-based knowledge in the design of roadways and in the design, selection and application of information presentations targeted at vehicle users.(8) Termed positive guidance, the concept focuses on understanding and making allowances for how road users primarily motorists acquire, interpret, and apply information in the driving task. Key concepts are those of driver expectation, expectancy violation, primacy, and road user error. Positive guidance places the driving task within the framework of a road environment viewed as an information system, where the driver is the operative element. The roadway, with its formal and informal sources of information, becomes the input. The vehicle, controlled by the driver, becomes the conduit for output. The driving task itself is subdivided into three performance levels: control, guidance, and navigation, each oriented in decreasing order of primacy and increasing order of complexity. Positive guidance is founded on a simple concept: if drivers are provided with all of the information they need, in a format they can readily read, interpret and apply, and in sufficient time to react appropriately, then the chances of driver error will be reduced, and relative safety will be improved. Uniformity in the design and context of application of information presentations is a key component of positive guidance. Information presentations must work within the roadway information system to reinforce driver expectations that are correct and restructure those that are not. They must provide the information necessary to support rapid decisionmaking while minimizing the potential for driver error. Strict interpretation of the positive guidance concept implies telling the driver what he or she needs to know and nothing else. In practical application, positive guidance suggests that competition for driver attention, the presence of information irrelevant to driving-related tasks, as well as exceeding the information-processing limitations of drivers, may have a negative impact on relative safety. This road user-based approach to information presentation is the foundation of state-of-the-art information presentation policies, standards and guidelines, including FHWA's MUTCD.(1) However, a growing body of research is suggesting that redundancy in message delivery systems may in fact improve the efficiency, safety, and/or usability of a facility. For example, pedestrians tend to begin their crossing more quickly if an audible prompt accompanies the visible pedestrian signal indication. There is always a risk that some users will miss or be unable to receive information that relies on only one sense (e.g., sight). 2.1.2 Roadway SafetyIn the past, roads were considered to be "safe" if they were designed, built, operated, and maintained in accordance with nominal standards. These standards were usually based on empirical data or long-standing practice. Collisions were viewed as an unavoidable outcome of the need for mobility and the inevitability of human error. When human errors resulted in collisions, the fault was perceived to lie with the road user, rather than with the road. The approach to roadway safety has since evolved. In the explicit consideration of roadway safety, safety itself is now recognized to be a relative measure, with no road open to traffic being considered completely "safe"—only "more safe" or "less safe" relative to a particular benchmark, as defined by one or more safety measures. While the concept of "road user error" remains, it is now understood that errors and the collisions that result don't just "happen," they are "caused," and that the roadway environment often plays a role in that causation. In the institute for Transportation Engineers (ITE) Traffic Safety Toolbox: a primer on Traffic Safety, Hauer refers to nominal safety as compliance with standards, warrants, guidelines and sanctioned design procedures, and substantive safety as the expected crash frequency and severity for a highway or roadway.(9) The concept of the "forgiving" roadway—one that minimizes the consequences of road user error by designing out or shielding hazards-has more recently given way to the "caring" roadway. The caring roadway combines all of the forgiving features of its predecessor (crash cushions, clear zones, etc.) with elements that respond to driver capabilities, limitations, expectations, and information needs. The caring roadway seeks to create an operating environment that is user-friendly and simplifies the information presented to the driver, a roadway that is conducive to rapid, error-free performance by the road user. By attacking the environmental and situational elements that contribute to the occurrence of driver error, the caring roadway seeks to break the chain of causation between the erroneous decisions and/or actions, and their undesirable outcomes (e.g., crashes). The caring roadway concept is largely information driven. It is predicated on meeting the expectations of road users motorists, bicyclists, and pedestrians and assuring that they get needed information, when it is required, in an explicit and usable format, in sufficient time to react. Implicit in the caring roadway approach is that the information-processing capabilities of users must at no time be overtaxed, by either an overabundance of potentially relevant information, or by the additive presence of information not immediately relevant to the task of negotiating the roadway. 2.2 Intersection UsersKnowing the performance capabilities and behavioral characteristics of road users is essential for designing and operating safe and efficient signalized intersections. All road users have the same human factors, no matter how they use the road. For example, older drivers, older pedestrians, and people with visual disabilities all frequently share the characteristic of longer reaction times. The following section discusses human factor issues common to all road users, followed by a discussion of issues specific to motorists, bicyclists, and pedestrians. 2.2.1 Human Factors Common to All Road UsersThe task of traveling on the roadway system, whether by motor vehicle, bicycle, or foot, primarily involves searching for, finding, understanding, and applying information, as well as reacting to the appearance of unanticipated information. Once found and understood, the relevance of this information must be assessed, and decisions and actions taken in response. This activity is cyclic, often occurring many times per second in complex, demanding environments. The capabilities of human vision, information processing, and memory all affect a road user's ability to use an intersection, and these may affect the likelihood of user error. Age plays a role in all of these factors. The following sections discuss each of these factors. Human VisionRoad users receive most of their information visually. The human visual field is large; however, the area of accurate vision is quite small. drivers, for example, tend to scan a fairly narrow visual field ahead of them. Drivers do not dwell on any target for long; studies indicate that most drivers become uncomfortable if they cannot look back at the roadway at least every two seconds.(10) This means that information searches and the reading of long messages is carried out during a series of glances rather than with one long look. Complex or cluttered backgrounds, such as that shown in figures 1 and 2, make individual pieces of information more difficult to identify and can make the driving task more difficult. Looking at irrelevant information when it is not appropriate to do so may cause drivers to overlook relevant information, or fail to accurately monitor a control or guidance task. This is of particular concern in areas of high workload, at decision points, and at locations where there is a high potential for conflict (e.g., intersections and crosswalks).
Information processingRoad users perform best under moderate levels of demand. Overload or underload tends to degrade performance. Consider the example of driving. The presentation of information in circumstances of low driving-task demand is commonly assumed to avert boredom; however, this assumption is untested. During periods of high task demand, however, it is known that the duration of drivers' glances at signs become shorter, as more time is needed to accommodate control and guidance tasks, and less is available for reading signs. Extra effort should be made to limit information presentations to those immediately relevant to the driving task where circumstances of high workload are apt to occur. Road users are adept at recognizing patterns—clues as to what is upcoming—and using those clues, along with expectations, to anticipate and prepare for situations similar to those experienced before. When things turn out as expected, performance is often rapid and error-free. When expectations are violated, surprise results, and new information must be gathered so the user can rethink a response. Adherence to uniform principles of information presentation in the design and application of traffic control devices and managing the overall information load placed on road users is vital to ensure that the users get the information they need, when they need it, in a form that they can recognize and understand, in time to perceive and react to it in an appropriate manner. MemoryHumans have a limited short-term memory. Only a small percentage of what they see is actually remembered, including information presentations viewed while driving, cycling, or walking. Long-term memory is made up of experiences that have been ingrained through repetition. These are the source of our expectations. Expectations play a strong role in the performance of all road users. Information about an upcoming condition or hazard should be proximate to its location, or repeated at intervals for emphasis. User ErrorThere is a common belief that the risk of user error is increased when needed information:
Information presentations must be conspicuous, legible, readable at a glance, and explicit as to their meaning. Uniformity and consistency are paramount. For example, drivers must receive the same clues and information in similar situations so that their expectations will be consistent with reality, or their expectations will be restructured accordingly. The presentations must be located in advance, to provide time to react, and they must be spaced—both from each other and from other competing sources of information—so as not to confuse or overload the road user. Drivers in particular often have difficulties in following through the sequence of driving tasks, which leads to driving errors. The most common driving errors include improper lookout (faulty visual surveillance), inattention, false assumption, excessive speed, improper maneuvers, improper evasive action, and internal distraction.(11) Cyclists can also have similar difficulties. These errors often result from:
In summary, the engineer should be aware of road users and their needs and limitations with regard to signalized intersections. Information displayed in advance of and at the intersection needs to be consistent, timely, legible, and relevant. Awareness of how human factors play a role in the task of using the intersection will go a long way toward reducing error and the collisions this may cause. AgeAge and experience have a significant effect on the ability of drivers, cyclists, and pedestrians to use an intersection. For example, young drivers have a quicker perception and reaction time yet often lack the judgment to perceive something as being hazardous, something only experience can teach a driver. In contrast, older drivers have the experience yet may lack the perception and reaction time.(12) According to the FHWA Highway Design Handbook for Older Drivers and Pedestrians, half of fatal crashes involving drivers 80 or older took place at intersections.(12) This document also points to a large body of evidence showing higher crash involvement among older drivers, particularly with crash types that require complex speed-distance judgment under time constraints, such as a left-turn against oncoming traffic. As one ages, specific functions related to the driving task may deteriorate, such as vision, hearing, sensation, and cognitive and motor abilities. Peripheral vision and a decreased range of motion in an older person's neck may limit their ability to attend to a traffic signal while searching for a gap in traffic when making a left turn. Sorting out visual distractions at intersections can be difficult. Cognitive changes require that older drivers need more time to recognize hazards and respond. It would also appear that driving situations involving complex speed-distance judgments under time constraints as found at many signalized intersections are problematic for older drivers and pedestrians. The following specific tasks were reported as being problematic for older road users:
Little research has been done on the performance and needs of young and inexperienced drivers at signalized intersections. Young drivers aged 16 to 24 have a higher risk (2.5 times) of being involved in a collision compared to other drivers. Young pedestrians (i.e., pedestrians under the age of 12) also have a higher risk of being in a collision. These users may:
2.2.2 MotoristsMotorists account for by far the most number of trips taken on roads. There are more than 225 million licensed vehicles in the United States.(13) Traffic engineers have traditionally sought to design and operate intersections with the typical driver in mind, trying to best accommodate their needs in terms of their ability to perceive, react, and safely navigate through an intersection. This being so, bicyclists and pedestrians are often at a disadvantage at many intersections. Road users drivers , bicyclists, and pedestrians are not homogeneous in their characteristics, and traffic engineers must be conscious of the need to design for a range of human characteristics and responses. Specific subgroups of drivers may have an elevated risk of being involved in a collision (e.g., teenaged drivers, older drivers, and aggressive drivers). Most drivers traveling through signalized intersections will be operating passenger vehicles. These may be cars, but in ever-increasing numbers they are minivans, pickups and sports utility vehicles. More than 22,000 fatal collisions in the United States each year involve passenger vehicles.(14) However, commercial vehicles (tractor-trailers, single-unit trucks, and cargo vans) account for more than their share of fatal collisions, based on fatal crash rates per mile.(15) These vehicles need to be properly accommodated at intersections. Vehicle acceleration from a stationary position, braking distances required, safe execution of a left or right turn, and provision of adequate storage in turning lanes are important items that should be considered. Table 4 identifies general characteristics of vehicle types, and table 5 shows the frequency of fatalities and injuries by mode. Table 4. Estimated number of registered vehicles by type, 2002.
Source: Bureau of Transportation Statistics, 2002.(16)
Table 5. Fatalities and injuries by mode, 2001.
1 Includes single-unit trucks, truck tractors, pickups, vans, truck-based station wagons, and utility vehicles. Source: Bureau of Transportation Statistics, 2001(17) Crash data from the Highway Safety and Information System (HSIS) database for the state of California were summarized to identify the proportion of crashes by ranges of Average Daily Traffic (ADT) for movements entering the intersection and the proportion of crashes by collision type. The HSIS data includes all reported crashes at signalized intersections for the period between 1994 and 1998. Table 6 presents a summary of total and injury/fatal crashes by volume, and table 7 presents the results and identifies the proportion of crashes by collision type for signalized intersection based on the california HSIS data. Table 6. Total motor vehicle crashes and injury/fatal collisions at
Source: HSIS California database, 1994-1998(18) As shown in table 6, the 20,000 to 40,000 ADT and 40,000 to 60,000 ADT ranges represent the greatest percentage of signalized intersections from the database and have the highest percentage of total crashes and injury/fatal crashes. The percentage of total and injury/fatal crashes that occurred in the 40,000-60,000 ADT range is similar; however, the proportion of intersections in this range is much smaller. Table 7. Proportion of crashes by collision type at signalized intersections.(18)
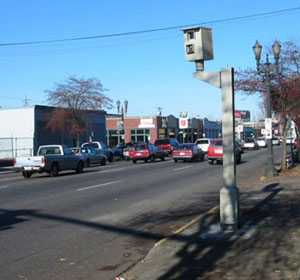
As shown in table 7, the most frequently occurring collision is a rear-end crash, which represents 42 percent of all reported intersection crashes in the database. Vehicle DimensionsMotor vehicle needs at a signalized intersection are governed by the dimensions of the design vehicle, which is the largest vehicle reasonably expected to use the intersection. Commonly, WB-15 (WB-50) vehicles, or truck/trailer combinations with a wheelbase of 15 m (50 ft), are the largest vehicles along many arterials. However, many signalized intersections are located on State highways where the design vehicle is an interstate vehicle such as a WB-20 (WB-67), or a truck/trailer combination with a wheelbase of 20 m (67 ft). Specific information on the dimensions for these and other design vehicles can be found in standard references.(3) Design vehicles need to be carefully considered wherever they are expected to make a turning movement through the intersection. Affected elements include corner radii, channelization islands, median noses, and stop bar locations. In accommodating the design vehicle, however, tradeoffs for other users need to be acknowledged, such as the increase in pedestrian crossing distance or the accommodation of cyclists around channelization islands. Red Light RunningOne primary cause of collisions at signalized intersections is when a motorist enters an intersection when the red signal is displayed, and as a consequence collides with another motorist, pedestrian, or bicyclist who is legally within the intersection. It is estimated that approximately 750 fatalities and 150,000 injuries occur on a yearly basis due to red light running. A study of HSIS data determined that red light runners cause 16 to 20 percent of all collisions at signalized intersections.(19) Red light running may occur due to poor engineering, distraction, inattention, or willful disregard. Those who deliberately violate red lights tend to be younger, male, less likely to use seat belts, have poorer driving records, and drive smaller and older vehicles. Countermeasures proposed to address red light running are removal of unwarranted traffic signals, changing the signal timing, improving the visibility of the traffic signal, or enforcement. An example of red light running enforcement cameras is given in figure 3.
Driver DistractionDespite the complexity of the driving task, it is not uncommon to see drivers engaging in other tasks while operating a motor vehicle. While these tasks may seem trivial, they take the attention of the driver away from the task of driving. One report estimated that 13 percent of all collisions occur due to driver distraction. Drivers involved in collisions at intersections were more likely to report that they "looked but didn't see." Drivers involved in intersection collisions as opposed to other driving situations reported that they were more likely to be distracted by:(20)
2.2.3 BicyclistsBicycle travel is an important component of any multimodal transportation system. Bicycle travel is healthy, cost effective, energy efficient, and environmentally friendly. Traditionally, the most popular form of bicycle travel is recreational cycling. Given the increases in traffic congestion over the past few decades, particularly in urban areas, the number of people that use bicycles to commute to work is on the rise.(21) Bicyclists have unique needs at signalized intersections. Bicyclists are particularly vulnerable because they share the roadway with motorists and follow the same rules of the road, yet they do not possess nearly the same attributes in size, speed, and ability to accelerate as their motor vehicle counterparts. Consequently, roadway characteristics such as grades, lane widths, intersection widths, and lighting conditions influence the safety and operations of bicyclists to a larger degree than they do for vehicles. External conditions such as inclement weather also significantly affect bicyclists' performance. Providing safe, convenient, and well-designed facilities is essential to encourage bicycle use.(21) To accomplish this, planning for bicycle use, whether existing or potential, should be integrated into the overall transportation planning process. Providing a safe and attractive environment for bicyclists requires special attention to the types of bicycle users, their characteristics and needs, and factors that influence bicyclist safety. Bicycle UsersBicyclists range widely in terms of skills, experience, and preferences. A 1994 report by FHWA defined the following general categories (A, B, and C) of bicycle user types:(22)
Bicyclist DimensionsBicyclists require at least 1.0 m (40 inches) of operating space, with an operating space of 1.2 m (4 ft) as the minimum width for bike lanes or other facilities designed for exclusive one-way or preferential use by bicyclists (see figure 4). For facilities where motor vehicle volumes, motor vehicle or bicyclist speed, and the mix of truck and bus traffic increase, such as most high-volume signalized intersections, a more comfortable operating space of 1.5 m (5 ft) or more is desirable.(22) In addition, because most bicyclists ride a distance of 0.8 to 1.0 m (32 to 40 inches) from a curb face, this area should be clear of drain inlets, utility covers, and other items that may cause the bicyclist to swerve.(22) Where drain inlets are unavoidable, their drainage slots should not run parallel to the direction of travel, as these can cause a bicyclist to lose control. Bicycle User NeedsThe general objectives for bicycle travel are similar to those for other modes: to get from point "A" to point "B" as efficiently as possible on a route that is safe and enjoyable. At the same time, the mode of travel must integrate with other forms of transportation that use the roadway network and not adversely affect other modes or uses.
Sources: (22); (6), as adapted from (23) The Danish Road Directorate identifies key elements to incorporate in the planning of cycling facilities:
Other elements that should be considered in the planning and design of bicycle facilities include bike lanes, pavement surface conditions, drainage inlet grates, refuge, and lighting.(24) Bicycle safetyIn 2001, the National Highway Traffic Safety administration (NHTSA) reported that 728 bicyclists were killed and 45,000 injured in motor vehicle crashes.(25) However, many bicycle crashes either do not involve a motor vehicle or go unreported. A study of records at eight hospitals in three states found that 55 percent of bicycle injury events in a roadway did not involve a motor vehicle.(26) In addition, the study found that 40-60 percent of bicycle-motor vehicle crashes were not reported to the official State files. Bicycle-motor vehicle crashes are a concern at intersections. An FHWA report identified four common crash types, three of which occur at intersections:(27)
Figure 5 presents the typical conflicts for bicyclists at a signalized intersection. As the exhibit shows, bicyclists going straight through a signalized intersection encounter the same conflicts as a motor vehicle (shown in the exhibit as open circles) but also encounter conflicts from motor vehicles turning right from the same direction. Left turns for bicyclists are even more complex and depend on the type of bicyclists. For small- to medium-sized signalized intersections, category a and some category B cyclists will generally choose to take the lane as a motor vehicle, as it is the fastest way through the intersection; the remainder will likely feel more comfortable traveling as a pedestrian, as shown in figure 5. As the size of the intersection increases, the difficulty for cyclists to weave to the left turn lane can be daunting for Category B and even some category a cyclists.
Research confirms that the conflicts described above result in high risk for bicyclists at signalized intersections. Geary examined nearly 4,000 bicycle fatalities recorded on american roads during the period 1994-1998 with the use of the fatality analysis Reporting System database maintained by NHTSA.(28) The research indicated that intersections are far more involved in the injury-producing bicyclist crashes (73 percent) than in the fatal crashes (37 percent). Intersection-related fatalities are far more common on urban rather than rural roads, and during daylight instead of after dark. Recent trends suggest that adults are becoming more involved in collisions involving bicycles, while children are becoming less involved. An analysis of police-reported collisions between bicyclists and motorists that occurred in Toronto, canada, indicated that 17 percent of bicycle collisions occur at signalized intersections.(29) In just over half of these crashes, the cyclist was struck while crossing the intersection within the pedestrian crosswalk. A Vancouver study found that the risk for collision while cycling is approximately three times higher than for driving a motor vehicle over the same distance.(30) The ratio varies between 2:1 and 6:1 in other British Columbia jurisdictions. Right-angle collisions were the most frequent collision type (28 percent of all collisions). Collisions that occur at signalized intersections accounted for 17 percent of all collisions. 2.2.4 PedestriansWalking is the oldest and most basic form of transportation. Nearly every trip includes a walking element. According to the 2001 Nationwide Personal Transportation Survey, 8.6 percent of all daily trips occurred via the walk mode.(31) People walk for a variety of reasons: social and recreational activities, trips to school or church, shopping, commuting to and from work, and connecting to or from other modes of transportation. Activities often concentrate on the corners of intersections where pedestrian streams converge, people interact and socialize, and people wait for crossing opportunities. The variety of pedestrian users includes persons of all ages, with and without disabilities, persons in wheelchairs, and persons with strollers, freight dollies, luggage, etc; an example is given in figure 6. The design of intersection facilities should accommodate all types of pedestrians, because the user cannot be anticipated.
Pedestrian DimensionsResearch has shown that the ambulatory human body encompasses an ellipse of 45 by 60 cm (18 by 24 inches).(32) This dimension, however, does not account for a variety of scenarios, including pedestrians walking side by side; persons using canes, walkers, dog guides, or wheelchairs; persons with shopping carts or baby carriages, and so on. Table 8 shows dimensions for various types of pedestrians. The Americans with Disabilities act accessibility Guidelines (ADAAG), specifies a 1.525-m (60-inch) square area to allow a wheelchair user to make a 180-degree turn (figure 7).(33) For parallel approaches, ADAAG specifies a minimum low-side reach of 0.23 m (9 inches) and a maximum high-side reach of 1.37 m (54 inches). For a forward approach, ADAAG specifies a minimum low-reach point of 0.38 m (15 inches) and a maximum high-reach point of 1.22 m (48 inches). Table 8. Typical dimensions for a sample of types of pedestrians.
Pedestrian CharacteristicsPedestrian walking speeds generally range between 0.8 to 1.8 m/s (2.5 to 6.0 ft/s).(3) The MUTCD uses a walk speed of 1.2 m/s (4.0 ft/s) for determining crossing times.(1) However, FHWA pedestrian design guidance recommends a lower speed of 1.1 m/s (3.5 ft/s) in general to accommodate users who require additional time to cross the roadway, and in particular a lower speed in areas where there are concentrations of children and or elderly persons.(34,35) The HCM 2000 indicates that if elderly persons constitute more than 20 percent of the total pedestrians, the average walking speed decreases to 0.9 m/s (3.0 ft/s).(2)
A general rule of thumb indicates that pedestrians at crossings are willing to wait only 30 seconds, at which point they will begin to look for opportunities to cross, regardless of the walk indication and the crossing location (reference 7, chapter 18 of HCM 2000).(2) Shorter cycle lengths benefit pedestrians, particularly where pedestrians often need to cross two streets at a time to travel in a diagonal direction, as well as drivers, who experience generally shorter delays. Pedestrian ConflictsFigure 9 presents the typical conflicts between pedestrians and motor vehicles at a signalized intersection.
In addition, large signalized intersections with multiple lanes on each approach present the pedestrian with the possibility of having a vehicle in one lane yield but having a vehicle in the adjacent lane continue without yielding. The vehicle that has yielded may block the pedestrian's and other motorist's view of each other, thus putting the pedestrian at greater risk. This type of conflict may be present at signalized intersections in the following situations:
Pedestrian SafetyThe safety of pedestrians must be a particular concern at signalized intersections, particularly those with a high volume of motorized vehicles. Pedestrians are vulnerable in an environment surrounded by large, powerful, and fast-moving vehicles. Data from the Bureau of Transportation Statistics shows that in 2001, there were a total of 4,882 pedestrian fatalities involved in motor vehicle crashes; this represents 12 percent of all the 42,116 motorist collisions. More than 77,000 pedestrians were injured in motor vehicle collisions during this time.(17) Of all crashes between single vehicles and pedestrians in 2001, 940 (22 percent) occurred at intersections (both signalized and unsignalized).(36) Speed plays a major role in motorist-pedestrian collisions, particularly fatalities; a pedestrian struck at 65 km/h (40 mph) has an 85-percent chance of being killed, at 48 km/h (30 mph) the probability of fatality is 45 percent, and at 30 km/h (20 mph) the probability of fatality drops to 5 percent.(37) Compounding the problem, motorists rarely stop to yield to a pedestrian when their speeds are greater than 70 km/h (45 mph); they are likely to stop when their speeds are less than 30 km/h (20 mph).(38) From the driver's perspective, the mind goes through five psychological steps to "see" an object such as a pedestrian: selection, detection, recognition, location, and prediction. The speed of the vehicle and the experience of the driver play critical roles in the driver's ability to detect pedestrians and react appropriately. Research shows that difficulties in information processing and driver perception contribute to approximately 40 percent of all traffic crashes involving human error.(38) The time required for a driver to detect a pedestrian, decelerate, and come to a complete stop is oftentimes underestimated, or worse yet, not even considered as part of the geometric design of an intersection. AASHTO's a policy on Geometric Design of Highways and Streets recommends a brake reaction time of 2.5 s for determining stopping sight distance.(3) Additional research has suggested that the value of 2.5 s has limitations and represents nearly ideal conditions with younger, alert drivers.(39) Research conducted by Hooper and mcGee suggests that a perception-reaction time of 3.2 s is more reasonable.(40) Even then, the reaction time assumes an expected or routine condition such as a vehicle turning into or out of a driveway ¾ more time is needed to account for an unexpected condition, such as a child darting into the street. A conservative perception-reaction time estimate for a "surprise" condition is 4.8 s.(38) Many things can impact the sight distance that allows the driver and pedestrian to see each other: landscaping, parked vehicles, traffic control devices, street furniture, etc. The practitioner must be mindful of these elements, particularly given that two-dimensional plans do not necessarily reflect the three-dimensional field of vision from the pedestrian and driver vantage points. The combination of vehicle speed and visibility (or lack thereof) is a critical reason that the majority of motorists involved in pedestrian collisions claim that they "did not see them until it was too late."(38) Accessibility for pedestrians is also a key element. The ADA of 1990 mandates, among other things, that transportation facilities be accessible for all persons.(7) This requires that new or altered facilities be designed to allow pedestrians of all abilities to identify the crossing location, access the pushbutton, know when to cross, and know where to cross. The Americans with Disabilities act accessibility Guidelines published by the U.S. Access board in 1991 identify minimum design standards that must be applied to all new construction or alteration projects to adequately accommodate persons with disabilities.(33) The accommodation of all users needs to be included into the construction cost of an improvement. Note that facilities that are designed above the minimum standards generally improve the safety and accessibility for all pedestrians. 2.3 Applying Human FactorsTo achieve error-free road user performance at signalized intersections, the information necessary to permit relatively safe performance in an inherently hazardous environment must be effectively communicated. The design of the roadway network, including the intersections, should inherently convey what to expect to the various users. Road users must receive information in a form they can read, understand, and react to in a timely fashion. This information must reinforce common road user expectations, or if uncommon elements are present, emphatically communicate alternative information with sufficient time to react. Failure to fully and adequately communicate the circumstances to be encountered by the road user increases the risk of hesitation, erroneous decisionmaking and incorrect action. Road users will rely on experience rather than their perceptions (however incomplete) of the situation at hand when their expectations are not met. A fundamental premise of human factors is that insufficient, conflicting, or surprising information reduces both the speed and accuracy of human response. The following bullet items offer key information regarding the application of human factors principles in the analysis and design of a signalized intersection:
|
||||||||||||||||||||||||||||||||||||||||||||||||||||||||||||||||||||||||||||||||||||||||||||||||||||||||||||||||||||||||||||||||||||||||||||||||||||||||||||||||||||||||||||||||||||||