U.S. Department of Transportation
Federal Highway Administration
1200 New Jersey Avenue, SE
Washington, DC 20590
202-366-4000
Federal Highway Administration Research and Technology
Coordinating, Developing, and Delivering Highway Transportation Innovations
| SUMMARY REPORT |
| This summary report is an archived publication and may contain dated technical, contact, and link information |
|
Publication Number: FHWA-HRT-08-071
Date: February 2009 |
|||||||||||||||||||||||||||||||||||||||||||||||||||||||||||||||||||||||||||||||||||||||||||||||||||||||||||||||||||||
SUMMARY: Evaluation of Sign and Marking Alternatives for Displaced Left-Turn Lane IntersectionsFHWA Contact: Joe Bared, This document describes research conducted by the Federal Highway Administration (FHWA) to support guidance on the signing and marking of displaced left-turn lane intersections (DLT)—also known as continuous flow intersections (CFI). PDF Version (706 KB)
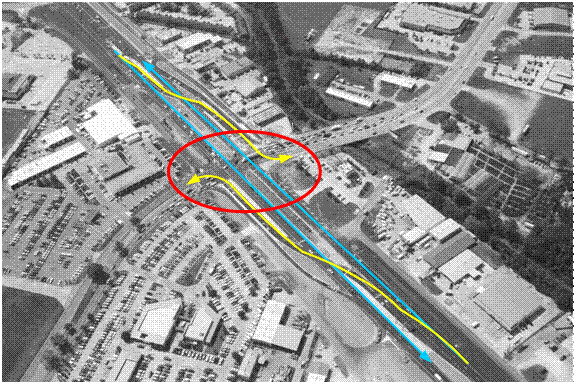
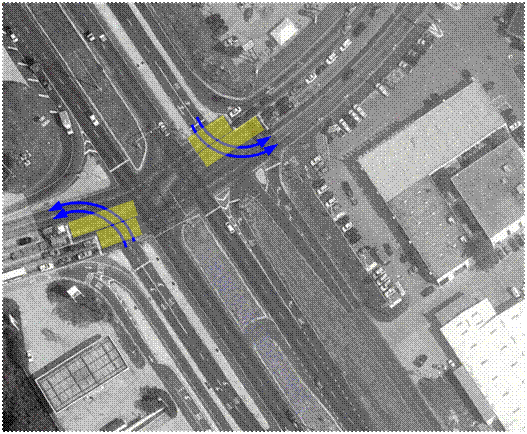
PDF files can be viewed with the Acrobat® Reader® IntroductionIn recent years, the FHWA has researched certain novel intersection designs as a means to promote intersection safety while meeting the often conflicting demands to increase capacity, decrease travel time, and minimize the cost of new infrastructure. One of these designs, the DLT, is in the early stages of deployment in the United States. The DLT is an at-grade intersection that is intended to support high-traffic flow where there is a large volume of left turns and heavy through volumes. Its design permits the use of two- or three-phase traffic signals at the junction of two roads, while still providing at-grade protected left-turn movements. Two-phase signals are enabled by having left-turning traffic cross over opposing lanes to the left side of the roadway in advance of the main intersection. The turn onto the cross street can then be made at the same time as the opposing through movements on the originating road. This eliminates possible conflicts with the through movement. Timing of the signals at the crossover points and at the main intersection can help to ensure that vehicles, whether through or turning, stop just once at the intersection. Figure 1 shows the direction of travel for left-turn traffic (yellow arrows) and opposing through traffic (blue arrows) at a partial DLT in Baton Rouge, LA. A partial DLT is designed with two opposing displaced left-turn bays on the major road, while the left-turn traffic of the cross street is kept at the main intersection.
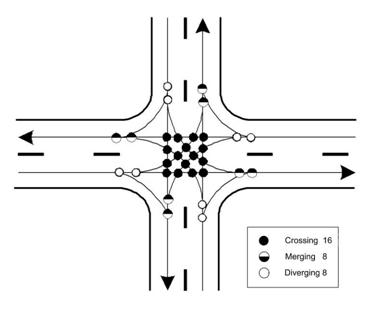
Figure 1. Left-turn and through movements at a DLT in Baton Rouge, LA. Several studies have shown the benefits of the DLT design over other signalized intersection designs in terms of increased capacity(1,2,3) and efficiency of land use.(1,4) Because it uses a two-phase signal, the DLT results in less delay, fewer pollutants, and lower fuel consumption than conventional at-grade intersections that have three or more signal phases.(5) Some evidence suggests that the DLT may also provide a safety benefit relative to conventional intersections with protected left turns. In the absence of crash data, the safety of an intersection design may be estimated by counting the number and type of potential conflict points. This method identifies three types of potential conflict points: (1) diverging, (2) merging, and (3) crossing. Diverging conflicts occur where vehicle paths split or diverge and may occur where some vehicles slow down to turn onto another roadway while others maintain their speed on the current roadway. Merging conflicts occur where two traffic paths come together and may result in side-swipe collisions or rear-end collisions if vehicles in the converging paths are traveling at different speeds. Crossing conflicts are potentially the most dangerous, as these occur where two traffic paths cross at right, or nearly right, angles. Figure 2 shows the conflict points for a conventional four-legged signalized intersection. Thirty-two conflict points are depicted: 8 diverging, 8 merging, and 16 crossing conflicts—most of which are associated with left-turn movements.
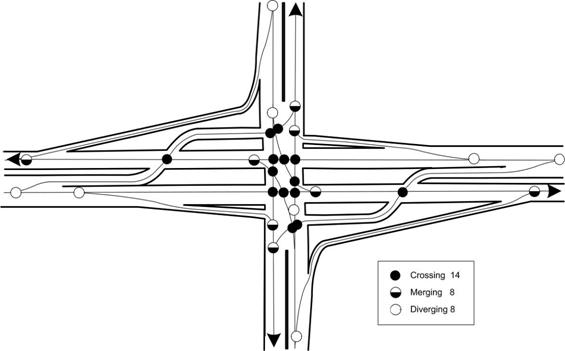
Figure 2. Conflict diagram for a conventional four-legged at-grade intersection. Figure 3 shows a conflict diagram for a DLT of the type examined in this study—a partial DLT with crossovers on the two opposing approaches. There are 30 conflict points in this DLT, 2 fewer than for the conventional intersection. The importance of this 6-percent reduction in the number of conflict points may be greater than the numerical reduction because it is a reduction in the most serious conflict type—the crossing conflict. In this summary report, the road with the crossover left-turn movements will be referred to as the major road. The road without crossovers for the left-turn movements will be referred to as the minor road. It should be noted that a full DLT with crossovers for all left-turn movements would have 12 crossing path conflicts, 2 fewer than for the partial DLT examined in this report.
Figure 3. Diagram. Conflict diagram for a partial DLT. Although the number of conflict points is widely used as a safety assessment tool, a literature review revealed little empirical support for a relationship between the number of conflict points and crashes.(6) Similarly, although the frequency of actual conflicts (also known as near crashes or near misses) and the frequency of actual crashes would seem to be related, the literature is not clear on that either. While some authors report a positive correlation between observed conflicts and crashes(7,8) and others report a positive correlation between conflicts in microsimulations and real-world crashes,(9) the complexities of driver behavior and observer judgment make interpretation of actual conflicts and crashes difficult.(10) Nevertheless, the reduction in severe conflict points provided by the DLT design offers the potential for increased safety. The present study was intended to provide an increased understanding of motorist behavior at DLT intersections and to provide some insight into signing and marking techniques to enhance DLT safety performance. GoalOnly a few DLT intersections exist in the United States; therefore, the DLT is not familiar to most motorists. Furthermore, the techniques for signing and marking DLTs have yet to be standardized. The research reported here is intended to provide an empirical basis for development of DLT signing and marking guidance. Specific objectives of the study were as follows:
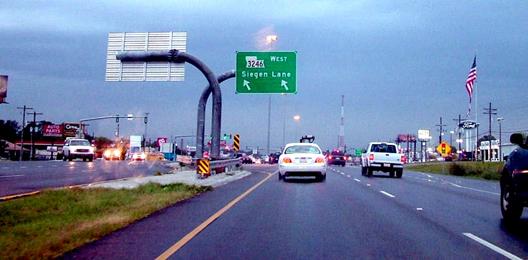
BackgroundWhen this study began, the partial DLT in Baton Rouge, LA (depicted in figure 1), had been in operation for almost 1 year. The questions addressed in this study were partly based on experience at that intersection. At the Baton Rouge DLT, the left-turn crossovers occur about 152 m (500 ft) before the main intersection. To alert drivers who intend to go left of the need to begin their left-turn movement earlier than they might otherwise expect, the Louisiana transportation department decided to install large and conspicuous overhead signs (see figure 4). Such overhead signs are much more expensive than road-side ground-mounted signs, so the question arose whether ground-mounted signs might be just as effective as overhead signs. Three navigation sign conditions were implemented in the FHWA Highway Driving Simulator: (1) an overhead sign similar to the one in Baton Rouge, (2) ground-mounted signs both in the median and on the right side of the road, and (3) only one ground-mounted sign on the right side of the road.
Figure 4. Photo. Overhead sign for a left-turn crossover at the Baton Rouge DLT. Also at the Baton Rouge DLT, some drivers on the minor road were observed stopping beyond the stop line and in the path of the left-turn movement from the major street. This area of potential conflict is indicated in figure 5, in which the photograph of the DLT has been shaded yellow to show the area where vehicles on the minor street sometimes overran the stop line. Arrows in figure 5 show the path of potentially conflicting turning vehicles.
Figure 5. The potential conflict between stopped vehicles and left-turning vehicles from the major (crossover) approach. ApproachA partial DLT was modeled in the FHWA Highway Driving Simulator. Three alternative signing, marking, and traffic signal locations were implemented. The behaviors of volunteer drivers recruited from the Washington, DC, metropolitan area were then recorded as they navigated through the simulated intersections. For comparison, the conventional design of the same intersection was also implemented. All designs, whether conventional or DLT, had three through lanes in each direction, two left-turn lanes for each approach, and one right-turn lane for each approach. The performance measures were as follows:
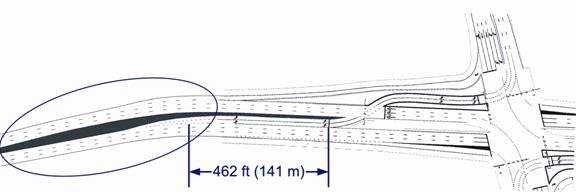
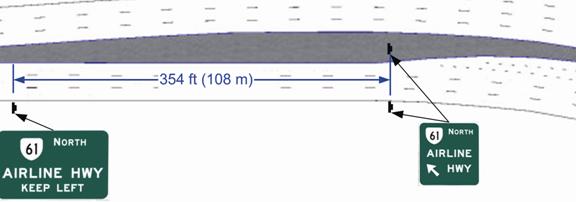
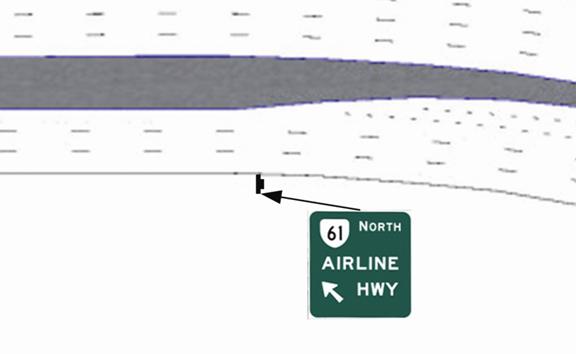
Navigation errors were recorded when drivers failed to turn left in accordance with the route instructions. Late changes into turn lanes were recorded if participants were still in the through lanes when they could have been in either of the two left-turn lanes. The stopping location was of interest on the minor street approach to the intersection because of the stop line overrun problem that had been observed at the Baton Rouge DLT. MethodSimulator DescriptionFHWA’s Highway Driving Simulator is a relatively high fidelity research simulator. Simulator components include a 1998 Saturn SL1 chassis, five projectors, and a cylindrical projection screen. Each of the projectors has a resolution of 2,048 by 1,536 pixels, and the image on the screen wraps 240 degrees around the forward view. Measured horizontally, the projection screen is 2.7 m (9 ft) from the driver design eye point. The vehicle chassis is mounted on a three degree-of-freedom motion system. A sound system provides engine, wind, tire, and other sounds. The vehicle dynamics model is calibrated to approximate the characteristics of a small passenger sedan. Data capture is synchronized to the frame rate (mean ≈ 100 fps) of the graphics cards. Data recorded from the vehicle dynamics model included speed, longitudinal acceleration, lateral acceleration, throttle position, brake force, vehicle position, and heading. The Simulated RoadwaysBetween intersections, both major and minor roads consisted of six lanes, three in each direction. At conventional intersections and DLTs, there were two left-turn lanes and one right-turn lane. Treatment ConditionsThere were three signing treatments on the major road approaches to the DLT crossover and three treatments on the minor road approaches to the DLT. For the conventional comparison intersections, signs and markings did not vary. Major Road TreatmentsA plan view of approach to the DLT is illustrated in figure 6. The three treatment conditions were implemented on the major road approach in the circled area in figure 6. The treatments were labeled overhead sign, two ground-mounted signs, and one ground-mounted sign.
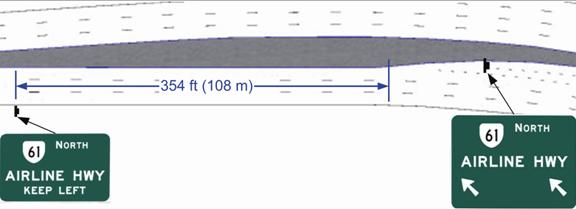
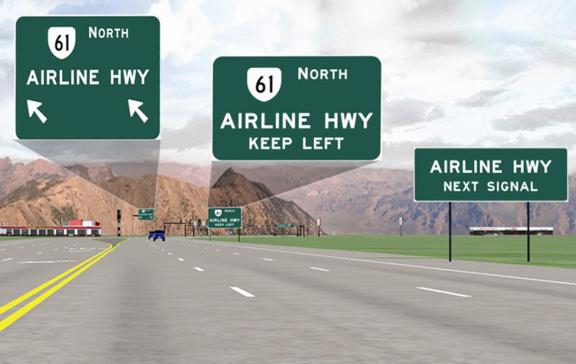
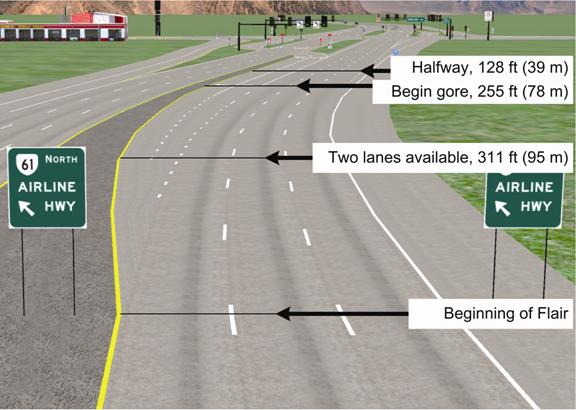
Figure 6. The approach to the DLT crossover with the area where the signing differed between major road treatments is circled. Overhead Sign. The overhead sign treatment, which is illustrated in figure 7, consisted of two signs. At 108 m (354 ft) before the flair of the upstream left-turn lane, there was a ground-mounted KEEP LEFT sign (MUTCD, D3-2). Then centered over the two left-turn lanes and at the end of the flair for the turn-lane lanes, there was an overhead sign with the street name and left slanted arrows positioned above the lanes. A third sign, a ground-mounted NEXT SIGNAL sign (MUTCD, D3-2) on the right side of the road, is also shown in figure 8. This sign was present in all three main road treatment conditions and was placed 230 m (754 ft) before the flair of the upstream left-turn lane.
Figure 7. The overhead sign treatment. Two Ground-Mounted Signs. The two ground-mount signs treatment is illustrated in figure 9. This treatment replaced the overhead sign with two signs that gave the street name and route number and had a left slanted arrow. The NEXT SIGNAL and KEEP LEFT advance signs for the left turn were in the same locations as they were in the overhead sign treatment. One Ground-Mounted Sign. The one ground-mounted sign treatment, which is illustrated in figure 10, differed from the two ground-mounted signs treatment in two ways. First, the street name and route number sign in the median was removed. Second, there was no upstream KEEP LEFT sign.
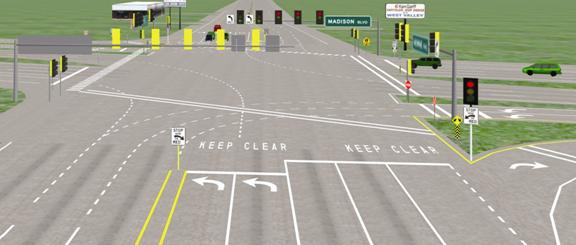
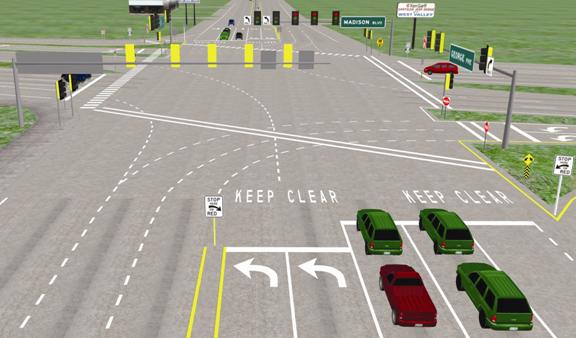
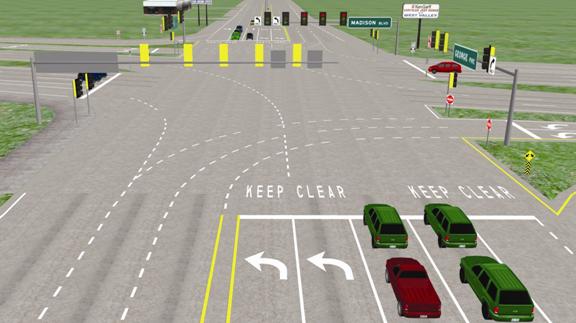
Figure 8. Progression of signs in the overhead treatment for the DLT crossover. Minor Road TreatmentsOn the minor road approach to the DLT, there were also three treatment conditions. These were labeled high, medium, and low in accordance with the amount of signing and marking that was used. The purpose of these treatments was to determine the extent of signing and marking needed to minimize stop line overruns, such as those observed in Baton Rouge. High. The high treatment is shown in figure 11. It consisted of KEEP CLEAR painted on the pavement beyond the stop line, staggered stop lines, STOP HERE ON RED (MUTCD R10-6a) signs mounted on the right side of the road and in the median, a crosswalk marked with parallel transverse lines, and a near-side traffic signal head located to the right of the intersection stop line. Medium. The medium treatment, shown in figure 12, was the same as in the high treatment, except for the removal of the near-side traffic signal. The STOP HERE ON RED sign was mounted on a sign post instead of on the traffic signal post.
Figure 9. The two ground-mounted signs treatment.
Figure 10. The one ground-mounted sign treatment. Low. In the low treatment there was no crosswalk, and there were no STOP HERE ON RED signs. In addition, a single stop line served all lanes, as was the case at the Baton Rouge DLT. Except for the KEEP CLEAR pavement marking, the low treatment resembled the conditions at the Baton Rouge DLT, where overrunning of the stop line had been observed. The low treatment is shown in figure 13.
Figure 11. High treatment on minor street approach.
Figure 12. Medium treatment on the minor road approach. ParticipantsNinety-six participants were recruited through an FHWA participant database and through the use of ads in local newspapers and on the Internet. Participants were required to have a valid driver’s license and were tested to verify that their visual acuity was at least 20/40 vision in at least one eye. One-third of the participants were assigned to each of three treatment combinations: (1) overhead and high, (2) two-ground mounted and medium, or (3) one ground-mounted and low. Within these groups of 32 participants, there were equal numbers of males and females over and under the age of 65.
Figure 13. Low treatment on the minor street approach. Research DesignTable 1 summarizes the research design. Table 1. Research design and sample size for the major road signing variable.
The Simulation ScenariosAll participants drove through a series of eight intersections. At the beginning of the experimental session and each time they passed through an intersection, they were given an instruction of the form, “follow the signs to state route [xx], [street name].” For example, “Follow the signs to state route 61, Airline Highway.” If the instructions were followed, a left turn was made at every other intersection. The second and sixth intersections were always one of the minor street approaches. Half the participants encountered the minor street approach to the DLT first and the minor street approach to the conventional intersection second, and the other half encountered these intersections in the reverse order. The fourth and eighth intersections were on the major road approaches. Half of the participants encountered the DLT crossover first (at the fourth intersection) and the conventional intersection second (at the eighth intersection), and half encountered those intersections in the reverse order. The signal was always red when participants arrived at the second and sixth intersections (the minor street approaches). The signal was always green for the major street approaches at the fourth and eighth intersections. The counter-balancing scheme for controlling the order of occurrence of conventional and DLT intersections is shown in table 2. Groups of 24 participants received each order, with equal numbers of males and females in each group. Whenever participants failed to make the correct maneuver at any intersection, they were allowed to proceed through the intersection before being given verbal instructions to make a U-turn. They were then guided back onto the intended route. The first, third, fifth, and seventh intersections were conventional and signalized, and the signals always showed green. If participants correctly followed the navigation instructions, no turns were made at these intersections. The posted speed limit on major road approaches was 80 km/h (50 mi/h), and the posted speed limit on minor road approaches was 56 km/h (35 mi/h). Preexperiment Familiarization DrivesBefore beginning to drive through the eight intersections that represented the main part of the experiment, participants were allowed to familiarize themselves with the handling of the simulator vehicle on a wide multilane road where they accelerated, braked, and changed lanes. This was followed by an additional drive through three conventional signalized intersections. At two of these intersections, participants made left turns. At the remaining intersection, they encountered a red traffic signal where they stopped and waited for a green signal. FindingsThe findings for the major and minor road approaches were analyzed separately as they addressed different questions and are assessed by different measures. Major Road ApproachThe question of interest on the approach to the crossovers was the type and quantity of signage that would be needed to ensure that most drivers recognized the need to merge into a left-turn lane well upstream of the main intersection. The primary measure of effectiveness was the location on the approach to the crossover where participants entered the left-turn lanes. A secondary measure was whether the driver missed the crossover entirely and whether an illegal left turn was made at the main intersection. Table 2. Four combinations of DLT and conventional intersection orders used.
Lane position was first assessed when the participant's vehicle was 273 m (895 ft) upstream from the crossover stop line and 177 m (580 ft) upstream of the beginning of the flair for the turn lanes. At this point, there were three through lanes and no turn lanes or flairs. Drivers could see the navigation signs ahead but could not yet read them. In the overhead and two ground-mounted signs treatments, drivers could have read an advance navigation sign that indicated that their intended destination was the next left. It appears that the NEXT LEFT sign, which was not in the one ground-mounted sign treatment, was effective. There were fewer drivers in the left lane in the one ground-mounted sign treatment than in the other two treatments, which resulted in a significant lane by treatment interaction, χ 2 (4) = 15.2, p < 0.01. Table 3 shows lane position counts for the three signing treatments at this upstream location. The lane occupancy of participants was classified at four locations on the approach to the crossover: (1) at the end of the left-turn flair where two turn lanes were fully available, (2) at the beginning of the painted gore for the turn lanes, (3) half the distance between the beginning of the painted gore and the stop line, and (4) at the upstream stop line. These points are depicted in figure 14. At each of these points, participants were classified as either in the turn lanes or in the through lanes. As can be seen in table 4, participants in the one ground-mounted sign treatment were late entering the crossover lanes relative to participants in the other two treatment conditions. Where the two turn lanes were first available and at the gore, the differences between treatment groups were significant, χ2(2) = 9.8, p < 0.01, and χ2(2) = 11.1, p < 0.01, respectively. Once the halfway point between the beginning of the gore and the stop line was reached, there was no longer a significant difference between treatment groups (p > 0.05). Table 3. Vehicle lane positions upstream of the crossover
For comparison, the participants' lane was also classified for the major road approach to the conventional intersection. Because of geometric differences between DLT and conventional intersection design, the points of comparison were only approximate. The left-turn lanes of the conventional intersection were much longer than the lanes on the approach to the crossover. As can be seen in table 5, most drivers were in the conventional intersection turn lanes as soon as the lanes were available, and there were no differences in the number of drivers in these lanes as a function of the approach signage treatment. The lack of difference among groups should not be surprising as there were no differences in signing at the conventional intersections. Minor Road ApproachThe main concern at the minor road crossing was whether some drivers might stop beyond the stop line at red traffic signals. If they did this, they could potentially obstruct the left-turning traffic that had crossed over to the left side of the major road.
Figure 14. Approach to DLT crossover with reference points measured from the stop line for the assessment of lane occupancy. Only one driver, who was in the high treatment condition, failed to stop behind or near the stop line. Instead, at the stop line, the driver straddled the gore line between the through and left-turn lanes and did not come to a full stop until 10 m (33 ft) beyond the stop line. When the protected left-turn signal turned green, the driver began to move to the right and into the through traffic lane, which still had a red signal indication, and then swerved to the left and made the left turn. The behavior of that participant clearly indicated that the driver was confused as to whether to go straight or turn left. Table 4. Number of drivers (out of 32 ) in each signing group who were in the left-turn lanes at four points on the approach to the left-turn crossover.
1 m = 3.28 ft Table 5. Number of drivers (out of 32) in each signing group who were in the left-turn lanes at four points on the approach to the conventional intersection.
1 m = 3.28 ft There was no difference between treatment groups in average stopping distance relative to the stop line, F (2, 86) = 0.05, p > 0.5. The overall mean stopping distance behind the stop line was 5.3 m (17.4 ft). This stopping distance was significantly further upstream of the stop line than for the minor street approach to the conventional intersection, F (1, 81) = 7.3, p < 0.01. In the conventional intersection, the mean distance to the stop line was 4.1 m (13.4 ft). Although both of these distances are greater than might be expected in the real world, they are consistent with the results of previous studies in the FHWA Highway Driving Simulator. In the simulator, participants tend to perceive that they are at the stop line as soon as the stop line cannot be seen over the hood of the car, at which point they are still about one car length upstream of the virtual stop line. DiscussionThis study had three purposes: (1) to inform recommendations for signing DLT crossovers, (2) to inform recommendations for mitigation of stop line overruns on minor street approaches to DLTs, and (3) to assess the extent to which naïve drivers are able to navigate a DLT the first time they encounter it. Signing at CrossoversWith respect to DLT crossovers, the results show that advance signing is important and that overhead signing is not necessarily more effective than ground-mounted signs. On the three-lane approach to the crossovers, a KEEP LEFT sign 108 m (384 ft) upstream of the beginning of the taper for the left-turn lanes was effective in getting participants to move to the left lane. Ground-mounted signs on both sides of the road were effective in guiding drivers into the turn lanes. The relative importance of the advance KEEP LEFT and the street name navigation signs to prompt entry into the left-turn lanes remains to be determined in future studies. The absence of a significant difference in the effectiveness of the overhead sign compared to that of the dual ground-mounted signs suggests that where ground-mounted signs on both sides of the road are feasible, the additional expense of an overhead guide sign might not be necessary. These results do not suggest that overhead signs should not be considered, but rather that in some situations ground-mounted signs may be sufficient. Stop Line Overrun MitigationRegardless of treatment condition, overrun of the stop line on the minor street approach to the DLT was not a problem. All three treatments employed the KEEP CLEAR pavement marking. Whether the KEEP CLEAR marking was responsible for the lack of stop line overruns in this study is uncertain. However, this pavement-marking treatment is relatively inexpensive and should be considered, particularly at reconstructed intersections where drivers may tend to stop at the main intersection because of habit or experience. Because drivers in the low condition did not overrun the stop line, this study does not permit evaluation of the potential effectiveness of near-side signals or the STOP HERE ON RED traffic control device. Naïve Driver NavigationEven though participants had no introduction to or previous experience with a DLT, all drivers who entered the DLT crossover lanes crossed to the left side of the road. No driver turned into the oncoming lanes rather than crossing them. It is also of note that in more than a year since its opening, no crashes have resulted from this driver error at the Baton Rouge DLT. Proper geometric design, signing, and marking seem sufficient to minimize the occurrence of this particular driver error. The participants in this study showed no confusion when confronted with a DLT for the first time. This finding adds to the evidence cited in the introduction of this summary report that the DLT design may be expected to promote intersection safety while meeting the demands for increased capacity, decreased travel time, and reduced cost of new infrastructure. RecommendationsBecause the crossover lanes for the DLT are upstream of where drivers might be expecting to begin their left-turn maneuver, conspicuous advance and navigation guide signing is recommended. In cases where conspicuous ground-mounted signs with good sight distance are feasible, overhead signing may not provide additional benefit. Where advance signing is not used, as was the case in with the one ground-mounted sign treatment, the frequency of last-minute lane changes may increase, and this might introduce a higher crash risk than otherwise. Therefore, advance signing is recommended to encourage drivers who intend to turn left to move to the left lane well before the taper for the left-turn lanes. References
|