U.S. Department of Transportation
Federal Highway Administration
1200 New Jersey Avenue, SE
Washington, DC 20590
202-366-4000
Federal Highway Administration Research and Technology
Coordinating, Developing, and Delivering Highway Transportation Innovations
 |
| This report is an archived publication and may contain dated technical, contact, and link information |
|
Publication Number: FHWA-HRT-10-038
Date: October 2010 |
Balancing Safety and Capacity in an Adaptive Signal Control System — Phase 13.0 ANALYSIS AND SIMULATION METHODOLOGIESThis section describes the research team's approach to analyzing the various relationships between signal timing parameters and surrogate measures of intersection safety. Details of the SSAM methodology and processing tools are described to provide further context of the analysis effort. The analysis and simulation methodology followed three steps. First, each test scenario—a combination of traffic conditions and signal timing parameters—was initially input and analyzed in Synchro™, a microscopic and deterministic signal timing optimization model. Based on the data entered for a specific case scenario, Synchro™ was used to either evaluate the test scenario conditions (i.e., compute traffic efficiency performance) and/or to optimize the signal timing settings. Next, the results from the Synchro™ analysis were transferred to VISSIM®, a microscopic and stochastic traffic simulation model. This step was time consuming both in the transfer mode from Synchro™ as well as in having to run the simulations for multiple replications. Nevertheless, VISSIM® was selected as the preferred model due to its ability to represent comprehensive signal timing logic and its resolution of vehicle trajectory data at 1/10 s. Six simulation runs were performed in VISSIM® for each test case before the vehicle trajectory data were transferred to the FHWA SSAM analysis software. The last step was to summarize the surrogate measures and to test for statistical significance using the t-test method embedded in SSAM. Each iteration of the simulation consisted of 15 min of warm-up period followed with a full hour of simulation time during which the safety performance measures were calculated. Data from the warm-up period were ignored during the analysis. The choice to use only these three models in this project was based on the research team's knowledge of each model, its ease of use, the model's credibility, and its application to this research. Synchro™ is one of the most commonly used models in the United States for signal timing optimization and evaluation. It is very easy to use to develop several signal timing alternatives. Moreover, the research team is experienced in using Synchro™. VISSIM® was used because of its ability to provide the data resolution that would support SSAM and to output phase timing performance data, including the cumulative number of green and red durations as well as the mean and average green and red times for each signal group (phase) in a file with the extension .lzv. VISSIM® has a large user base and is well supported in the United States. Compared to models such as CORSIM and SimTraffic®, VISSIM® is not easy to use and migration of data from Synchro™ to VISSIM® was very tasking and time consuming. The task of migrating data from the various Synchro™ signal timing alternatives was the most inefficient process of the research. SSAM is very easy to use and provides the surrogate measures of safety necessary for comparing alternative signal timing scenarios. Each simulation run in VISSIM® results in a corresponding trajectory file (.trj). SSAM analyzes the batch of VISSIM® trajectory files to identify conflict events and catalogs a variety of event data including, but not limited to, the following surrogate measures of safety: TTC, PET, DR, maximum deceleration rate (MaxD), maximum speed of either vehicle (MaxS), and maximum speed differential of the two vehicles (DeltaS). TTC is the time to crash into the leading vehicle if the following vehicle does not react by taking an evasive maneuver, assuming constant speeds. PET is the time that the following vehicle actually arrives at the point corresponding to a particular calculation of TTC after taking into account that the following vehicle has reacted to the leading vehicle's movements by braking. When TTC = 0 and/or PET = 0, SSAM determines that a crash has occurred. If TTC > 0, TTC ≤ 1.5 s, and PET ≤ 5.0 s, then SSAM marks the event as a conflict. The 1.5-s TTC threshold and 5.0-s PET threshold are defaults in the SSAM software as recommended by the literature and testing during previous projects.(5,6) 3.1 SYNCHRO™Synchro™ (developed by Trafficware®, Inc.) is a software package capable of modeling signalized and unsignalized intersections.(12) Synchro™ is commonly used for intersection-capacity and level-of-service analysis and/or signal timing optimization. The software has the ability to compute optimum timings for intersection offsets, cycle lengths, phase splits, and phase sequence. The software can display time-space diagrams that illustrate vehicle progression through a network. Since Synchro™ performs its analysis at a platoon level instead of an individual level, it is characterized as a macroscopic simulation model. Synchro™ version 6.0 was used to code the various alternative scenario models and optimize the signal timings in this project. 3.2 VISSIM®VISSIM® is a time-step and behavior-based microscopic traffic simulation software.(13) It is characterized as microscopic simulation software because of its ability to model and analyze each entity of the network at an individual level. VISSIM® is capable of simulating multiple modes of traffic, including cars, heavy-goods vehicles, high-occupancy vehicles, bus transit, light rail, heavy rail, rapid transit, cyclists, and pedestrians, for urban as well as rural conditions. The VISSIM® model consists internally of two distinct components, the traffic simulator and the signal state generator. These components are constantly communicating detector calls and signal status to each other through an interface. The traffic simulator is a microscopic traffic flow simulation model including car following, lane changing, and gap acceptance logic. The signal state generator is signal-control software that polls detector information from the traffic simulator on a discrete time-step basis (1/10 s). It then determines the signal status for the following time-step and returns this information to the traffic simulator. This interaction is the driving force behind modeling a signalized intersection. VISSIM® version 5.10 release 7 was utilized in this project to code the alternative scenarios and collect the vehicle trajectory data. 3.3 SSAMSSAM combines microsimulation and automated conflict analysis to analyze the frequency and character of narrowly averted vehicle-to-vehicle collisions (conflicts) to compute surrogate measures of the safety of traffic facilities. SSAM determines and quantifies three types of conflicts: crossing (angle), lane changing, and rear end.(5) SSAM provides the following features:
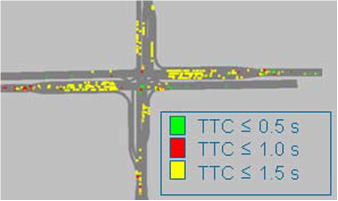
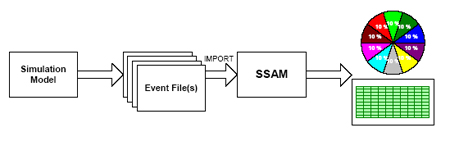
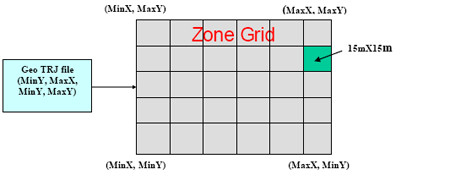
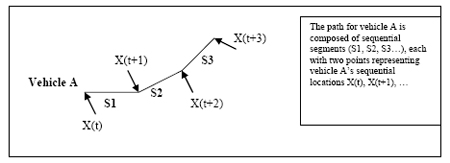
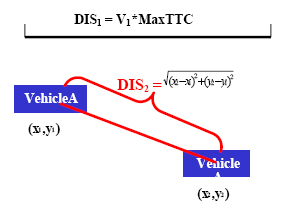
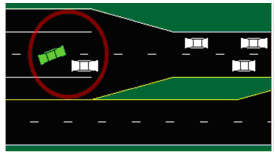
Figure 1. Screenshot. SSAM's color-coded conflicts. 3.3.2 Description of the SSAM Process This section, extracted from the SSAM validation report and user manual, provides an overview of the typical workflow using the SSAM software, tracing the flow of information through various input data, tasks or operations, and resulting outputs.(6,14) In doing so, many of the screens of the SSAM graphical user interface are introduced. SSAM operates by processing data describing the trajectories of vehicles driving through a traffic facility (e.g., a signalized intersection) and identifying conflicts. The vehicle trajectory input data for SSAM are generated by traffic simulation software in a trajectory file format (using a .trj file extension) specially designed for SSAM. SSAM calculates surrogate measures of safety corresponding to each vehicle-to-vehicle interaction and determines whether or not each interaction satisfies the criteria to be deemed an official conflict. A table of all identified conflicts and their corresponding surrogate measures of safety is summarized as an output of SSAM. Figure 2 illustrates the workflow for using SSAM. Figure 2. Chart. Operational concept of SSAM.(6) The user begins the analysis by first enabling output of vehicle interaction (trajectory) data in the simulation model of his or her choice. The traffic engineer then runs the simulation model for a number of iterations—replications with alternate random number seeds—to obtain a statistically sufficient set of simulation output data. The user then launches the standalone SSAM application. The user defines a new conflict analysis case by using the menus to create a new case file or, alternatively, to open an existing case file. The software uses two threshold values for surrogate measures of safety to delineate which vehicle-to-vehicle interactions are classified as conflicts. These two thresholds are applied to the values TTC and PET. The software provides default threshold values for these measures, which the analyst may override with his or her preferred alternate values. SSAM utilizes a default TTC value of 1.5 s, as suggested in previous research. Once the conflict identification thresholds are determined, the user processes the simulation (trajectory) data to identify vehicle-to-vehicle interactions that satisfy the conflict classification criteria. Each conflict identified during analysis, including data from the trajectory files of all corresponding replications of the simulation, is listed with conflict details, including the time, location, and all surrogate measures of safety for that conflict. The algorithms used by SSAM to identify conflicts to be processed from the vehicle trajectory files are time intensive depending on the size of the .trj file, which is a function of the number of vehicles in the network model and the amount of time simulated. A high-end computer might require more than 10 min to process data from 5 h of traffic for a single intersection model. Large multi-intersection networks might require hours of processing time. The following steps summarize the technique used to identify conflicts: Step 1: Determine the dimensions of the analysis area based on the header name in the .trj file. These dimensions define the width and height of a rectangular analysis area and indicate if trajectory data are provided in English or metric units. SSAM constructs a zone grid to cover the entire rectangular analysis area, as shown in figure 3. Individual square zones cover 50-ft by 50 ft areas. By dividing the region into these zones, the number of vehicle-to-vehicle comparisons necessary to identify potential conflicts is reduced considerably. Figure 3. Illustration. SSAM's zone grid(6) Step 2: Analyze a single time-step of a trajectory file. For each vehicle in the analysis region, SSAM projects that vehicle's expected location as a function of its current speed if it were to continue traveling along its path for up to the duration of the configured TTC value. A vehicle's projected path is based on a look ahead over the next 10 s of trajectory data. The path, as shown in figure 4, is a set of straight line segments (labeled S) connecting the vehicle's future downstream locations (labeled X). The threshold TTC value is configured by the user of SSAM, typically with a threshold value of order of 1.5 s. Conflicts with TTC values larger than 1.5 s are not generally considered in the safety community to be severe enough events for recording in a traditional field conflict study. Figure 4. Illustration. Vehicle path.(6) The process of projecting the distance that a vehicle may progress forward during the specified look-ahead time interval and the calculation of the exact coordinates of that projected vehicle position occur as follows, assuming SSAM is going to analyze the conflicts for vehicle A at time t1. First, SSAM extracts all data related with vehicle A from the trajectory file, such as vehicle A's location, speed, acceleration, etc., at time t1 and several time-steps after t1. Each location is denoted as (x1,y1), (x2,y2), etc. Then, SSAM projects vehicle A's distance forward along its trajectory, defined by the following locations:
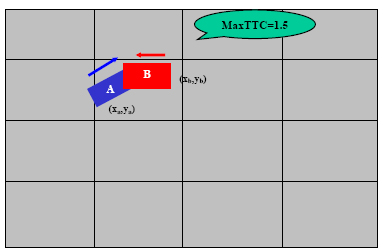
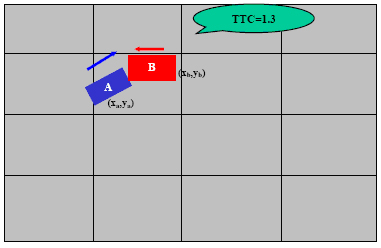
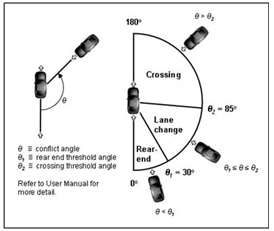
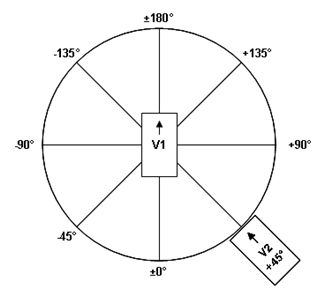
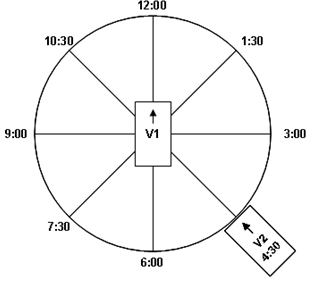
Figure 5. Illustration. Conflict types by angle.(6) Step 3: For each vehicle, calculate the rectangular perimeter delineating the location and orientation of that vehicle at its projected future position. Overlay that rectangle on the zone grid, calculating which rectangular zones in the grid will contain at least some portion of that vehicle. For each zone the vehicle will occupy, add that vehicle to a list of occupants maintained for each zone. Any time a vehicle is added into a zone that currently contains one or more other vehicles, check for overlap of the new vehicle (rectangle) with each of the other vehicles (rectangles) in that zone. It is possible that two vehicles may partially occupy the same zone without overlapping. However, two overlapping rectangles indicate that a future collision is projected for this pair of vehicles, and therefore, a potential conflict has been identified, as portrayed in Figure 6. SSAM maintains a list of all conflicting vehicle pairs (all conflict events) for the current time-step. For each time-step, the list is prepopulated with all conflicting vehicle pairs from the prior time-step. If the current vehicle being added to the zone grid overlaps with any other vehicle, that vehicle pair would be added to the conflict list for the current time-step, if not already in the list. Figure 6. Illustration. Checking a conflict between two vehicles at MaxTTC.(6) Step 4: Continue so that SSAM can perform more detailed processing of each conflicting vehicle pair in the list for the current time-step. First, update the TTC of the vehicle pair. This is done by iteratively shortening the future projection timeline by a tenth of second and reprojecting both vehicles over successively shorter distances until the pair of vehicles no longer overlaps in their projected locations. In this way, a more accurate TTC value is established for this time-step. This is portrayed in Figure 7, where the TTC values have reduced from the maxTTC value of 1.5 s (illustrated in Figure 6) to a TTC value of 1.3 s. Instead of the large overlap in Figure 6, the vehicles in Figure 7 have just barely come into contact. Note that if the projection timeline reduces to 0 s and the vehicles still overlap, this is a crash. Figure 7. Illustration. Checking a conflict between two vehicles at TTC = 1.3 s (vehicles no longer in conflict).(6) At this point, various surrogate measures of safety, such as the minTTC, taking the minimum of the current TTC value and that of the prior time-step, are calculated and updated. Also, the current (actual) positions of both vehicles are recorded for postencroachment analysis. If it was found that the vehicle pair does not overlap over any projected time between zero and maxTTC, then this vehicle pair is in the conflict event list by virtue of being in the list during the prior time-step. In this case, the event remains in the list, watching for the trailing vehicle to eventually occupy, or encroach on, a position formerly held by the leading vehicle. The time differential between when the leading vehicle occupied this location and the trailing vehicle arrived is the PET. If a postencroachment was observed, then the minimum PET is updated, and this conflict event remains in the list, as the postencroachment could potentially reduce as the vehicle trajectories progress over time. If a vehicle pair in the conflict event list is no longer on an imminent collision course and it is clear that PET to any prior positions could not further reduce the minimum PET or if the maximum PET has elapsed, then this vehicle pair is identified for removal from the conflict event list. Prior to removal, all final surrogate measures are computed, including conflict starting and ending points, conflict angles, minimum TTC, and the change between conflict velocity (DeltaV). Also, the conflict is classified at this time as a crossing, rear-end, and/or lane-change conflict. If this conflict event has ended, then the conflict and all surrogate measures are added to the conflict table, and the event is removed from the tracking list. 3.3.3 Definitions of Surrogate Measures Computed by SSAMSSAM's user manual defines several surrogate measures as follows:(6)
3.3.4 SSAM Data Terms and DefinitionsSSAM computes and records the following data or measures for each conflict identified in the vehicle-trajectory input data.(6) This information is provided in the conflicts table on the conflicts panel. It is possible to filter out several of the conflicts based on specified ranges of these values using the Filter tool. These data may also be exported for use in other third-party processing software, such as Microsoft Excel®, where more complicated analysis options may be available. The following are used in SSAM:
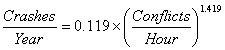
3.3.5 Validation of the SSAM ApproachSSAM was validated in 2008 using an extensive database of 83 intersections. All were four-legged urban signalized intersections.(6) Researchers conducted theoretical validation, field validation, and sensitivity analysis. The theoretical validation effort considered 11 pairs of intersection designs (e.g., right-turn bay versus no right-turn bay, SPUI versus diamond interchange, roundabout versus diamond interchange). The relative safety assessments of SSAM were compared to assessments using traditional theoretical crash-prediction equations. The results yielded interesting insights. It was often the case that design A might have more total conflicts than design B, while design B had higher severity conflicts than design A, pointing to the need for further research in interpreting and comparing surrogate measures of safety. The field validation effort was concerned with the absolute accuracy of surrogate safety assessment, in contrast to the relative safety assessments of the theoretical validation. A total of 83 intersections were used in the validation study by modeling in VISSIM® and assessing with SSAM. The conflict analysis results of the intersections were compared to actual crash histories, based on insurance claims records, using five statistical tests. This effort also provided an opportunity for benchmark comparison of surrogate safety estimates versus traditional crash-prediction models based on average daily traffic (ADT) volumes. The simulation-based intersection conflicts data provided by SSAM were significantly correlated with the crash data collected in the field, with the exception of conflicts during path-crossing maneuvers (e.g., left turns colliding with opposing through traffic), which were underrepresented in the simulation results. Intersection rankings based on total conflict frequency were weakly correlated with intersection rankings based on total crash frequency with a Spearman rank coefficient of 0.463 and were similarly correlated for rear-end and lane-change incidents. The relationship between total conflicts and total crashes in the validation study, as shown in equation 3, exhibited a correlation (R2 = 0.41).
This correlation of conflicts to crashes, albeit weak, is consistent with the range of correlations reported in several studies between ADT and crashes for urban, signalized intersections. This result was achieved despite simulating only morning peak-hour volumes. Crash prediction models based on a yearly average of 24-h ADT volumes exhibited a correlation (R2 = 0.68) with actual crash frequencies. This study also found an average conflict-to-crash ratio of approximately 20,000 to 1, though that ratio varied by conflict type.(6) The sensitivity analysis compared the performance of 5 intersections (taken from the aforementioned 83) implemented in each of the following microsimulation models: VISSIM®, Aimsun, Paramics, and TEXAS. Crashes, vehicles driving through each other, were found in all simulations, and SSAM proved particularly useful in revealing questionable simulated behavior in the models. This has notably prompted some revisions (so far by TEXAS and VISSIM®) to improve the behavior of the underlying simulation models.(6) |