U.S. Department of Transportation
Federal Highway Administration
1200 New Jersey Avenue, SE
Washington, DC 20590
202-366-4000
Federal Highway Administration Research and Technology
Coordinating, Developing, and Delivering Highway Transportation Innovations
 |
| This report is an archived publication and may contain dated technical, contact, and link information |
|
Publication Number: FHWA-HRT-10-038
Date: October 2010 |
|||||||||||||||||||||||||||||||||||||||||||||||||||||||||||||||||||||||||||||||||||||||||||||||||||||||||||||||||||||||||||||||||||||||||||||||||||||||||||||||||||||||||||||||||||||||||||||||||||||||||||||||||||||||||||||||||||||||||||||||||||||||||||||||||||||||||||||||||||||||||||||||||||||||||||||||||||||||||||||||||||||||||||||||||||||||||||||||||||||||||||||||||||||||||||||||||||||||||||||||||||||||||||||||||||||||||||||||||||||||||||||||||||||||||||||||||||||||||||||||||||||||||||||||||||||||||||||||||||||||||||||||||||||||||||||||||||||||||||||||||||||||||||||||||||||||||||||||||||||||||||||||||||||||||||||||||||||||||||||||||||||||||||||||||||||||||||||||||||
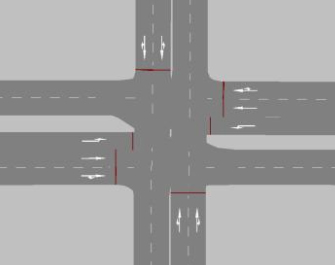
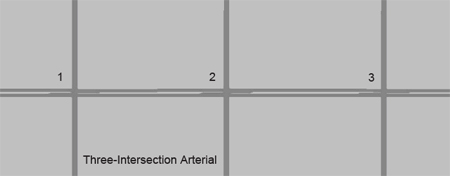
Balancing Safety and Capacity in an Adaptive Signal Control System — Phase 14.0 STUDY SCENARIOS AND SURROGATE MEASURES OF SAFETY4.1 Intersection and Arterial ConfigurationsAs previously stated, the objective of this research was to identify relationships between signal timing parameters and surrogate measures of safety such as rear-end, crossing (angle), and lane-change conflicts. There are thousands of combinations of signal timing, traffic demand conditions, and intersection lane configuration scenarios that could be tested. The first phase of this project, limited in both budget and time, focused on testing the relationship and effect of the individual signal timing parameters on safety by means of quantifying surrogate measures of safety. Therefore, the research team identified and selected several test scenarios for a single signalized intersection as well as a three-intersection arterial. Signal timing parameters including cycle length, spilt, offset, detector extension time, and phase-change interval were selected for testing, along with options for left-turn phasing and left-turn phase sequence. Only one geometric configuration, however, was used in this initial analysis as shown in Figure 12 and Figure 13. Figure 12. Illustration. Three-intersection arterial. Figure 13. Illustration. Arterial configuration used in simulation tests. The intersection configuration included two through lanes on the main street, with an exclusive left-turn lane in each approach and right-turn movements sharing the through lanes. The side streets had two through lanes, with left- and right-turn movements sharing the through lanes. Speeds on the main and side streets were 45 mi/h and 30 mi/h, respectively. The baseline scenario for traffic demand for both the single intersection and the three-intersection arterial assumed a V/C ratio of 0.85 for all movements at the intersection. Left-turn phases on the main streets were lead-lead, while the side streets had permissive left turns only. The baseline condition for the arterial spacing between the first and second intersection and second and third intersection was 1,320 ft and 1,500 ft, respectively. Table 3 through Table 17 summarize each of the conditions tested and the means to identify a relationship between signal timing and safety. Specifically, the following scenarios were tested for their impact on safety, that is, the number of conflicts generated from the SSAM model: Single intersection:
Arterial baseline:
4.2 Surrogate Measures of Safety and Study ScenariosTable 3 through Table 17 present the test cases that were analyzed in this research. Each table lists the geometry, signal timing parameters, volume levels, and various other inputs tested in the scenario. Below each table is a brief description of the analysis approach for each test related to the use of Synchro™, VISSIM®, and SSAM and the expectations for the results. The primary surrogate measures used in this project were the total numbers of rear-end, crossing, and lane-change conflicts as computed by SSAM. Total average intersection delay per vehicle and the Performance Index (PI), a composite measure of stops, delays, and queues, were recorded from the Synchro™ model, and the approach delay was also recorded from the VISSIM® model. These measures were noted specifically to validate the relative accuracy of input and output from the Synchro™ and VISSIM® models before the trajectory files were analyzed in SSAM. Overall, it was found that the results for the delay measures from both models were relatively similar. Table 3. Single intersection base condition.
Scenario condition: Set up a base condition with an optimized cycle length and splits. Expectations: Base condition is used as the basis for comparative analysis with other scenarios. Synchro™: Record delay and PI for each optimization. VISSIM®: Export Synchro™ files to VISSIM® and perform six 60-min simulations with random seeding. Record total intersection delay, cycle length utilized, and total vehicles simulated. SSAM: Export trajectory files from VISSIM® to SSAM for all simulations and average results.
Table 4. Effects of changes in traffic demand under a fixed cycle length.
Scenario condition: Change settings in Synchro™. Use optimum cycle length, vary demand volumes for V/C ratios of 0.3, 0.5, 0.7, 0.85, and 1.0, and optimize splits. Transfer files to VISSIM®. Expectations: This condition is expected to determine if there is any relationship between demand volumes and safety using optimized splits within a fixed cycle length. Increasing or reducing traffic demand is expected to create an increase in the frequency of conflicts, especially at the higher V/C ratios but not necessarily at the lower V/C ratios. Synchro™: Record PI for each optimization. VISSIM®: Export Synchro™ files to VISSIM® and perform five 60-min runs with random seeding. Record total intersection delay, cycle length utilized, and total vehicles simulated. SSAM: Export trajectory files from VISSIM® to SSAM for all runs and average results.
Table 5. Effects of changes in splits.
Scenario condition: Use Synchro™ to add ±10 percent, ±20 percent, and ±30 percent to splits, thus increasing the cycle length but do not optimize it. Transfer files to VISSIM®. Expectations: This condition is expected to determine if there is any relationship between splits and safety. This scenario should be compared specifically to the base condition in Table 3. Increasing or reducing splits from the baseline condition is expected to create a marginal noticeable effect on increasing or reducing the number of conflicts. Synchro™: Make changes in Synchro™ and record PI for each condition. VISSIM®: Export Synchro™ files to VISSIM® and perform six 60-min runs with random seeding. Record total intersection delay, cycle length utilized, and total vehicles simulated. SSAM: Export trajectory files from VISSIM® to SSAM for all simulations and average results.
Table 6. Effects of changes in cycle length.
Scenario condition: Use Synchro™ to vary demand volumes for V/C ratios of 0.3, 0.5, 0.7, 0.85, and 1.0 and optimize cycle length and splits. Transfer files to VISSIM®. Expectations: This condition is expected to determine if there is any relationship between optimized timing (cycle length and splits) for various traffic volumes and safety. This scenario should be compared specifically to the base condition in Table 3. Increasing or reducing traffic demand and also optimizing the timing plans is expected to produce a less noticeable effect on either increasing or reducing the number of conflicts. If so, then it would be clear that cycle length has a direct effect on safety. Synchro™: Record PI for each optimization. VISSIM®: Export Synchro™ files to VISSIM® and perform six 60-min runs with random seeding. Record total intersection delay, cycle length utilized, and total vehicles simulated. SSAM: Export trajectory files from VISSIM® to SSAM for all runs and average results.
Table 7. Effects of changes in the main street detector extension setting.
Scenario condition: Use VISSIM® directly and change only main street detector setting by +2, +1, -2, -1.5, and -1 s. Expectations: This condition is expected to determine if there is any relationship between changing detector settings on the main street and safety. This scenario should be compared specifically to the base condition in Table 3. Reducing the detector setting (gap extension) is expected to produce a noticeable effect on increasing the number of conflicts. Synchro™: Make changes in Synchro™ and record PI for each condition. VISSIM®: Use baseline file in VISSIM®, change detector settings, and perform six 60-min runs with random seeding. Record total intersection delay, cycle length utilized, and total vehicles simulated. SSAM: Export trajectory files from VISSIM® to SSAM for all runs and average results.
Table 8. Effect of changes in the side street detector extension setting.
Scenario condition: Use VISSIM® directly and change only side street detector setting by +2, +1, -2, -1.5, and -1 s. Expectations: This condition is expected to determine if there is any relationship between changing detector settings on the side street and safety. This scenario should be compared specifically to the base condition in Table 3. Reducing the detector setting (gap extension) is expected to produce a noticeable effect on increasing the number of conflicts. Synchro™: Make changes in Synchro™ and record PI for each condition. VISSIM®: Use baseline file in VISSIM®, change detector settings, and perform six 60-min runs with random seeding. Record total intersection delay, cycle length utilized, and total vehicles simulated. SSAM: Export trajectory files from VISSIM® to SSAM for all runs and average results.
Table 9. Effects of changes in left-turn phasing from protected only to protected/permissive.
Scenario condition: Optimize timing plans with Synchro™ with the change in volumes and left-turn phasing on main street from protected only to protected/permissive left-turn phasing. Expectations: This condition is expected to determine if there is any relationship between changing left-turn phasing treatment from protected only to protected/permissive and safety. This scenario should be compared specifically to the base condition in Table 3. Changing traffic volumes and left-turn phasing treatment from protected only to protected/permissive is expected to produce a noticeable effect on increasing the number of angle conflicts. Synchro™: Make changes in Synchro™ and record PI for each condition. VISSIM®: Use baseline file in VISSIM®, change detector settings, and perform six 60-min runs with random seeding. Record total intersection delay, cycle length utilized, and total vehicles simulated. SSAM: Export trajectory files from VISSIM® to SSAM for all runs and average results. Table 10. Effects of changes in left-turn phasing from protected to permissive left-turn only.
Scenario condition: Optimize timing plans with Synchro™ with the change in volumes and left-turn phasing on main street from protected only to permissive left-turn phasing. Expectations: This condition is expected to determine if there is any relationship between changing left-turn phasing treatment from protected only to permissive and safety. This scenario should be compared specifically to the base condition in table 3 and the protected/permissive condition in table 9. Changing traffic volumes and left-turn phasing treatment from protected only to permissive is expected to produce a noticeable effect on increasing the number of angle conflicts. Synchro™: Make changes in Synchro™ and record PI for each condition. VISSIM®: Use baseline file in VISSIM®, change detector settings, and perform six 60-min runs with random seeding. Record total intersection delay, cycle length utilized, and total vehicles simulated. SSAM: Export trajectory files from VISSIM® to SSAM for all runs and average results.
Table 11. Effects of changes in the phase-change interval.
Scenario condition: Use VISSIM® directly and change Y+AR on main street. Expectations: This condition is expected to determine if there is any relationship between changing the change and clearance intervals and safety. This scenario should be compared specifically to the base condition in table 3. Changing the Y+AR intervals is expected to produce a noticeable effect on increasing the number of rear-end and angle conflicts. Synchro™: Make changes in Synchro™ and record PI for each condition. VISSIM®: Use baseline file in VISSIM®, change Y+AR, and perform six 60-min runs with random seeding. Record total intersection delay, cycle length utilized, and total vehicles simulated. SSAM: Export trajectory files from VISSIM® to SSAM for all runs and average results.
Table 12. Arterial base condition with arterial traffic demand of V/C = 0.85.
Scenario condition: Set up a base condition with an optimized cycle length and splits for three intersections with optimized offsets. Expectations: Base condition is used as the basis for comparative analysis with other scenarios. Synchro™: Record PI for each condition. VISSIM®: Export Synchro™ files to VISSIM® and perform six 60-min runs with random seeding. Record total intersection delay, cycle length utilized, and total vehicles simulated. SSAM: Export trajectory files from VISSIM® to SSAM for all runs and average results.
Table 13. Arterial base condition with changes in arterial traffic demand to V/C = 1.0.
Scenario condition: Set up a base condition with an optimized cycle length and splits for three intersections with optimized offsets. Expectations: Base condition is used as the basis for comparative analysis with other scenarios. Synchro™: Record PI for each condition. VISSIM®: Export Synchro™ files to VISSIM® and perform six 60-min runs with random seeding. Record total intersection delay, cycle length utilized, and total vehicles simulated. SSAM: Export trajectory files from VISSIM® to SSAM for all runs and average results.
Table 14. Effects of changes in offsets with cycle length of 50 s.
Scenario condition: Change offsets at second intersection only by ±10, ±20, and ±30 percent of cycle length. Expectations: It is expected that a change in the offsets will result in an increase in the number of rear-end conflicts. Synchro™: Record PI for each condition. VISSIM®: Export Synchro™ files to VISSIM® and perform six 60-min runs with random seeding. Record total intersection delay, cycle length utilized, and total vehicles simulated. SSAM: Export trajectory files from VISSIM® to SSAM for all runs and average results.
Table 15. Effects of changes in offsets with cycle length of 105 s.
Scenario condition: Change offsets at second intersection only by ±10, ±20, and ±30 percent. Expectations: It is expected that a change in the offsets will result in an increase in the number of rear-end conflicts. Synchro™: Record PI for each condition. VISSIM®: Export Synchro™ files to VISSIM® and perform six 60-min runs with random seeding. Record total intersection delay, cycle length utilized, and total vehicles simulated. SSAM: Export trajectory files from VISSIM® to SSAM for all runs and average results.
Table 16. Effects of changes in left-turn phase sequence to lead-lag, 50-s cycle length.
Scenario condition: Base condition with optimized left-turn phase sequence and offsets. Either change directly in VISSIM® after running in Synchro™ or export from Synchro™ to VISSIM®. Expectations: It is expected that an optimum left-turn phase sequence will result in a reduced number of rear-end and angle conflicts. Synchro™: Record PI for each condition. VISSIM®: Export Synchro™ files to VISSIM® and perform six 60-min runs with random seeding. Record total intersection delay, cycle length utilized, and total vehicles simulated. SSAM: Export trajectory files from VISSIM® to SSAM for all runs and average results.
Table 17. Effects of changes in left-turn phase sequence to lead-lag, 105-s cycle length.
Scenario condition: Base condition with optimized left-turn phase sequence and offsets. Either change directly in VISSIM® after running in Synchro™ or export from Synchro™ to VISSIM®. Expectations: It is expected that an optimum left-turn phase sequence will result in a reduced number of rear-end and angle conflicts. Synchro™: Record PI for each condition. VISSIM®: Export Synchro™ files to VISSIM® and perform six 60-min runs with random seeding. Record total intersection delay, cycle length utilized, and total vehicles simulated. SSAM: Export trajectory files from VISSIM® to SSAM for all runs and average results. |