Human Factors Literature Reviews on Intersections, Speed Management, Pedestrians and Bicyclists, and Visibility
PDF Version (2.12 MB)
PDF files can be viewed with the Acrobat® Reader®
3.0 RESULTS
3.1 INTRODUCTION
This section of the compendium of human factors research summarizes work primarily associated with normal driving conditions (i.e., driving situations that do not generally involve degraded driving or imminent crash conditions). This area includes general review documents and human factors documents that involve the design of in–vehicle communications and information systems, and documents in the driver distraction and workload area.
This section presents the individual reviews conducted in this effort and includes four subsections corresponding to four unique technical areas:
- Intersections.
- Speed Management.
- Pedestrians and Bicycles.
- Visibility.
Within each of these subsections, individual reviews are presented alphabetically, by first author.
3.2 INTERSECTIONS
The following subsection contains reviews for the Intersections topic.
| Title
Accident Analysis of Older Drivers at Intersections
(FHWA–RD–94–021)
|
Funding Agency and Contact Address
Federal Highway Administration
6300 Georgetown Pike
McLean, VA 22101–2296
COTR:
Not Specified |
| Authors Anonymous |
| Publication Date 1995 |
Number of Pages 5 |
| Document Web Site http://www.tfhrc.gov/safety/hsis/94-021.htm |
| Source Type Crash/Demographics Statistical Analysis |
| Driving Conditions Normal |
Vehicle Platforms Not Specified |
| Objective
To examine the specific nature of intersection–related crashes involving elderly drivers through a detailed analysis of crash data from the Highway
Safety Information System (HSIS). |
| General Approach
The analyses were conducted as part of the FHWA research study, "Traffic Operations Control for Older Drivers." The authors used HSIS data from
1985 to 1987 in Minnesota and Illinois for this research. |
Methods
- For all of the analyses, comparisons were made among three age groups: (1) "young elderly" (ages 65 to 74), (2) "old elderly" (age
75 and older), and (3) a middle–aged comparison group (ages 30 to 50).
- The crash types at both urban and rural signalized and stop–controlled intersections were examined separately, as well as the type of vehicle
maneuver prior to the crash and the investigating officer’s judgment regarding "causal" factors.
|
| Key Terms Aged Drivers, Intersections, Traffic Accidents, Accident Data, Elderly Drivers, Older Drivers |
Key Results
The general analyses of crash type in both States indicated that at both urban and rural signalized intersections, elderly drivers were less likely
than their middle–aged counterparts to be involved in rear–end collisions, but more likely to be involved in left–turn and angle
collisions. In both States, right–angle collisions presented a particular problem for elderly drivers at both urban and rural stop–controlled
intersections. For turning collisions at urban and rural signalized intersections, middle–aged drivers tended to have been going straight, while older
drivers were more likely to have been turning left, and were slightly more likely to be turning right and turning right on red (see table below). In right–angle collisions at both urban and rural stop–controlled intersections, elderly drivers were more likely than middle–
aged drivers to have been starting from a stop. In turning collisions, they were more likely to be turning left or right across traffic. The examination of the "contributing factors" cited by the officer showed that the middle–aged driver was consistently more likely
to have been cited as having exhibited "no improper driving," while the elderly drivers were more likely to have been cited for "failure
to yield."
Table A. Percentage of involvement for selected precrash maneuvers for turning collisions at signalized intersections (Illinois data).
| |
Driver Age in Years |
| 30–50 |
65–74 |
75+ |
| Urban Signalized Intersections |
(1,921) |
(1,246) |
(655) |
| Going straight |
62.1 |
26.9 |
18.6 |
| Turning left |
25.4 |
56.5 |
66.9 |
| Turning right |
7.4 |
12.4 |
10.7 |
| Slowing/stopping |
2.7 |
1.8 |
1.2 |
| Right turn on red |
0.3 |
1.4 |
1.8 |
| Rural Signalized Intersections |
(39) |
(22) |
(17) |
| Going straight |
51.3 |
31.8 |
17.7 |
| Turning left |
35.9 |
45.5 |
52.9 |
| Turning right |
7.7 |
18.2 |
17.7 |
|
Conclusions, Recommendations, Best Practices, Design Implications, or Design Guidelines
- The crash analyses indicated that both the "young elderly" (ages 65 to 74) and the "old elderly" (age 75 and older) appear to have
problems at intersections.
- These problems often involve left–turning maneuvers (at signalized intersections) and turning or "entering" maneuvers at stop–
controlled intersections.
- It appears that the problems experienced by elderly drivers involved in crashes either relate to the difficulties in distinguishing target vehicles
from surrounding clutter, judging the closing speeds of target vehicles, and/or an inability to use the acceleration capabilities of the cars they are
driving.
|
| General Comments None |
| Title Guidance for Implementation of the AASHTO Strategic Highway Safety Plan, Volume 12: A Guide for Reducing Collisions
at Signalized Intersections, NCHRP Report 500 |
Funding Agency and Contact Address
National Cooperative Highway
Research Program
Transportation Research Board
500 Fifth Street, N.W.
Washington, DC 20001
COTR:
Not Specified |
| Authors Antonucci, N.D., Hardy, K.K., Slack, K.L., Pfefer, R., and Neuman, T.R. |
| Publication Date 2004 |
Number of Pages 133 |
| Document Web Site http://www.trb.org/publications/nchrp/nchrp_rpt_500v12.pdf |
| Source Type Guidelines |
| Driving Conditions Normal | Vehicle Platforms All |
| Objective This implementation guide provides guidance to highway agencies that want to implement safety improvements at
signalized intersections and includes a variety of strategies that may be applicable to particular locations. While the focus of the strategies discussed in
this guide is on reducing fatalities at signalized intersections, the implementation of many of these strategies will probably lead to an overall reduction in
intersection crashes. |
| General Approach See Methods. |
| Methods
The strategies in this guide were identified from a number of sources, including recent literature, contact with State and local agencies throughout the
United States, and Federal programs. Some of the strategies are widely used, while others are used at a State or local level in limited areas. Some have been
subjected to well–designed evaluations to prove their effectiveness. On the other hand, it was found that many strategies, including some that are
widely used, have not been adequately evaluated.
The implication of the widely varying experience with these strategies, as well as the range of knowledge about their effectiveness, is that the reader
should be prepared to exercise caution in many cases before adopting a particular strategy for implementation. To help the reader, the strategies have been
classified into three types, each identified by a letter symbol throughout the guide: Proven (P), Tried (T), and Experimental (E).
Guidance for implementation of the American Association of State Highway and Transportation Officials (AASHTO) Strategic Highway Safety Plan (SHSP) is
provided. An overview of an 11–step model process for implementing the program of strategies is presented.
|
| Key Terms Highway Safety, Signalized Intersections, Intersection Crashes, Collision Reduction, Guidelines |
| Key Results
Most of the strategies in this guide are low–cost, short–term treatments to improve safety at signalized intersections, consistent with the focus
of the entire AASHTO SHSP. For each of these strategies, a detailed discussion of the attributes, effectiveness, and other key factors is presented. Several
higher cost, longer term strategies that have been proven effective in improving safety at signalized intersections are also presented, but in less detail.
Safety improvement measures include geometric design modifications, changes to traffic control devices, enforcement, and education.
|
| Conclusions, Recommendations, Best Practices, Design Implications, or Design Guidelines The table below lists the
objectives and related strategies for improving safety at signalized intersections.
Table A. Emphasis area objectives and strategies.
| Objectives |
Strategies |
| 17.2 A |
Reduce frequency and
severity of intersection
conflicts through traffic
control and operational
improvements |
|
| 17.2 A1 |
Employ multiphase signal operation (P, T) |
| 17.2 A2 |
Optimize clearance intervals (P) |
| 17.2 A3 |
Restrict or eliminate turning maneuvers (including right turn on red) (T) |
| 17.2 A4 |
Employ signal coordination along a corridor or route (P) |
| 17.2 A5 |
Employ emergency vehicle preemption (P) |
| 17.2 A6 |
Improve operation of pedestrian and bicycle facilities at signalized
intersections (P, T) |
| 17.2 A7 |
Remove unwarranted signal (P) |
|
| 17.2 B |
Reduce frequency and
severity of intersection
conflicts through
geometric improvements
|
|
| 17.2 B1 |
Provide/improve left–turn channelization (P) |
| 17.2 B2 |
Provide/improve right–turn channelization (P) |
| 17.2 B3 |
Improve geometry of pedestrian and bicycle facilities (P, T) |
| 17.2 B4 |
Revise geometry of complex intersections (P, T) |
| 17.2 B5 |
Construct special solutions (T) |
|
| 17.2 C |
Improve sight distance at
signalized intersections |
|
| 17.2 C1 |
Clear sight triangles (T) |
| 17.2 C2 |
Redesign intersection approaches (P) |
|
| 17.2 D |
Improve driver awareness
of intersections and signal
control |
|
| 17.2 D1 |
Improve visibility of intersections on approach(es) (T) |
| 17.2 D2 |
Improve visibility of signals and signs at intersections (T) |
|
| 17.2 E |
Improve driver
compliance with traffic
control devices |
|
| 17.2 E1 |
Provide public information and education (PI&E) (T) |
| 17.2 E2 |
Provide targeted conventional enforcement of traffic laws (T) |
| 17.2 E3 |
Implement automated enforcement of red–light running (cameras) (P) |
| 17.2 E4 |
Implement automated enforcement of approach speeds (cameras) (T) |
| 17.2 E5 |
Control speed on approaches (E) |
|
| 17.2 F |
Improve access
management near
signalized intersections |
|
| 17.2 F1 |
Restrict access to properties using driveway closures or turn restrictions (T) |
| 17.2 F2 |
Restrict cross–median access near intersections (T) |
|
| 17.2 G |
Improve safety through
other infrastructure
treatments |
|
| 17.2 G1 |
Improve drainage in intersection and on approaches (T) |
| 17.2 G2 |
Provide skid resistance in intersection and on approaches (T) |
| 17.2 G3 |
Coordinate closely spaced signals near at–grade railroad crossings (T) |
| 17.2 G4 |
Relocate signal hardware out of clear zone (T) |
| 17.2 G5 |
Restrict or eliminate parking on intersection approaches (P) |
|
P = Proven, T = Tried, and E = Experimental
Source: Guidance for Implementation of the AASHTO Strategic Highway Safety Plan, Volume 12: A Guide for Reducing Collisions at Signalized
Intersections, National Cooperative Highway Research Program (NCHRP) Report 500, Transportation Research Board, Washington, DC, 2004, p.
V–2. Reprinted with permission.
|
|
General Comments
This report comprises volume 12 of a series of implementation guides addressing the emphasis areas of the AASHTO Strategic Highway Safety Plan, NCHRP
Project 17–18(3).
|
| Title
Statistical Models for At–Grade Intersection Accidents,
Addendum (FHWA–RD–99–094) |
Funding Agency and Contact Address
Office of Safety and Traffic Operations
Research and Development
Federal Highway Administration
6300 Georgetown Pike
McLean, VA 22101–2296
COTR:
Joe Bared
|
| Authors Bauer, K.M., and Harwood, D.W. |
| Publication Date March 2000 |
Number of Pages 68 |
| Document Web Site http://www.tfhrc.gov/safety/ihsdm/libweb.htm |
| Source Type Crash/Demographic Statistical Analysis |
| Driving Conditions Normal |
Vehicle Platforms All |
| Objective
This report is an addendum to the work published in Statistical Models of At–Grade Intersection Accidents (FHWA–RD–96–125)
(Bauer and Harwood, 1996). The objective of both research studies was to develop statistical models of the relationship between traffic crashes and highway
geometric elements for at–grade intersections.
|
| General Approach
While the previously published report used only multiple–vehicle crashes in developing predictive models, this addendum presents models based on all
collision types (including both multiple–vehicle and single–vehicle crashes).
|
Methods
- The statistical modeling approaches used in the research included lognormal, Poisson, and negative binomial regression analyses. The models for
all collision types are similar to those developed in the previous report for multiple–vehicle crashes.
- The analyses include all collision types (i.e., both multiple– and single–vehicle crashes) using 3–year crash frequencies (1990
to 1992) and geometric design, traffic control, and traffic volume data from a database provided by Caltrans (California DOT).
- The data used for the analyses reported in this addendum are in all respects identical to those used for the previous report, except that all
collision types were included in the crash frequencies used as the dependent variable in modeling.
- Statistical modeling results for five specific types of intersections are discussed in this report.
|
| Key Terms
Accident Modeling, Traffic Accidents, Geometric Design, At–Grade Intersections, Poisson Regression,Negative Binomial Regression, Lognormal
Regression
|
Key Results
- The modeling results for crashes if all collision types are combined are similar to those that were found for multiple–vehicle crashes only.
- Geometric design variables accounted for only a small additional portion of the variability.
- Generally, negative binomial regression models were developed to fit the crash data at rural, three– and four–leg, stop–
controlled intersections, and at urban, three–leg, stop–controlled intersections.
- Lognormal regression models were found to be more appropriate for modeling crashes at urban, four–leg, stop–controlled intersections,
and at urban, four–leg, signalized intersections.
- The lognormal and negative binomial regression models developed to represent the relationships between crashes of all collision types and
intersection geometric design, traffic control, and traffic volume variables explained between 16 and 39 percent of the variability in the crash data.
- In all regression models, the major–road average daily traffic (ADT) and crossroad ADT variables accounted for most of the variability in
crash data that was explained by the models. Generally, geometric design variables accounted for only a small additional portion of the variability.
- Because of the overdispersion observed in the crash data, the negative binomial distribution was preferred over the Poisson distribution when
using a loglinear model.
|
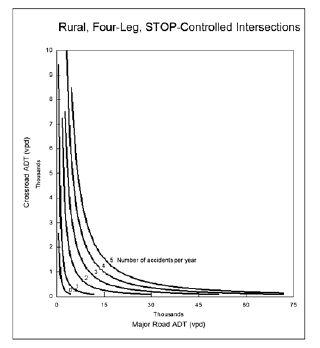
| Figure A. Number of crashes per year as a function of traffic volumes for typical rural, four–leg, stop
–controlled intersections.
|
Figure B. Number of crashes per year as a function of traffic volumes for typical urban, four–leg, stop–
controlled intersections.
|
|
|
|
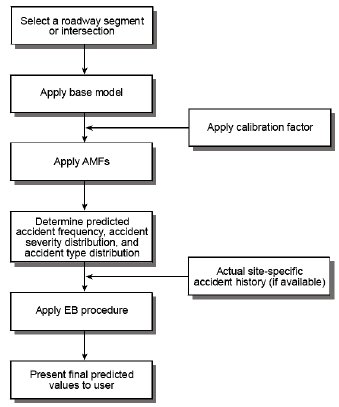
Conclusions, Recommendations, Best Practices, Design Implications, or Design Guidelines
- The negative binomial and lognormal distributions appear to be better suited to modeling of crash relationships than the normal distribution.
- The form of the statistical distribution selected for modeling any particular type of intersection should be chosen based on a review of the
crash frequency distribution for that type of intersection.
- The models do not include the effects for all geometric variables of potential interest to highway designers,and some of the effects they do
include are in a direction opposite to that expected. Furthermore, the goodness of fit of the models is not as high as desired. Therefore, the models
presented here are appropriate as a guide to future research, but do not appear to be appropriate for direct application in the field.
|
| General Comments None |
| Title Statistical Models of At–Grade Accidents (FHWA–RD–96–125) |
Funding Agency and Contact Address Office of Safety and Traffic Operations
Research and Development
Federal Highway Administration
6300 Georgetown Pike
McLean, VA 22101–2296 COTR:
Joe Bared |
| Authors Bauer, K.M., and Harwood, D.W. |
| Publication Date November 1996 |
Number of Pages 157 |
| Document Web Site None |
| Source Type Crash/Demographics Statistical Analysis, Field Test |
| Driving Conditions Normal |
Vehicle Platforms All |
| Objective To develop statistical models of the relationship between traffic crashes and highway geometric elements for
at–grade intersections. |
| General Approach Statistical models were developed based on document reviews from a number of sources and results from
a pilot field study. The review was limited to multiple–vehicle crash data. |
| Methods Several major technical tasks were performed during the research, including:
- A review of previously published and unpublished literature and ongoing studies concerning the relationship between traffic crashes and intersection
geometrics, as well as between traffic crashes and highway geometric design features in general.
- A review of existing policies, guidelines, standards, and practices for design of at–grade intersections.
- A review of existing highway agency files containing geometric design, traffic control, traffic volume, and crash data, including the databases in
the FHWA Highway Safety Information System (HSIS). The Caltrans database was used for developing statistical models and testing statistical
approaches.
- Statistical models for the relationships between traffic crashes and geometrics were developed. Alternative modeling approaches were investigated
based on various assumptions about the distribution of crashes, including the Poisson, lognormal, negative binomial, and logistic distributions.
The goodness of fit of these various alternative models and the role of geometric design variables in those models were assessed. Statistical models
were developed for five specific types of intersections.
- A pilot field study to collect data on additional geometric design variables and turning–movement volumes was conducted at a sample of the
urban, four–leg, signalized intersections in California. Additional statistical analyses incorporating these field data were conducted.
- A review of hardcopy police accident reports was conducted to further investigate the role of geometric design features in the causation of
intersection crashes.
|
| Key Terms Accident Modeling, Traffic Accidents, Geometric Design, At–Grade Intersections, Poisson Regression,
Negative Binomial Regression, Lognormal Regression |
Key Results
- Regression models to determine the relationships between crashes and intersection geometric design, traffic control, and traffic volume variables
based on the negative binomial distribution explained between 16 and 38 percent of the variability in the crash data.
- Models developed to predict total multiple–vehicle crashes generally performed slightly better than did models for fatal and injury multiple
–vehicle crashes.
- In the modeling of crashes for at–grade intersections, overdispersion was commonly observed and,therefore, the negative binomial
distribution was preferred.
- In general, the consideration of major–road ADT and crossroad ADT as separate independent variables provided better modeling results than
consideration of a single variable representing either the sum or the product of the two ADT variables.
- In negative binomial regression models for three of five specific intersection types, the major–road ADT and crossroad ADT variables
accounted for most of the variability in crash data that was explained by the models. Geometric design variables accounted for a very small
additional portion of the variability.
- Addition of field data to the existing data set did not increase the proportion of variation in the crashes that was explained by the lognormal
regression models.
- The models do not include the effects of all of the geometric variables of potential interest to highway designers, and some of the effects they
do include are in a direction opposite to that expected. Furthermore, the goodness of fit of the models is not as high as desired.
Table A. Reviewers’ ratings of number of crashes in which driver,vehicle, and roadway and environmental factors had a role.
| Site |
Reviewer1 |
Reviewer2 |
Reviewer3 |
| Driver Factors |
Vehicle Factors |
Roadway
and
Environment Factors |
Driver Factors |
Vehicle Factors |
Roadway
and
Environment Factors |
Driver Factors |
Vehicle Factors |
Roadway
and
Environment Factors |
|---|
| 2–40 |
8 |
1 |
9 |
9 |
1 |
1 |
8 |
2 |
4 |
| 2–56 |
18 |
0 |
4 |
18 |
0 |
1 |
18 |
0 |
4 |
| 2–41 |
3 |
0 |
3 |
3 |
0 |
3 |
3 |
0 |
3 |
| 2–50 |
34 |
6 |
23 |
35 |
5 |
3 |
34 |
5 |
7 |
| 4–39 |
9 |
0 |
8 |
9 |
0 |
0 |
9 |
0 |
0 |
| 4–99 |
23 |
0 |
19 |
23 |
0 |
0 |
23 |
0 |
0 |
| 4–04 |
25 |
7 |
16 |
23 |
6 |
0 |
23 |
3 |
8 |
| 4–01 |
48 |
2 |
44 |
48 |
3 |
3 |
48 |
2 |
14 |
| Total |
168 |
16 |
126 |
168 |
15 |
11 |
166 |
12 |
40 |
| Percentage |
98.2 |
9.4 |
73.7 |
98.2 |
8.8 |
6.4 |
97.1 |
7.0 |
23.4 |
|
| Conclusions, Recommendations, Best Practices, Design Implications, or Design Guidelines The following conclusions were
reached as a result of the statistical analysis of the relationships between traffic crashes and the geometrics of at–grade intersections conducted
in this research.
- Traditional multiple linear regression is generally not an appropriate statistical approach to modeling of crash relationships because crashes are
discrete, nonnegative events that often do not follow a normal distribution.
- The Poisson, negative binomial, lognormal, and logistic distributions appear to be better suited to modeling of crash relationships than the
normal distribution. In all cases, the form of the statistical distribution selected for any particular modeling should be chosen based on a review of
the data to be modeled.
- Geometric design features explain relatively little of the variability in intersection crash data for at–grade intersections.
- The models presented here are appropriate as a guide to future research, but do not appear to be appropriate for direct application by
practitioners.
|
| General Comments An addendum to this report,Statistical Models of At–Grade Intersection Accidents, Addendum(FHWA–RD–99–094), was released in March 2000 and is reviewed separately. |
| Title Intersection Collision Avoidance Study, Final Report |
Funding Agency and Contact Address Office of Safety
Federal Highway Administration
400 Seventh Street, S.W.
Washington, DC 20590 COTR:
Not Specified |
| Authors Bellomo–McGee, Inc. |
| Publication Date September 2003 |
Number of Pages 79 |
| Document Web Site None |
| Source Type Literature Review, Field Test |
| Driving Conditions Normal |
Vehicle Platforms Not Specified |
| Objective To define and evaluate infrastructure–only Intersection Collision Avoidance System (ICAS) concepts aimed
at reducing the number of intersection crashes. |
| General Approach System engineering analyses were performed to define and evaluate the feasibility and effectiveness of
alternative infrastructure–based advanced technology concepts. These included development of functional requirements and conceptual designs, and
the testing of the feasibility of those designs at high–crash intersections in three States. |
| Methods Literature Review:
- This included a review of crash studies, human factors work related to crash avoidance, and current advanced technology intersection safety
countermeasures. Included in the literature review was an examination of technology, sensors, and displays capabilities.
Crash Analysis:
- Crashes were analyzed at selected sites within the Infrastructure Consortium (IC) States: Minnesota, California, and Virginia.
- Each IC member State identified 20 high–incident intersections for review and analysis.
- Police reports for 3 years of crashes provided a large database for analysis of crossing–path crashes. This database was used
to determine primary crash types and causal factors.
- A final step of this task was to select two sites from each State that would be candidates for implementing advanced intelligent
countermeasures.
Define and Evaluate ICAS Concepts:
- This task included developing several concepts for reducing crossing–path crashes using intelligent vehicle systems and sensors,
communication displays, etc.
Feasibility Testing at the Six Candidate Intersections:
- This was performed by collecting field data and applying it to the requirements of the particular concepts.
|
| Key Terms Intersection, Collision Avoidance, Infrastructure, Intersection Collision Avoidance System |
Key Results
- The project identified certain parameters required for characterizing traffic flow based on current Intelligent Transportation Systems (ITS)
applications/concepts for traffic management.
- Information on human factors issues important to the selection and design of infrastructure–based technology was identified. These
included driver age, vehicle gap acceptance, and response to emergency events.
- The three successive years of data showed that Left Turn Across Path of Opposite Direction (LTAP/OD), Straight Crossing Path (SCP), and Left
Turn Across Path of Lateral Direction (LTAP/LD) crashes were the most frequent types of crash, regardless of whether or not the intersection was
signalized.
- Crashes involving signal violation were mostly a result of not seeing the signal or its indication, or trying to "beat" the amber
signal.
- Inability to judge available gaps in traffic and not seeing right–of–way vehicle were the main causal factors for crashes that did
not involve signal violation.
- Based on the analyses of crashes and casual factors, six intersection collision avoidance concepts were developed. Four of the concepts involve
timely communication of information to at–risk motorists, while the remaining two preempt the normal signal operation to prevent a crash.
- Feasibility analysis data showed that at all of the six candidate intersections, the suggested concept was feasible, based on the vehicle data
collected at the site.
- The result of the cost–benefit analysis indicated that five of the six candidate intersections showed the potential to quickly recoup
the expenses of design and installation of the suggested infrastructure–based collision countermeasure.
|
Conclusions, Recommendations, Best Practices, Design Implications, or Design Guidelines
- Based on this work, it was determined that implementing an ICAS to address each of the three most prevalent types of intersection crashes was
feasible. In addition, the cost–benefit analysis showed a quick recouping of ICAS implementation costs.
- Motorist response to roadside communication devices still requires extensive testing, as this is a critical requirement of several concepts.
- Recommended further studies pertain to increased onsite data collection to validate preliminary findings and human factors testing to meet the
functional requirements of the operational concepts. Human factors testing consists of the evaluation of communications modes to inform and warn
motorists.
|
| General Comments None |
| Title Driver Understanding of Protected and Permitted Left–Turn Signal Displays (Transportation Research
Record 1464, pp. 42–50) |
Funding Agency and Contact Address Civil Engineering Department
University of Nebraska–Lincoln
Lincoln, NE 68588–0531 COTR:
Not Specified |
| Authors Bonneson, J.A., and McCoy, P.T. |
| Publication Date 1994 |
Number of Pages 9 |
| Document Web Site None |
| Source Type Survey |
| Driving Conditions Normal |
Vehicle Platforms Not Specified |
| Objective To determine if some protected and permitted left turn (PPLT) signal designs cause more confusion and
operational and safety problems for drivers than others. |
| General Approach Driver comprehension of PPLT signal designs was evaluated by conducting a survey of 1,610 drivers.
The survey included a perspective view of an intersection approach and its traffic signal display, followed by multiple–choice questions about
the correct driving action. |
| Methods Survey Questionnaire:
- On each survey, one perspective view of an intersection approach was shown at the top of the page and two multiple–choice questions
asked the correct identification of a particular indication type.
- The survey questions focused on the following four display indications in six different PPLT designs:
- Permitted left turn: Green ball for both the left turn and through movements.
- Protected left turn only: Left–turn green arrow and through red ball, consistent with the Manual on Uniform Traffic Control
Devices (MUTCD) specifications.
- Overlapped left turn and through: Left–turn green arrow and through green ball.
- Protected/Modified left turn only: Displayed only the green arrow in the PPLT signal head without the red ball.
- The six PPLT designs varied in terms of the location of the signal head with respect to the lane line, the arrangement of the lenses in the s
ignal head, and the inclusion of an auxiliary sign.
Distribution Method:
- Survey was administered in three of Nebraska’s largest cities: Omaha, Lincoln, and Grand Island.
- Survey was administered in person at the local department of motor vehicles in each city.
|
| Key Terms Protected and Permitted Left Turn, Signal Design, Intersection Safety |
| Key Results Survey Demographics:
- Only 70 percent of the survey respondents correctly understood the meaning of the PPLT signal design.
- There was a trend toward a decreased understanding of the PPLT designs with increased age and driving experience.
- There was also a trend toward better understanding with more education.
Design Comparisons:
- The results indicated that drivers appear to have the best understanding of the exclusive vertical PPLT design. The difference in the results for
this design and the least understood design is about 8 percent (see table).
- None of the differences between each design is significantly different. Although the differences suggest that some designs are better understood,
a larger number of responses would be needed to confirm these trends.
- With regard to differences in understanding the various indications, the results indicate that the overlap indication is least understood (only
about one–half of the drivers surveyed answered this question correctly).
Signal–Head Location and Sign Use:
- The exclusive head location increased driver understanding by about 4 to 5 percent over the shared head location.
- The results indicated that designs with a sign decrease driver understanding by about 6.5 percent. It was found that the use of a sign tends
to confuse more drivers during the overlap and protected phases than it helps during the permitted phase.
Table A. Driver understanding of selected PPLT designs.
PPLT Design
(Figure No.) |
Display Indication |
Total |
| Permitted |
Overlap |
Protected |
| 3 with sign |
0.824a <–high
119b |
0.409
115 |
0.664
119 |
0.635
353 |
| 2 |
0.796
113 |
0.658 <–high
114 |
0.619
113 |
0.691
340 |
| 3 no sign |
0.658
114 |
0.643
112 |
0.798
114 |
0.700
340 |
| 4 |
0.800
115 |
0.500 <–low
114 |
0.826
115 |
0.709 <–high
344 |
| 5 |
0.658
114 |
0.539
115 |
0.851 <–high
114 |
0.682
343 |
| 6 |
0.761
117 |
0.607
117 |
0.530 <–low
117 |
0.632 <–low
351 |
| 7 |
0.626 <–low
115 |
0.500 <–low
116 |
0.835
115 |
0.653
346 |
| Total |
0.732
807 |
0.550
803 |
0.731
807 |
0.671
2417 |
aProportipon of correct responses.
bNumber of responses
This summary of responses includes the responses to only three of the four indication combinations: Permitted, Overlap, and Protected/MUTCD. |
From Transportation Research Record 1464, Transportation Research Board, National Research Council, Washington, DC, 1994,
table 2, p. 48. Reprinted with permission.
|
Conclusions, Recommendations, Best Practices, Design Implications, or Design Guidelines
- The survey results indicated that the exclusive vertical PPLT design is correctly understood by the highest proportion of drivers.
- Of the three indications considered, the overlap indication is understood by the smallest number of respondents.
- The survey results indicate that drivers are better able to understand PPLT designs with any of the following characteristics: Modified
protected indication, PPLT head centered over the opposing left–turn lane, and no auxiliary sign.
|
| General Comments None |
| Title Review and Evaluation of Factors That Affect the Frequency of
Red–Light Running (FHWA/TX–02/4027–1) |
Funding Agency and Contact Address Federal Highway Administration
6300 Georgetown Pike
McLean, VA 22101–2296 COTR:
Not Specified |
| Authors Bonneson, J., Brewer, M., and Zimmerman, K. |
| Publication Date September 2001 |
Number of Pages 78 |
| Document Web Site None |
| Source Type Literature Review, Crash/Demographic Statistical Analysis |
| Driving Conditions Normal |
Vehicle Platforms Not Specified |
| Objective To describe how traffic engineering countermeasures can be used to minimize the frequency of red–light
running (RLR) and associated crashes at intersections. |
| General Approach This report describes the findings from the first year of a 2–year project. During the first year,
studies were conducted on RLR frequency and crash rates at 12 intersection approaches in 3 Texas cities. |
| Methods Field Data Collection:
- The field study at each site included the collection of a wide range of geometric, traffic flow, traffic control, and operational
characteristics.
- These data were collected using a variety of methods, including video recorders, laser speed guns, and site surveys.
Safety Data Collection:
- The safety data collection activity consisted of the acquisition of historical crash records for each intersection included in the field studies.
- To facilitate the analysis, computerized databases were requested from the Texas Department of Public Safety and the appropriate city agencies.
- The request was for the most recent 36 months for which complete information was available and for all four approaches to each intersection.
These data were used to quantify the relationship between RLR and crash frequency.
|
| Key Terms Signalized Intersection, Change Interval, Signal Timing Design, Dilemma Zone |
Key Results
- A review of the literature revealed that the following are influential factors in the RLR process: (1) flow rate on the subject approach, (2)
number of signal cycles, (3) phase termination by max–out, (4) probability of stopping, (5) yellow interval duration, (6) all–red
interval duration, (7) entry time of the conflicting driver, and (8) flow rate on the conflicting approach.
- A review of the literature also indicated that drivers are less likely to stop when they: (1) have a short travel time to the intersection, (2)
have higher speeds, (3) are traveling in platoons, (4) are on steep downgrades,(5) are faced with relatively long yellow indications, and (6) are
being closely followed.
- The duration of the yellow interval is generally recognized as a key factor that affects the frequency of RLR. Researchers suggest that the yellow
interval should be based on the travel time of the 85th (or 90th) percentile driver. The corresponding yellow interval
duration should range from 4.0 to 5.5 seconds (s) (with larger values appropriate for higher speed approaches).
- The countermeasures with the greatest potential to reduce RLR (as determined from the literature review) are listed in the table below.
Table A. Engineering countermeasures with the greatest potential.
| Action |
Specific Countermeasure1 |
| Modify signal phasing, cycle length, or clearance intervals |
Increase the yellow interval duration |
| Provide green extension |
| Improve signal coordination |
| Provide advance information or improved notification |
Improve sight distance |
| Improve visibility of traffic control devices |
| Implement safety or operational improvements |
Remove unwarranted signals |
| Improve geometrics |
1Bolded countermeasures were selected for evaluation in this project.
|
Conclusions, Recommendations, Best Practices, Design Implications, or Design Guidelines
- Analysis of approach volume on RLR frequency revealed that RLR frequency was highly correlated with the flow rate at the end of the phase.
Other factors found to be correlated with the frequency of RLR include yellow interval duration and the percentage of heavy vehicles.
- Yellow intervals of less than 3.5 s appear to be associated with a significant number of RLR events per hour.
- The findings from these studies indicate that the frequency of RLR increases in a predictable way with increasing approach volume, increasing
heavy–vehicle percentage, and shorter yellow interval durations.
- Crash data analyses indicate that right–angle crashes increase exponentially with an increasing frequency of RLR.
- Models for computing an intersection approach’s RLR frequency and related crash rate are described.
|
| General Comments None |
| Title Engineering Countermeasures to Reduce Red–Light Running
(FHWA/TX–03/4027–2) |
Funding Agency and Contact Address Federal Highway Administration
6300 Georgetown Pike
McLean, VA 22101–2296 COTR:
Not Specified |
| Authors Bonneson, J., Zimmerman, K., and Brewer, M. |
| Publication Date August 2002 |
Number of Pages 122 |
| Document Web Site None |
| Source Type Field Test |
| Driving Conditions Normal |
Vehicle Platforms Not Specified |
| Objective To describe how engineering countermeasures can be used to minimize the frequency of red–light running
(RLR) and associated crashes. |
| General Approach This report describes the factors that are associated with RLR, as well as several countermeasures that
have been used to reduce its frequency. Initially, there is an examination of the RLR process in terms of the events necessary to precipitate an RLR
event. Then, various engineering countermeasures are identified. Next, a before/after study is described. |
| Methods Field Study:
- During the first year, engineering countermeasures were identified and implemented at 10 intersections in 5 Texas cities.
- Before/after studies of RLR frequency were then conducted at two sites (i.e., approaches) at each of the 10 intersections.
- One or more of the five countermeasures identified were implemented at most of the sites.
- Data collection consisted of a wide range of geometric, traffic flow, traffic control, and operational characteristics.
- The data were collected using a variety of methods, including video recorders, laser speed guns, and site surveys.
Crash Data Analysis:
- The 3–year crash history for each intersection was compared to its observed frequency of RLR.
- Computerized databases were requested from the Texas Department of Public Safety and the appropriate city agencies.
|
| Key Terms Signalized Intersections, Change Interval, Yellow Interval, Red–Light Running |
Key Results
- Factors that lead to conflict: The following factors are related to the occurrence of RLR: (1) flow rate on the subject approach, (2) number of
signal cycles, (3) phase termination by max–out, (4) probability of stopping, and (5) yellow interval duration.
- The results of the field study indicate that more than 10,018 signal cycles were observed at 20 intersection approaches. During these cycles,
586 vehicles entered the intersection (as defined by the stop line) after the change in signal indication from yellow to red. Of the 586 vehicles,
84 were heavy vehicles and 502 were passenger cars. Overall, 0.86 percent of heavy vehicles violated a red indication and 0.38 percent of passenger
cars violated the red indication.
- The overall average RLR rates are 4.1 red–light runners per 1,000 vehicles and 1.0 red–light runners per 10,000 vehicle cycles.
- The following countermeasures were implemented at the intersection approaches, with the corresponding percent reduction in parentheses (the only
countermeasure found to be statistically significant was the yellow interval duration increase):
- Add light–emitting diode (LED) lighting to the yellow indication (49 percent reduction).
- Increase the yellow interval duration (70 percent reduction).
- Add backplates and increase yellow interval duration (18 percent reduction).
- Increase cycle length and improve signal operation (uncertain effect).
- Improve progression and increase cycle length (uncertain effect).
- Add backplates and add LED lighting to the yellow indications (35 percent reduction).
|
Conclusions, Recommendations, Best Practices, Design Implications, or Design Guidelines
- The typical intersection approach experiences from 3.0 to 5.0 red–light runners per 1,000 vehicles and 1.0 red–light runners per
10,000 vehicle cycles. An intersection with an RLR rate that is greater than that of the typical intersection should be the primary target of a
treatment program.
- A heavy–vehicle operator is twice as likely to run the red indication as is a passenger car driver.
- RLR is more frequent at intersections with platoons arriving near the end of the green indication. Engineers developing signal coordination plans
should avoid having platoons arrive near the end of the signal phase. If this situation cannot be avoided, then a longer cycle length should be used.
- About 80 percent of drivers that run red lights enter the intersection within 1.0 s after the end of the yellow cycle. Hence, engineering
countermeasures focused on driver recognition of, and response to, the yellow indication are likely to be the most cost–effective.
- In addition to an increase in yellow interval duration, several other engineering countermeasures were identified as having the potential to
reduce RLR. Specifically, it was found that the use of backplates would reduce RLR by 25 percent, a 20–s increase in cycle length would reduce
RLR by 18 percent, and the use of yellow LEDs may reduce RLR by 13 percent.
- The findings indicate that the frequency of RLR decreases in a predictable way with decreasing approach flow rate, longer clearance path lengths,
longer headways, and longer yellow interval durations.
- The crash data analyses indicate that right–angle crashes increase exponentially with an increasing frequency of RLR.
|
| General Comments None |
| Title Analysis of Fatal Crashes Due to Signal and Stop Sign
Violations (DOT–HS–809–779) |
Funding Agency and Contact Address National Highway Traffic Safety
Administration
400 Seventh Street, S.W.
Washington, DC 20590 COTR:
Not Specified |
| Authors Campbell, B.N., Smith, J.D., and Najm, W.G. |
| Publication Date September 2004 |
Number of Pages 159 |
| Document Web Site http://www-nrd.nhtsa.dot.gov/departments/nrd-12/pubs_rev.html |
| Source Type Crash/Demographic Statistical Analysis |
| Driving Conditions Normal |
Vehicle Platforms Light Vehicles |
| Objective This research supports the National Highway Traffic Safety Administration (NHTSA) in developing performance
specifications for stop sign/traffic signal violations and insufficient gap warning systems (e.g., left turn across path). |
| General Approach Crash data for the analysis were obtained from the 1999–2000 Fatality Analysis Reporting System
(FARS) crash databases. This report identified the crash scenarios, described the crash contributing factors, and characterized the infrastructure where
fatal crashes occurred in 1999 and 2000. |
Methods
- The analysis began with all 1999 and 2000 fatal crashes and then segregated the crashes by the type of traffic control device at the crash site.
- These crashes were then examined to determine whether the driver violated the traffic signal or stop sign and what type of violation occurred.
- Traffic control device violations were classified into two categories: (1) failure to obey and (2) failure to yield.
- Fatal crashes involving light vehicles that violated the traffic signal or stop sign were separated into single–vehicle, two–vehicle,
and multiple–vehicle crash categories.
|
| Key Terms Light Vehicles, Crashes, Contributing Factors, Intelligent Vehicle Initiative, Fatal Crashes, Traffic Signals,
Stop Signs, Violations, Precrash |
Key Results
- A total of 9,951 vehicles were involved in fatal crashes at traffic signals in 1999 and 2000—20 percent of these vehicles failed to obey
the signal and 13 percent failed to yield the right of way.
- For crashes at stop signs, 13,627 vehicles were involved in fatal crashes —21 percent failed to obey the sign and 23 percent failed to
yield the right of way.
- Single–vehicle crashes accounted for 8 percent and 6 percent, two–vehicle crashes accounted for 75 percent and 87 percent, and
multiple–vehicle crashes accounted for 18 percent and 7 percent of all light–vehicle violation fatal crashes at traffic signals and
stop signs, respectively.
- About 64 percent and 95 percent, respectively, of the "failure to obey" and "failure to yield" single–vehicle crashes
at traffic signals were pedestrian crashes. On the other hand, 76 percent of the "failure to yield" crashes at stop signs were pedestrian
crashes, while 95 percent of the "failure to obey" crashes at stop signs were other crashes such as run–off–road crashes.
- Single–vehicle traffic signal crashes primarily occurred in urban areas (91 percent), whereas 57 percent of stop sign crashes occurred in
rural areas. Most single–vehicle crashes occurred on two–lane roadways regardless of the type of violation.
- Approximately 65 percent and 12 percent, respectively, of the "failure to obey" and "failure to yield" two–vehicle
crashes were straight crossing–path crashes and, in contrast, 29 percent and 81 percent, respectively, were left crossing–path crashes.
- Straight crossing–path crashes were 2.24 times more likely than left–turn crossing–path crashes for "failure to
obey" violations. In contrast, left–turn crossing–path crashes were 6.55 times more likely than straight crossin–gpath
crashes for "failure to yield" right–of–way violations.
- In 1999 and 2000, there were 889 fatal multiple–vehicle crashes that involved violations by light vehicles. About 58 percent occurred
at traffic signals, while the remaining 42 percent occurred at stop signs. At traffic signals, drivers failed to obey the signal in 67 percent of
the crashes and failed to yield the right of way in the remaining 33 percent of the crashes.
- About 82 percent of multiple–vehicle fatal crashes at traffic signals occurred on urban roadways. Conversely, about 57 percent of
multiple–vehicle fatal crashes at stop signs occurred on rural roadways.
- The majority (80 percent) of stop sign crashes occurred on two–lane roadways. On the other hand, half of the traffic signal crashes
(50 percent) occurred on two–lane roadways.
- Alcohol was involved in 37 percent of all single–vehicle fatal crashes involving a light vehicle violating the traffic signal or the
stop sign.
- Single–vehicle crashes had the highest rate of speeding and inattention, 33 percent and 14 percent, respectively.
- Inattention or distraction was reported for about 11.0 percent of all light–vehicle violations in two–vehicle fatal
crossing–path crashes.
- Alcohol was linked to 14 percent of all light–vehicle violations in two–vehicle fatal crossing–path crashes.
- Speeding or racing, including police chase, was related to 10 percent of all light–vehicle violations in multiple–vehicle
fatal crashes. This factor was four times more prevalent in traffic signal crashes than in stop sign crashes.
- Inattention or distraction was the second most reported factor, representing about 7 percent of all light–vehicle violations in
multiple–vehicle fatal crashes.
- Alcohol was linked to 13 percent of all light–vehicle violations in multiple–vehicle crashes.
|
Conclusions, Recommendations, Best Practices, Design Implications, or Design Guidelines
- No major differences were found among the crash categories regarding the infrastructure where these fatal crashes occurred.
- The authors concluded that fatal crashes involving a light vehicle violating the traffic signal or stop sign occur in similar locations,
regardless of whether they are single–vehicle, two–vehicle, or multiple–vehicle crashes.
- Alcohol, speeding, and inattention are the three most common contributing factors for fatal crashes at traffic signals and stop signs.
|
| General Comments None |
| Title Examination of Intersection, Left Turn Across Path Crashes and
Potential IVHS Countermeasures (DOT–HS–808–154) |
Funding Agency and Contact Address National Highway Traffic Safety
Administration
400 Seventh Street, S.W.
Washington, DC 20590 COTR:
Not Specified |
| Authors Chovan, J.D., Tijerina, L., Everson, J.H., Pierowicz, J.A., and Hendricks, D.L. |
| Publication Date September 1994 |
Number of Pages 52 |
| Document Web Site http://www.its.dot.gov/itsweb/EDL_webpages/webpages/SearchPages/Alpha_Search.cfm |
| Source Type Crash/Demographic Statistical Analysis |
| Driving Conditions Imminent Crash (Intersection Collision Avoidance (ICA)) |
Vehicle Platforms Light Vehicles |
| Objective To provide a preliminary analysis of intersection–related, left turn across path (LTAP) crashes and
applicable countermeasure concepts for the Intelligent Vehicle–Highway System (IVHS) program. The intent of the report is to increase understanding
of the crash avoidance requirements associated with LTAP crashes. |
General Approach
- This report presents the results of a study of the intersection, LTAP type of collision as identified by the NHTSA Office of Crash Avoidance
Research (OCAR).
- A total of 154 LTAP crashes selected from the 1992 Crashworthiness Data System (CDS) were analyzed and weighted for severity so that they might
more closely approximate the national profile.
|
Methods
- A framework for IVHS crash avoidance concepts regarding LTAP crashes is presented.
- A simple LTAP model is presented in which driver warnings are analyzed in terms of principal other vehicle (POV) time headway. This model
incorporates the above framework and is divided into two subtypes based on whether the subject vehicle (SV) comes to a complete stop before
entering the intersection.
- Two types of LTAP crashes were identified:
- Subtype 1, where the SV slows, but does not stop; begins the left turn; and strikes or is struck by the oncoming POV.
- Subtype 2, where the SV stops, then proceeds with the left turn, and strikes or is struck by the POV.
- The report concludes with a discussion of research needs to support further refinement of the LTAP scenario and other crash avoidance concepts.
|
| Key Terms Vehicle Crash Analysis, Crash Countermeasures, Intelligent Vehicle–Highway System, Kinematic Models,
Crash Circumstances |
| Key Results Causal Factors and Crash Characteristics:
- At both signalized and unsignalized intersections, the LTAP crashes occurred for the following reasons:
- SV driver was unaware of the crash hazard.
- SV driver misjudged how fast the POV was approaching.
- SV driver misjudged how close the POV was to their intersection.
- Potentially harmful situation was not obvious to the SV driver.
- SV driver’s view was obstructed.
- SV was more likely to be struck by another vehicle than to strike another vehicle.
- Most LTAP crashes occurred on roadways with posted speed limits of 56 kilometers per hour (km/h) (35 miles per hour (mi/h)) or greater, on dry
pavement (80 percent), and under no adverse weather conditions (86 percent).
IVHS Crash Avoidance Concepts for LTAP Crashes:
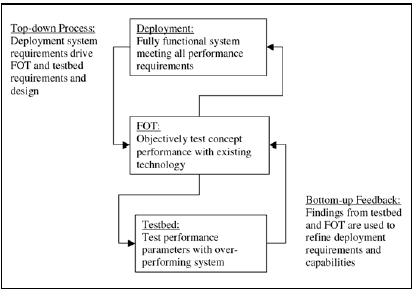
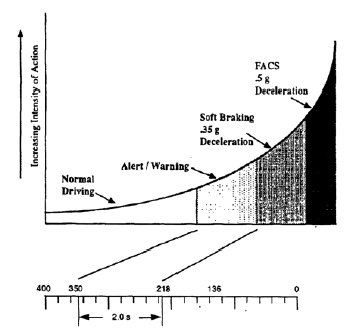
- A framework for IVHS crash avoidance concepts was presented based on a series of sequential countermeasure steps as follows (see figure A):
- Driver alerts.
- Higher intensity driver warnings.
- Partially automated control crash avoidance maneuvers.
- Fully automated control maneuvers.
|
| Figure A. Time–intensity framework for LTAP crash avoidance (source: NHTSA, 1992). |
Figure B. Model intersection geometry. |
|
|
|
| Conclusions, Recommendations, Best Practices, Design Implications, or Design Guidelines Research Needs:
- Clinical analysis area: Cross–tabulation of causal analysis between subtypes, concordance of parallel analyses,analysis of cases
caused by a loss of traction.
- Driver behavior at left turns across path: Higher order responses, correlations, driver decision processes,maximum turn velocities,
control intervention, interaction between drivers, alternative alert displays, transition from preplanned to emergency maneuvers, driver acceptance
of LTAP collision avoidance systems (CAS), headway time prediction, driver reaction time.
- LTAP algorithm research needs: Additional CAS concepts, CAS set points, impact of acceleration profiles on robustness, false alarms,
warning familiarity, evasive maneuvers, POV turning.
- Further modeling research needs: Multiple–vehicle interactions, inclusion of variables, speed profiles, indicators of intent,
normal driving behavior.
|
| General Comments None |
| Title Examination of Unsignalized Intersection, Straight Crossing–
Path Crashes, and Potential IVHS Countermeasures
(DOT–HS–808–152) |
Funding Agency and Contact Address National Highway Traffic Safety
Administration
400 Seventh Street, S.W.
Washington, DC 20590 COTR:
Not Specified |
| Authors Chovan, J.D., Tijerina, L., Pierowicz, J.A., and Hendricks, D.L |
| Publication Date August 1994 |
Number of Pages 72 |
| Document Web Site http://www.its.dot.gov/itsweb/EDL_webpages/webpages/SearchPages/Alpha_Search.cfm |
| Source Type Crash/Demographic Statistical Analysis |
| Driving Conditions Imminent Crash (ICA) |
Vehicle Platforms Light Vehicles |
| Objective To provide a preliminary analysis of unsignalized intersection, straight crossing path (UI/SCP) crashes and
applicable countermeasure concepts for the IVHS program. The intent of the report is to increase the understanding of crash avoidance requirements
associated with UI/SCP crashes. |
General Approach
- This report presents the results of a study of the UI/SCP type of collision as identified by the NHTSA Office of Crash Avoidance Research (OCAR).
- 100 UI/SCP crashes selected from the 1992 Crashworthiness Data System (CDS) were analyzed and weighted for severity so that they might more closely
approximate the national profile.
|
Methods
- An analytic model of intersection negotiation behavior at unsignalized intersections was presented to indicate possible sources of driver actions
that might contribute to such crashes.
- Two types of UI/SCP crashes were identified as follows:
- Subtype 1, where the SV ran the stop sign.
- Subtype 2, where the SV stopped, then proceeded against cross traffic.
- The two crash subtypes were examined for the following characteristics: Speed distribution, POV travel direction, SV’s role in the crash
event.
- Crash avoidance concepts regarding UI/SCP crashes were discussed, and partially automatic control systems and fully automatic control systems
were presented as control intervention schemes.
- The report concluded with a discussion of research needs to support further refinement of the UI/SCP scenario and other crash avoidance
concepts.
|
| Key Terms Vehicle Crash Analysis, Crash Countermeasures, IVHS, Kinematic Models, Crash Circumstances |
| Key Results Crash Causal Factors:
- UI/SCP crashes occurred for the following reasons:
- Driver unawareness caused by inattention, failure to see, and obstructed vision.
- Driver misjudgment of POV velocity/gap.
- Deliberate violation of sign.
Crash Countermeasure Concepts:
IVHS crash countermeasure concepts, specific to UI/SCP crash subtypes, were devised in three different categories to address the major causal factors as
follows (see figure A):
- In–vehicle alert: Subtype 1—Intersection detection alert, Subtype 2—In–vehicle display of approaching POV.
- Driver warning: Subtype 1—Graded warnings to SV driver, Subtype 2—Gap acceptance aid that warns the SV when it is unsafe to
enter the intersection.
- Control intervention: Both subtypes—CAS–controlled soft braking, moderate braking, or graded braking with or without driver
override (see figure B).
|
| Figure A. Time–intensity graph of crash avoidance requirements (source: NHTSA, 1992). |
Figure B. IVHS CAS concepts in the context of a 72–km/h (45–mi/h) SV travel velocity. |
|
|
|
| Conclusions, Recommendations, Best Practices, Design Implications, or Design Guidelines Research Needs:
- Clinical analysis area: Increase sample size in analysis, concordance of parallel analysis.
- Driver behavior at unsignalized intersections: Higher order responses, correlations, drivers’ decision processes, control
intervention, interaction between drivers, alternative alert displays.
- UI/SCP algorithm research needs: Additional CAS concepts, error modeling of algorithm data, CAS set points, impact of velocity profiles
on algorithm robustness.
- Further modeling research needs: Multiple–vehicle interactions.
|
| General Comments None |
| Title Safety Impact of Permitting Right–Turn–on–Red: A Report to Congress by the National Highway
Traffic Safety Administration (DOT–HS–808–200) |
Funding Agency and Contact Address National Highway Traffic Safety
Administration
400 Seventh Street, S.W.
Washington, DC 20590 COTR:
Not Specified |
| Authors Compton, R.P., and Milton, E.V. |
| Publication Date December 1994 |
Number of Pages 47 |
| Document Web Site None |
| Source Type Literature Review, Crash/Demographic Statistical Analysis |
| Driving Conditions Normal |
Vehicle Platforms Not Specified |
| Objective
To provide a brief summary of State laws and the safety impacts of permitting right and left turns at red lights. |
| General Approach This report presents a brief summary of the current status of State implementation of laws permitting
right and left turns at red lights, a brief review of previous research, and the results of analyses of currently available data assessing the safety impact
of permitting a right turn on red (RTOR). |
| Methods Two sources of data were used in completing this report:
- Fatality Analysis Reporting System (FARS): FARS includes a code for an RTOR vehicle maneuver. However, FARS does not include information on
whether a vehicle was turning right on red at the time of the crash, only that the vehicle was turning right at the time of the crash at an
intersection where RTOR is permitted.
- Data from four State crash data files (Illinois, Indiana, Maryland, and Missouri): The four State files include on their crash report form
either a code for an RTOR vehicle maneuver or other codes that make it possible to determine that an RTOR maneuver was executed. With one exception,
data used in the analysis cover the years from 1989 through 1992. From Illinois, only 1989 through 1991 data were available.
|
| Key Terms Right Turn on Red (RTOR), Left Turn on Red (LTOR), Safety Impact, Intersection Crashes |
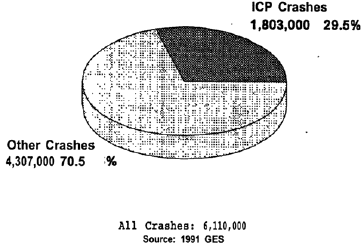
| Key Results Analysis of FARS data showed the following:
- Approximately 84 fatal crashes occurred per year during the time period involving a right–turning vehicle at an intersection where RTOR is
permitted.
- During this same time period, there were 485,104 fatalities. Thus, less than 0.2 percent of all fatalities involved a right–turning
vehicle maneuver at an intersection where RTOR is permitted. FARS, however, does not discern whether the traffic signal indication was red.
Therefore, the actual number of fatal RTOR crashes is somewhere between zero and 84 and may be closer to zero.
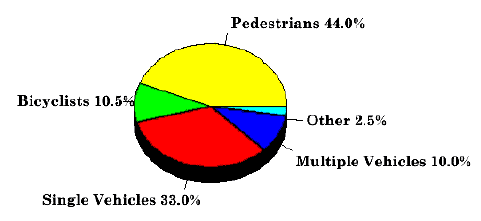
- Slightly less than half of the fatal RTOR crashes involve a pedestrian (44 percent); 10 percent a bicyclist; and, in 33 percent of the crashes,
one vehicle striking another vehicle (see figure).
The results of the data analysis from the four State crash files suggest the following:
- RTOR crashes represent a very small proportion of the total number of traffic crashes in the four States (0.05 percent).
- RTOR injury and fatal crashes represent a fraction of 1 percent of all fatal and injury crashes (0.06 percent).
- RTOR crashes represent a very small proportion of signalized intersection crashes (0.4 percent).
- When an RTOR crash occurs, a pedestrian or bicyclist is frequently involved. For all States, for all years of the studies, the proportion of
RTOR pedestrian or bicyclist crashes to all RTOR crashes was 22 percent.
- RTOR pedestrian and bicyclist crashes usually involve injury. Some 93 percent of RTOR pedestrian or bicyclist crashes resulted in injury.
- Only 1 percent of RTOR pedestrian and bicyclist crashes resulted in fatal injury. However, less than 1 percent of all fatal pedestrian and
bicyclist crashes result from RTOR vehicle maneuvers.
- Most RTOR crashes occur between 6:00 a.m. and 6:00 p.m.
|
Figure A. Percentage of fatal right–turning crashes where RTOR is permitted (1982–
1992).
 |
Conclusions, Recommendations, Best Practices, Design Implications, or Design Guidelines
- A relatively small number of deaths and injuries each year are caused by RTOR crashes.
- These represent a very small percentage of all crashes, deaths, and injuries.
- Because the number of crashes resulting from RTOR is small, the impact on traffic safety has also been small.
- Insufficient data exist to analyze LTOR.
|
| General Comments None |
| Title Safety Evaluation of Red–Light Cameras
(FHWA–HRT–05–048) |
Funding Agency and Contact Address Federal Highway Administration
6300 Georgetown Pike
McLean, VA 22101–2296 COTR:
Michael Griffith |
| Authors Council, F.M., Persaud, B., Eccles, K., Lyon, C., and Griffith, M.S. |
| Publication Date April 2005 |
Number of Pages 8 |
| Document Web Site http://www.tfhrc.gov/safety/pubs.htm |
| Source Type Field Test |
| Driving Conditions Normal |
Vehicle Platforms Not Specified |
| Objective To determine the effectiveness of red–light camera (RLC) systems in reducing crashes. |
| General Approach The study involved Empirical Bayes (EB) before/after research using data from seven jurisdictions across
the United States to estimate the crash and associated economic effects of RLC systems. The study included 132 treatment sites and specially derived rear
–end and right–angle unit crash costs for various severity levels. |
Methods
- The choice of jurisdictions to be included in the study was based on an analysis of sample size needs and the data available in potential
jurisdictions.
- The jurisdictions chosen were: El Cajon, San Diego, and San Francisco, CA; Howard County, Montgomery County, and Baltimore, MD; and Charlotte,
NC.
- Data were required not only for RLC–equipped intersections, but also for a reference group of signalized intersections that were not
equipped with RLCs, but were similar to the RLC locations.
|
| Key Terms Red–Light Camera, Empirical Bayes, Crash Evaluation, Economic Analysis, Signalized Intersection |
Key Results
- There was a significant decrease in right–angle crashes, but there was also a significant increase in rear–end crashes (see table A).
- The economic estimates, with property damage only (PDO) crashes excluded, show a positive aggregate economic benefit of more than $18.5 million
over approximately 370 site–years, which translates into a crash–reduction benefit of approximately $50,000 per site–year
(see table B).
Table A. Combined results for seven jurisdictions.
| |
Right–Angle Crashes |
Rear–End Crashes |
| Total Crashes |
Definite Injury |
Total Crashes |
Definite Injury |
EB estimate of crashes expected in
the "after" period without RLC |
1,542 |
351 |
2,521 |
131 |
Count of crashes observed in the
"after" period |
1,163 |
296 |
2,896 |
163 |
Estimate of percentage change
(standard error) |
-24.6 (2.9) |
-15.7 (5.9) |
14.9 (3.0) |
24.0 (11.6) |
Estimate of the change in crash
frequency |
-379 |
-55 |
375 |
32 |
Note: A negative number indicates a decrease.
Table B. Economic effects including and excluding PDOs.
| |
All Severities Combined |
PDOs Excluded |
Right–Angle
Crash |
Rear–End
Crash |
All Crashes |
Right–Angle
Crash |
Rear–End
Crash |
All Crashes |
|---|
EB estimate of
crash costs before
RLC installation |
$66,814,067 |
$69,347,624 |
$161,843,021 |
$61,687,367 |
$52,681,148 |
$134,407,104 |
Recorded cost of
crashes after RLC
installation (370
site–years) |
$48,319,090 |
$75,222,780 |
$147,470,550 |
$43,868,392 |
$53,944,539 |
$115,901,685 |
Percentage of
change in crash
cost (standard
error) |
-27.7 (0.6) |
8.5 (0.7) |
-8.9 (0.4) |
-28.9 (0.6) |
2.4 (0.8) |
-13.8 (0.5) |
Crash cost
decrease (per site–
year) |
|
|
$14,372,471
($38,845) |
|
|
$18,505,419
($50,015) |
Note: A negative number indicates a decrease.
|
Conclusions, Recommendations, Best Practices, Design Implications, or Design Guidelines
- Crash effects detected were consistent in direction with those found in many previous studies (a decrease in right–angle crashes and an
increased in rear–end crashes).
- There was a modest aggregate crash cost benefit of RLC systems.
- A disaggregate analysis found that the greatest economic benefits are associated with factors of the highest total entering annual average
daily traffic (AADT), the largest ratios of right–angle to rear–end crashes, and the presence of protected left–turn phases.
- There were weak indications of a spillover effect that point to a need for a more definitive, perhaps prospective, study of this issue.
|
| General Comments None |
| Title
Red Light Violations and Crashes at Urban Intersections (Transportation Research Record 1734, pp. 52–58) |
Funding Agency and Contact Address Federal Highway Administration
6300 Georgetown Pike
McLean, VA 22101–2296 COTR:
Not Specified |
| Authors Datta, T.K., Schattler, K., and Datta, S. |
| Publication Date 2000 |
Number of Pages 7 |
| Document Web Site None |
| Source Type Field Test |
| Driving Conditions Normal |
Vehicle Platforms Not Specified |
| Objective To determine if any difference existed between red–light violation characteristics among intersections
with properly designed clearance intervals and intersections that did not have appropriate yellow change intervals and, more importantly, an
all–red interval. |
| General Approach A study was performed in Detroit, MI, to compare the red–light violation characteristics of
intersections with properly designed all–red intervals and those intersections without all–red intervals. In the absence of "before"
violation data, a comparative parallel experimental study was used. An evaluation of before/after crash frequencies was also performed to determine the
effectiveness of implemented improvements on right–angle crashes and injuries. |
Methods
- Five signalized intersection sites in Detroit were studied: Three treatment (test) intersections, two intersections in the same area were selected
as control sites.
- Treatment sites: All treatment intersections had clearance intervals (yellow and all–red intervals) that were calculated
based on site–specific criteria such as approach speed, vehicle deceleration rates for stopping, and intersection geometry.
- Control sites: These sites had a yellow interval only.
- Red–light violations were monitored through a series of onsite field observations. A total of 16 h of field data were collected at each of
the five sites during off–peak periods.
- Trained field personnel observed all traffic movement through each intersection and recorded the frequency of red–light violations based
on the directional movement of travel.
|
| Key Terms Red–Light Violations, Intersection Safety, Yellow Change Intervals |
Key Results
- In performing the effectiveness evaluation, after–improvement crashes were compared with the 3–year averages of crash data for the
same months of the "before" period.
- The results show a significant reduction in red–light violation rates for the treatment sites. The average red–light violations per
hour for the treatment sites was 3.6, while the control sites had an average of 8.08.
- The before/after comparison of right–angle, injury, and total crashes at all three treatment sites shows that the crash frequencies were
significantly lower after the treatment (see tables below).
Poisson test of significance for test sites.
Table A. Seven Mile Road and Ryan Road intersection.
Predominant
Crash Types |
Crash Frequencies |
Poisson Test of
Significance |
| "Before" Crashes |
"After" Crashes |
Difference |
12–Month Avg. of
3–Year Data |
12–Month Avg. of
24–Month Dataa |
"Before" – "After" |
Reduction |
| Rear–End |
10.67 |
8 |
2.67 |
25% |
No |
| Angle (Intersection) |
17.33 |
4.5 |
12.83 |
74% |
Yes |
| Angle (Driveway) |
3 |
4.5 |
-1.50 |
-50% |
Frequency too low |
| Left–Turn Head–On |
20.67 |
4.5 |
16.17 |
78% |
Yes |
| Sideswipe |
8.67 |
11 |
-2.33 |
-27% |
No |
| Total |
67.67 |
35.5 |
32.17 |
48% |
Yes |
| Injury |
18.67 |
6.5 |
12.17 |
65% |
Yes |
aRepresents an annual average of 24–month data (June 1997 to May 1999).
Table B. Seven Mile Road and John R. Road intersection.
Predominant
Crash Types |
Crash Frequencies |
Poisson Test of
Significance |
| "Before" Crashes |
"After" Crashes |
Difference |
12–Month Avg. of
3–Year Data |
12–Month Avg. of
24–Month Dataa |
"Before" – "After" |
Reduction |
| Rear–End |
7.67 |
8.57 |
-0.9 |
-12% |
No |
| Angle (Intersection) |
12 |
6.29 |
5.71 |
48% |
Yes |
| Angle (Driveway) |
1 |
0 |
1 |
100% |
Frequency too low |
| Left–Turn Head–On |
15 |
3.43 |
11.57 |
77% |
Yes |
| Sideswipe |
9 |
5.71 |
3.29 |
37% |
No |
| Total |
51.67 |
29.14 |
22.53 |
44% |
Yes |
| Injury |
16.67 |
4.57 |
12.1 |
73% |
Yes |
aRepresents an annual average of 21–month data (June 1997 to May 1999).
Table C. Hubbell Road and Puritan Road intersection.
Predominant
Crash Types |
Crash Frequencies |
Poisson Test of
Significance |
| "Before" Crashes |
"After" Crashes |
Difference |
12–Month Avg. of
3–Year Data |
12–Month Avg. of
24–Month Dataa |
"Before" – "After" |
Reduction |
| Rear–End |
4.33 |
1.89 |
2.44 |
56% |
No |
| Angle (Intersection) |
20.33 |
5.68 |
14.65 |
72% |
Yes |
| Angle (Driveway) |
0.33 |
0 |
0.33 |
100% |
Frequency too low |
| Left–Turn Head–On |
4 |
0.63 |
3.37 |
84% |
Yes |
| Sideswipe |
3.67 |
2.53 |
1.14 |
31% |
Frequency too low |
| Total |
35 |
15.16 |
19.84 |
57% |
Yes |
| Injury |
13.33 |
6.32 |
7.01 |
53% |
Yes |
aRepresents an annual average of 29–month data (June 1997 to May 1999).
From Transportation Research Record 1734, Transportation Research Board, National Research Council, Washington, DC, 2000, table 3, p. 57.
Reprinted with permission.
|
Conclusions, Recommendations, Best Practices, Design Implications, or Design Guidelines
- Analysis indicated significantly lower red–light violations at the treatment sites.
- Analysis also indicated an extraordinary reduction in right–angle and injury crashes.
- Study demonstrated that substantial benefits, in terms of reducing red–light violations and right–angle crashes, can be achieved by
introducing a well–designed, all–red interval.
|
| General Comments None |
| Title Guidance for Using Red Light Cameras |
Funding Agency and Contact Address Federal Highway Administration
6300 Georgetown Pike
McLean, VA 22101–2296 COTR:
Not Specified |
| Authors Federal Highway Administration and National Highway Traffic
Safety Administration. |
| Publication Date March 2003 |
Number of Pages 60 |
| Document Web Site http://www.tfhrc.gov/safety/intersect.htm |
| Source Type Guidelines |
| Driving Conditions Normal |
Vehicle Platforms Not Specified |
| Objective The guidance in this report is intended to provide critical information for State and local agencies on relevant aspects of red–light camera (RLC) systems in order to promote consistency and proper implementation and operation. |
| General Approach FHWA and NHTSA have developed this guidance for the use of State and local agencies on the implementation and operation of RLC systems. This guidance can be used by State and local agency managers, transportation engineers, and law enforcement officials to identify and properly address safety problems resulting from red–light running (RLR) within their jurisdiction. |
| Methods The document is divided into the following sections:
- Understanding of the problem.
- Problem identification.
- Countermeasures and their applications.
- RLC program implementation.
|
| Key Terms Red–Light Running, Red–Light Cameras, Intersections |
Key Results
- An engineering study may identify the following conditions that may be present at a signalized intersection and contribute to RLR by motorists: Grade, poor visibility, temporary roadside obstructions, line of sight, sign reflectivity, traffic volumes, signal timing, and weather.
Problem Identification:
- The following steps are recommended for investigating intersection safety: Data collection; RLR violation data; intersection crash data; driver behavior observations; traffic–, signal–, and intersection–related data; and motorist complaints and comments.
Countermeasures and Their Applications:
- Engineering countermeasure solutions to be considered include: Modifying traffic signal timing, improving signage and marking,
improving sight lines, modifying grades and/or grade separation, adjusting the prevailing speeds, changes in surface treatments, altering lane
configurations, and replacing the traffic signal with some other form of traffic control device or intersection type.
- Education: A well–designed public information and education campaign should provide information and data that explain what RLR
is, why RLR is dangerous, and what actions are currently being undertaken to reduce the incidence of RLR.
- Enforcement by law enforcement officers: Officers in patrol cars or using motorcycles can be a cost–effective solution to reduce
RLR at problem intersections. However, unless an observer and a stopping team are used, officers also must pass through the intersection on a red
signal indication.
- Red–light cameras: If engineering, educational, and traditional enforcement countermeasures are proven to be unsuccessful, RLR
camera technologies, if authorized by law, may be considered.
RLC Program Implementation:
- Early planning and startup: The following are the key elements required for the early planning and startup of an RLC program.
- Establishment of an oversight committee: This should be inclusive of all stakeholders (engineers, educators, law enforcement,
prosecutors, judges, and, most importantly, private citizens).
- Establishment of program objectives: The oversight committee should define, as clearly as possible, the RLC program objectives
as an early step for moving forward. Program objectives should address specific operational needs.
- Identification of the legal requirements: In particular, concerns and issues related to privacy, citation distribution, and
types of penalties need to be thoroughly addressed and resolved prior to the startup of an RLC program.
- Engineering design of RLC systems: Plans should address the placement of the RLC system equipment and related components, including
camera equipment, supporting structure, intersection lighting, vehicle detection system, communications, pull boxes and conductor schedule,
electrical service, and warning signs.
|
| Conclusions, Recommendations, Best Practices, Design Implications, or Design Guidelines See Key Results above. |
| General Comments None |
| Title Intersection Angles and the Driver’s Field of View |
Funding Agency and Contact Address Arkansas State Highway and
Transportation Department
P.O. Box 2261
Little Rock, AR 72203
COTR: Not Specified |
| Authors Gattis, J.L., and Low, S.T. |
| Publication Date November 1997 |
Number of Pages 37 |
| Document Web Site None |
| Source Type Field Test |
| Driving Conditions Normal |
Vehicle Platforms Various Types |
| Objective To identify the constraints on the angle of a left-skewed intersection, as affected by the vehicle body limiting
a driver’s line of sight to the right. |
| General Approach In this research project, the angles at which drivers’ lines of sight were obstructed by the body
of their vehicles were measured. Two driver positions ("sit back" and "lean forward") were used. A 13.5-degree vision angle was selected
to represent an intermediate position (between the "sit back" and the "lean forward" positions). |
| Methods Design Vehicle:
- The following vehicle design types were located and arrangements were made to allow measurements to be taken: Ambulance, dump truck, motor home,
school bus, small bus on a van chassis, single-unit truck mounted with container, and truck tractor (cab of an 18–wheeler).
Driver Position:
- "Sit back" position: Driver was in a fully leaned-back position, with his/her back touching the seatback. In this position,
the driver relies mainly on head and neck movement to get the maximum viewing angle to his/her right. This position permits the driver to remain
comfortably seated against the seatback.
- "Lean forward" position: Driver leaned forward so that the driver’s eyes were over the juncture where the steering wheel
is attached to the column. In addition to using head and neck movements, the driver leaned his/her upper body far forward to get a greater viewing
angle to the right. In such a position, the driveer’s chest was often pressing the driver’s arms against the steering wheel, thus
confining the movement of the driver’s arms.
Field Measurements:
- The lengths of both the front and rear axles were measured. The difference between these two widths was divided by two. This "half of the
width" difference was added to the front axle width and this dimension was marked on the parking lot surface to the outside of the right-front
tire. The "right-edge parallel line" was determined by connecting a line from this point to the edge of the right-rear tire.
- Next, the researchers constructed a perpendicular line projecting from the driver’s eyes with the driver in the "sit back"
position and another perpendicular line projecting from the "lean forward" position.
- A surveying range pole with an attached level was placed on the right-offset line, within the seated driver’s field of view. As it was
slowly moved backward, the person in the driver’s seat signaled when a vehicle body obstruc tion caused him/her to lose sight of the pole.
This position was marked. This procedure was performed three times for each position.
|
| Key Terms Intersection Angle, Sight Distance, Geometric Design |
| Key Results Effects on Sight Distance at Intersections:
- With a 5.4-meter (m) (17.7-foot (ft)) setback and the driver in the intermediate "lean forward" position, the resulting available
sight distances for 60, 65, 70, and 75 degrees were found to be 40, 55, 96, and 408 m (131, 180, 315, 1339 ft), respectively (see table A).
- The currently recommended minimum intersection angle, 60 degrees, has a resulting available sight distance equal to the stopping sight distance
(SSD) for 37-km/h (23-mi/h) travel on the major roadway.
- Designers should recognize that some drivers will position themselves so that they are less than 5.4 m (17.7 ft) from the edge of the
through-road traveled way. Table B lists the angular sight distance (ASD) and design speeds calculated with E = 4.4 m (14.4 ft).
Table A. Resulting available sight distance for a 5.4-m setback.
| |
Desirable Vision Angle (VASB) 4.5 degrees |
Minimum Vision Angle (VAMLF) 13.5 degrees |
| Intersection Angle (IA),degrees |
5.4m/sin(IA) |
ASD |
Design Speed |
ASD |
Design Speed |
| m |
ft |
m |
ft |
km/h |
mi/h |
m |
ft |
km/h |
mi/h |
| 55 |
6.592 |
21.6 |
23.6 |
77.4 |
< 30 |
< 20 |
31.8 |
104.3 |
31 |
< 20 |
| 60 |
6.235 |
20.5 |
26.9 |
88.2 |
<30 |
< 20 |
39.8 |
130.6 |
37 |
23 |
| 65 |
5.958 |
19.5 |
32.3 |
106.0 |
32 |
< 20 |
55.4 |
181.8 |
46 |
29 |
| 70 |
5.747 |
18.9 |
41.6 |
136.5 |
38 |
24 |
95.7 |
314.0 |
65 |
40 |
| 75 |
5.590 |
18.3 |
60.1 |
197.2 |
49 |
30 |
408.2 |
1339.2 |
> 120 |
> 70 |
Note: Based on a distance from the driver’s eye to the edge of the cross road of 5.4 m (per NCHRP 383), and a distance from the near road edge to
the center of the path of the oncoming vehicle from the right (3.6 + 3.6/2) = 5.4 m.
Table B. Resulting available sight distance for a 4.4-m setback.
| |
Desirable Vision Angle (VASB) 4.5 degrees |
Minimum Vision Angle (VAMLF) 13.5 degrees |
| Intersection Angle (IA),degrees |
4.4m/sin(IA) |
ASD |
Design Speed |
ASD |
Design Speed |
| m |
ft |
m |
ft |
km/h |
mi/h |
m |
ft |
km/h |
mi/h |
| 60 |
5.081 |
16.7 |
24.6 |
80.7 |
< 30 |
< 20 |
36.4 |
119.4 |
35 |
22 |
| 65 |
4.855 |
15.9 |
29.5 |
96.8 |
30 |
< 20 |
50.5 |
165.7 |
43 |
27 |
| 70 |
4.682 |
15.4 |
37.8 |
124.0 |
36 |
22 |
87.1 |
285.8 |
61 |
38 |
| 75 |
4.555 |
14.9 |
54.6 |
179.1 |
46 |
29 |
371.1 |
1215.5 |
> 120 |
>70 |
Note: Based on a distance from the driver’s eye to the edge of the cross road of 4.4 m (per NCHRP 383), and a distance from the near road edge to
the center of the path of the oncoming vehicle from the right (3.6 + 3.6/2) = 5.4 m. |
Conclusions, Recommendations, Best Practices, Design Implications, or Design Guidelines
- With a 13.5-degree vision angle in some restrictive vehicles, the 60-degree minimum intersection angle allowed by A Policy on Geometric
Design of Highways and Streets (the "Green Book") will cause the driver’s line of sight to be obstructed by the vehicle itself
and will reduce the sight distance available to the driver.
- If roadway engineers are to consider the limitations created by vehicle designs, the findings from this study suggest that a minimum intersection
angle of 70 to 75 degrees will offer an improved line of sight.
|
| General Comments None |
| Title Safety Effectiveness of Intersection Left- and Right-Turn Lanes (FHWA-RD-02-089) |
Funding Agency and Contact Address Office of Safety Research
and Development
Federal Highway Administration
6300 Georgetown Pike
McLean, VA 22101-2296 COTR: Michael S. Griffith |
| Authors Harwood, D.W., Bauer, K.M., Potts, I.B., Torbic, D.J., Richard,K.R., Kohlman Rabbani, E.R., Hauer, E., and
Elefteriadou, L. |
| Publication Date July 2002 |
Number of Pages 254 |
| Document Web Site http://www.tfhrc.gov/safety/ihsdm/libweb.htm |
| Source Type Crash/Demographic Statistical Analysis |
| Driving Conditions Normal |
Vehicle Platforms All |
| Objective To perform a well-designed before/after evaluation of the safety effects of providing left- and right-turn
lanes for selected types of at-grade intersection design improvements. |
| General Approach Data were gathered for 280 improved intersections, as well as 300 similar intersections that were not
improved during the study period. The types of improvement projects evaluated included installation of added left-turn lanes, installation of added
right-turn lanes, and extension of the length of existing left- or right-turn lanes. Three contrasting approaches to a before/after evaluation were used:
(1) yoked comparison (YC) or matched-pair approach, (2) the comparison group (CG) approach, and (3) the Empirical Bayes (EB) approach. |
| Methods Independent Variables:
- Geometric design (29 variables).
- Traffic control (type of control, type of left-turn phasing, presence of pedestrian signals, presence of advanced warning signs, posted
speed
limit).
- Traffic volume (major-road ADT, minor-road ADT, intersection turning-movement count (morning), intersection turning-movement count
(evening)).
- Traffic crashes (date, location, severity (fatal, injury, PDO), number of vehicles involved, type/manner of collision, direction of
travel, actual or intended movement (through, left turn, right turn, U-turn), relationship to intersection (at intersection, not at intersection
but intersection-related, not intersectionrelated), vehicle and party types (passenger car, truck, bus, pedestrian, bicycle)).
Dependent Variables:
- Intersection accident type (total crashes, fatal and injury crashes, project-related crashes, procject-related fatal and injury crashes,
total crashes for individual approaches, fatal and injury crashes for individual approaches, project-related crashes for individual approaches,
project-related fatal and injury crashes for individual approaches).
|
| Key Terms Intersection Safety, Left-Turn Lanes, Right-Turn Lanes, Safety Effectiveness, Before/After Evaluation, Empirical
Bayes, Comparison Group |
Key Results
- Installation of a single left-turn lane on a major-road approach would be expected to reduce total intersection crashes at rural unsignalized
intersections by 28 percent for four-leg intersections and by 44 percent for three-leg intersections.
- At urban unsignalized intersections, installation of a left-turn lane on one approach would be expected to reduce crashes by 27 percent for four-leg
intersections and by 33 percent for three-leg intersections.
- At four-leg urban signalized intersections, installation of a left-turn lane on one approach would be expected to reduce crashes by 10 percent.
- Installation of a single right-turn lane on a major-road approach would be expected to reduce total intersection crashes at rural unsignalized
intersections by 14 percent and crashes at urban signalized intersections by 4 percent.
- Right-turn lane installation reduced crashes on individual approaches to four-leg intersections by 27 percent at rural unsignalized intersections and
by 18 percent at urban signalized intersections
- In general, turn-lane improvements at rural intersections resulted in larger percentage reductions in crash frequency than comparable improvements at
urban intersections.
- The EB method provided the most accurate and reliable results for before/after evaluation of safety improvements.
|
Figure A. Use of regression relationship in the EB approach. 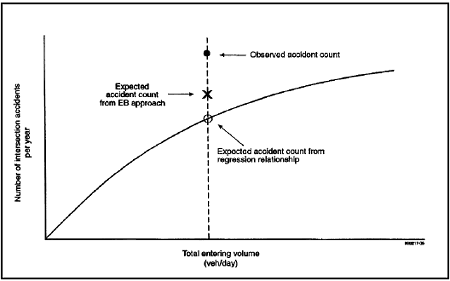 |
Conclusions, Recommendations, Best Practices, Design Implications, or Design Guidelines
- Both added left-turn lanes and added right-turn lanes are effective in improving safety at signalized and unsignalized intersections in both
rural and urban areas.
- The EB approach should be considered the most desirable approach for observational before/after evaluation of safety improvements. The CG approach
should generally be considered as preferable to the YC approach, because it incorporates a comparison group consisting of multiple sites. However,
both the CG and YC approaches are likely to provide overly optimistic evaluation results.
- FHWA should consider incorporating these results in the accident modification factors used for safety prediction in the Interactive Highway
Safety Design Model (IHSDM) and in other ongoing initiatives, such as the Comprehensive Highway Safety Improvement Model (CHSIM).
|
| General Comments None |
| Title Prediction of the Expected Safety Performance of Rural Two- Lane Highways (FHWA-RD-99-207) |
Funding Agency and Contact Address Office of Safety Research
and Development
Federal Highway Administration
6300 Georgetown Pike
McLean, VA 22101-2296 COTR: Michael S. Griffith |
| Authors Harwood, D.W., Council, F.M., Hauer, E., Hughes, W.E., and Vogt, A. |
| Publication Date December 2000 |
Number of Pages 197 |
| Document Web Site http://www.tfhrc.gov/safety/ihsdm/libweb.htm |
| Source Type Crash/Demographic Statistical Analysis |
| Driving Conditions Normal |
Vehicle Platforms All |
| Objective This report presents an algorithm for predicting the safety performance of a rural two-lane highway. |
| General Approach This report presents a new approach to crash prediction that combines the use of historical crash data,
regression analysis, before/after studies, and expert judgment to make safety predictions that are better than those that could be made by any of these
three approaches alone. |
Methods
- The recommended approach to crash prediction has its basis in published safety literature, including both before/after evaluations and regression
models; is sensitive to the geometric features that are of greatest interest to highway designers; and incorporates judgments made by a broadly
based group of
safety experts.
- Separate crash prediction algorithms were developed for roadway segments and for three types of at-grade intersections. The total predicted crash
frequency for any highway project is the sum of the predicted frequency of nonintersection-related crashes for each of the roadway segments and the
predicted frequency of intersection-related crashes for each of the at-grade intersections that make up the project.
- The crash prediction algorithms for roadway segments and at-grade intersections are each composed of two components: Base models and crash
modification factors. The base models were developed in separate studies by Vogt (1999) and Vogt and Bared (1998a, 1998b).
|
| Key Terms Safety, Accident Modeling, Two-Lane Highways, Roadway Segments, Accident Prediction, Geometric Design, Empirical
Bayes Estimation, At-Grade Intersections |
Key Results
- The structure of the crash prediction algorithm, including base models, crash modification factors, calibration factors, and the EB procedure,
is illustrated in the figure below. The flow diagram shown in the figure addresses the application of the crash prediction algorithm to a single
roadway segment or at-grade intersection.
Figure A. Flow diagram of the crash prediction algorithm for a single roadway segment or intersection.
|
Conclusions, Recommendations, Best Practices, Design Implications, or Design Guidelines
- The primary conclusion of this report is that a crash prediction algorithm has been developed and that this algorithm appears to be a useful tool
for predicting the safety performance of rural two-lane highways.
- FHWA plans to incorporate the crash prediction algorithm for rural two-lane highways presented in this report in software for implementation
as part of the IHSDM. A stand-alone version of the software may also be available for use independent of a computer-aided design (CAD) system.
- It is recommended that future enhancements be made to the crash prediction algorithm as further research is completed and that forthcoming
research on rural two-lane highways be structured so that the results are obtained in a form that can be directly implemented in the crash
prediction algorithm. It is also recommended that a program of additional research be undertaken with the specific goal of filling gaps in the
crash prediction algorithm and expanding its scope.
|
| General Comments None |
| Title Intersection Safety Briefing Sheets: An Introduction |
Funding Agency and Contact Address Federal Highway Administration
6300 Georgetown Pike
McLean, VA 22101-2296 COTR: Not Specified |
| Authors Hasson, P., and Stollof, E. |
| Publication Date July 2002 |
Number of Pages 35 |
| Document Web Site http://www.tfhrc.gov/safety/intersect.htm |
| Source Type Literature Review |
| Driving Conditions Normal |
Vehicle Platforms Not Specified |
| Objective To provide a toolkit that contains a series of briefing sheets on various intersection safety-related topics. |
| General Approach The purpose of this toolkit is to enhance communications with the media, decisionmakers, the general
public, and others about intersection safety. |
| Methods The topical areas that are included within this intersection safety communications toolkit include:
- The National Intersection Safety Problem.
- Basic Countermeasures to Make Intersections Safer.
- Pedestrian Safety at Intersections.
- Human Factors Issues in Intersection Safety.
- Intersection Safety Enforcement.
- Traffic Control Devices: Uses and Misuses.
- Red-Light Running Issues.
- Red-Light Cameras.
- Work Zone Intersection Safety.
- Intersection Safety: Myths vs. Reality.
- Intersection Safety Resources.
|
| Key Terms
Countermeasures, Intersection Safety, Pedestrian Safety, Human Factors, Red-Light Running, Work Zone Safety
|
| Key Results The National Intersection Safety Problem:
- The following actions address ways to achieve substantial reductions in annual crash figures: (1) alter key features of the physical design of a highway or street; (2) analyze reasons for traffic conflicts at intersections; (3) engage in innovative and strategic thinking; (4) provide sustained and consistent law enforcement efforts; and (5) all levels of government must play a central role by providing both improved funding and cooperation with highway and vehicle engineers, law enforcement, and local citizen safety groups.
Basic Countermeasures to Make Intersections Safer:
- Eliminate vehicle and pedestrian conflicts when possible.
- When not possible, reduce unavoidable vehicle and pedestrian conflicts to lower the chance of a collision.
- Design intersections so that when collisions do occur, they are not as severe. (Studies have shown that providing turn lanes for left-turning
vehicles can reduce crashes by 32 percent. Signalization countermeasures include using 30.5-centimeter (cm) (12-inch) signal heads; providing
separate signals over each lane; installing higher intensity signals; and changing the length of signal cycles, including the yellow change interval
and the red clearance interval.)
- Addition of turn lanes at intersections.
- Nontraditional intersection design.
- Pavement conditions.
- Upgrade and supplement signs.
How to Increase Pedestrian Safety at Intersections:
- Visibility: Pedestrians need to make themselves more visible during evening and nighttime hours.
- Coordination among engineers, educators, and enforcement personnel.
- Focus enforcement on motorist compliance with pedestrian safety laws, pedestrian compliance, and reducing speeding through intersections.
- Education.
Human Factors Issues in Intersection Safety:
- Driver ability to see signs, markings, and signals: Many drivers may have good vision, but are not able to see well at night because of poor
sensitivity to the contrast between light and dark.
- Driver risk taking: Older drivers often take risks unknowingly because of diminished motor skills, poor vision, and reduced cognitive ability.
- Older drivers: Drivers 85 years of age and older are more than 10 times as likely as drivers in the age 40-49 group to have multiple-vehicle
intersection crashes.
- Younger drivers: The youngest driver age groups have the highest traffic violation and crash involvement rates.
Intersection Safety Enforcement:
- The following are challenges to intersection enforcement: Traffic congestion, intersection signal timing, disregard for compliance with traffic
control devices, and insufficient staffing for traditional enforcement.
Problems With Traffic Control Device Placement and Installation:
- Use of an improper device.
- Improper placement.
- Wrong size, color, or shape.
- Excessive installation.
- Failure to use traffic control devices at necessary locations.
- Failure to warn or notify drivers and pedestrians of unexpected, potentially hazardous conditions.
|
| Conclusions, Recommendations, Best Practices, Design Implications, or Design Guidelines See results above. |
| General Comments None |
| Title Making Intersections Safer: A Toolbox of Engineering Countermeasures to Reduce Red-Light Running |
Funding Agency and Contact Address Federal Highway Administration
6300 Georgetown Pike
McLean, VA 22101-2296 COTR: Not Specified |
| Authors Institute of Transportation Engineers |
| Publication Date 2003 |
Number of Pages 60 |
| Document Web Site http://www.tfhrc.gov/safety/intersect.htm |
| Source Type Literature Review (Informational Report) |
| Driving Conditions Normal |
Vehicle Platforms Not Specified |
| Objective To provide a background of the characteristics of the red-light running (RLR) problem; identify how various
engineering measures can be implemented to address this problem; suggest a procedure for selecting the appropriate engineering measures and provide
guidance on when enforcement, including red-light cameras (RLCs), may be appropriate. |
| General Approach In 2000, FHWA and the Institute of Transportation Engineers (ITE) initiated preparation of an
informational report. The principal focus of this effort was to examine the engineering features of an intersection that could reduce RLR. The report is
to serve as an educational tool for law enforcement agencies and others who may design RLC systems. |
| Methods A panel of experts from Federal, State, and local governments, as well as academia and the private sector, was
formed to share knowledge and experiences in addressing RLR using engineering countermeasures. In addition, a process was established to collect
information and survey practicing engineers to collect the broadest information possible on the topic. |
| Key Terms Red-Light Running, Intersection Design, Countermeasures |
| Key Results Countermeasures With Promise:
- Improve signal visibility: A total of 40 percent of red-light runners claim that they did not see the signal and another 12 percent
apparently mistook the signal indication. Stricter adherence to the guidelines and standards presented in the MUTCD are needed to improve signal
visibility. Countermeasures described in this report include: Placement and number of signal heads, size of the signal display, and line of sight.
- Improve signal conspicuity: The following countermeasures can be applied to capture the motorist’s attention: Redundancy by
providing two red-signal displays within each signal head, LED signal lenses, backplates, and strobe lights.
- Increase likelihood of stopping: Countermeasures detailed in this report include: "Signal Ahead" signs, advanced-warning
flashers, rumble strips, left-turn signal sign, and pavement surface condition.
- Address intentional violations: The following countermeasures relate to signal timing to prevent drivers from trying to "beat"
the yellow signal: Signal optimization, modification to signal cycle length, yellow change interval, all-red clearance interval, and dilemma zone
protection.
- Eliminate need to stop: This can be done by removing the signal or redesigning the traditional intersection. Other countermeasures in
this category include: Unwarranted signals, roundabout intersection design, and flash mode for signals.
Process for Addressing Safety Problems Related to Red-Light Running:
- Confirm that there is a safety problem, conduct an engineering analysis to identify factors that might be causing the problem, identify
alternative countermeasures, select the most appropriate single or combined set of countermeasures, and implement and monitor the countermeasures.
|
Conclusions, Recommendations, Best Practices, Design Implications, or Design Guidelines
- Research cited in this report suggests that "intentional" red-light runners are most affected by enforcement countermeasures, while
"unintentional" red-light runners are most affected by engineering countermeasures.
- The report also establishes the essential need for sound engineering at an intersection for the successful implementation of long-term and
effective enforcement activities, particularly automated enforcement.
- The report also concludes that education initiatives can be an effective complement for any approach or as a stand-alone program.
- RLR is recognized as a complex problem requiring a reasoned and balanced application of education, enforcement, and engineering.
|
| General Comments Future improvements in the reduction of RLR violations and crashes can be achieved through the
following future activities: R&D, improved data related to RLR crashes, improved guidelines and standards, and improved procedures and programs. |
| Title Vehicle-Based Countermeasures for Signal and Stop Sign Violations, Task 1: Intersection Control Violation Crash
Analyses, and Task 2: Top-Level System and Human Factors Requirements (DOT-HS-809-716) |
Funding Agency and Contact Address National Highway Traffic Safety
Administration
400 Seventh Street, S.W.
Washington, DC 20590 COTR: Kerrin Bressant |
| Authors Lee, S.E., Knipling, R.R., DeHart, M.A., Perez, M.A., Holbrook, G.T., Brown, S.B., Stone, S.R., and Olson, R.L. |
| Publication Date March 2004 |
Number of Pages 209 |
| Document Web Site http://www-nrd.nhtsa.dot.gov/departments/nrd-12/pubs_rev.html |
| Source Type Crash/Demographic Statistical Analysis |
| Driving Conditions Normal |
Vehicle Platforms Light Vehicles |
| Objective Task 1: To characterize light-vehicle violation crashes so that intersection violation countermeasures could be
developed in subsequent project tasks. |
| General Approach Task 1 of this project involved a series of database analyses to create a clear problem definition for
intersection violation crashes. |
Methods
- Task 1 analyses included an overall crossing-path (CP) crash problem size description by injury severity level, followed by increasingly detailed
analyses of crash type, traffic control devices, violation distributions and types, causal factors, speed behavior, and infrastructure components.
- Analyses included identification of major causal factors for each subtype of intersection control violation.
- The Virginia Tech Transportation Institute (VTTI) used the NHTSA General Estimates System (GES) database to characterize the violation CP crash
problem for the years 1999 and 2000.
- Task 1 analyses were performed in a top-down manner, beginning with defining the overall crash problem and then refining the analyses in later
subtasks.
|
| Key Terms Intersection Crashes, Stop Sign Violations, Signal Violations, Forward Collision Warning, Traffic Control
Violation Warning, Crash Countermeasures |
Key Results
- Left-turn crashes make up the majority of the CP crash types, at about 52 percent for the years 1998 through 2000.
- The next most prevalent type is the straight CP crash type, at about 30 to 35 percent, followed by unknown CP crashes at 7 to 11 percent.
- Right-turn crashes are the least common, at about 6 percent of all CP crashes for 1998 through 2000.
- Stop-sign CP crashes in which only one vehicle had a stop sign were four or five times more prevalent than crashes in which both vehicles had
a stop sign.
- Those citation types deemed to be most amenable to the Intersection Crash Avoidance, Violation (ICAV), countermeasures were speeding, reckless
driving, failure to yield right of way, and running a stop sign or traffic signal; thus, these were the violation types explored for this subtask.
- In terms of the overall analysis, for the left- and right-turn crash types, more drivers were cited who made turning precrash maneuvers than
straight precrash maneuvers.
- Among all crash types and injury levels, driver distraction and inattention was the largest primary contributing factor, at 37 percent. This
finding validates some of the assumptions made in the early stages of the ICAV project, in that one of the primary purposes of the ICAV system is
to capture the attention of the inattentive or distracted driver.
|
Figure A. Percentage of violation types across all CP crash types, 2000 GES (bars represent 95 percent confidence interval).
|
Conclusions, Recommendations, Best Practices, Design Implications, or Design Guidelines
- Although an ICAV-target crash population could not be defined and determined with specificity in task 1 based on GES variables, populations
likely to be addressable by the countermeasure concept were identified as part of subtask 1.4.
- An estimated 261,000 light-vehicle crashes in 1999 and 162,000 in 2000 occurred at intersections where one of the two vehicles had a stop sign
and was charged with a violation. There were an estimated 133,000 crashes in 1999 and 99,000 crashes in 2000 involving traffic signal violations.
These crash populations could be target crashes for ICAV.
|
General Comments
- This review is part 1 of a two-part review and covers task 1 of the report.
- This report summarized tasks 1 and 2 of the larger Vehicle-Based Countermeasures for Signal and Stop Sign Violations project
|
| Title Vehicle-Based Countermeasures for Signal and Stop Sign Violations, Task 1: Intersection Control Violation Crash
Analyses, and Task 2: Top-Level System and Human Factors Requirements (DOT-HS-809-716) |
Funding Agency and Contact Address National Highway Traffic Safety
Administration
400 Seventh Street, S.W.
Washington, DC 20590 COTR: Kerrin Bressant |
| Authors Lee, S.E., Knipling, R.R., DeHart, M.A., Perez, M.A., Holbrook, G.T., Brown, S.B., Stone, S.R., and Olson, R.L. |
| Publication Date March 2004 |
Number of Pages 209 |
| Document Web Site http://www-nrd.nhtsa.dot.gov/departments/nrd-12/pubs_rev.html |
| Source Type Literature Review |
| Driving Conditions Normal |
Vehicle Platforms Light Vehicles |
| Objective Task 2: To determine the high-level requirements for a countermeasure system to address the intersection
control violation problem. |
| General Approach Task 2 of this project comprises a literature review based on a review of more than 60 reports and
other publications related to intersection crashes and countermeasures. |
| Methods This task 2 literature review outlines the problem-size description for intersection crashes, the general causal
factors for the intersection crashes of interest, the approaches taken for this problem, and the components required to make such a system work. Major
topics addressed include:
- Intersection crash problem description:
- Previous analytical studies of crash data.
- Studies of RLR and camera enforcement.
- Computation algorithm parameters (e.g., brake reaction time, models of braking performance).
- Driver-vehicle interface (DVI) considerations (also see appendix A).
- Behavioral adaptation to countermeasures.
- Previously tested vehicle-based countermeasures for intersection crashes/violations (with emphasis on the NHTSA-sponsored Veridian Intersection
Collision Avoidance program).
|
| Key Terms Intersection Crashes, Stop Sign Violations, Signal Violations, Forward Collision Warning, Traffic Control
Violation Warning, Crash Countermeasures |
Key Results
- Preliminary requirements and specifications for Intersection Crash Avoidance, Violation (ICAV) deployment, Field Operational Test (FOT), and
test-bed systems were developed.
- Based on the requirements and specifications developed in task 2, a set of specifications requiring further testing and not definitively
scheduled to be performed by any other group (such as the Crash Avoidance Metrics Partnership (CAMP) or the Infrastructure Consortium) is presented.
- The figure below depicts the three-phase ICAV development process and feedback loop.
|
Figure A. Three-phase ICAV development process and feedback loop.
|
| Conclusions, Recommendations, Best Practices, Design Implications, or Design Guidelines Preliminary requirements and
specifications for ICAV deployment, FOT, and test-bed systems were developed as follows: Stop Sign Deployment System:
- Position system: Lateral vehicle position accuracy, longitudinal vehicle position accuracy, stopping location accuracy relative to stop
bar, vehicle offset, update rate, data latency.
- In-vehicle sensors: Speed (four specifications), acceleration (four specifications), braking status (four specifications), heading angle
(four specifications).
- Computations: Computational speed (latency), false alarm rate, miss rate, driver acceptance.
- Driver-vehicle interface: Levels of alert, recommended modality, visual display (seven specifications), auditory display (five
specifications), haptic display (four specifications).
Stop Sign FOT System:
- Positioning: Maximum time loss for positioning data, lateral vehicle position accuracy, longitudinal vehicle position accuracy, update
rate, vehicle offset, stopping location accuracy, data latency.
- In-vehicle sensors: Speed (four specifications), acceleration (four specifications), braking status (four specifications), heading angle
(four specifications).
- Computations: Computational speed (latency), false alarm rate, miss rate, driver acceptance.
- Driver-vehicle interface: Levels of alert, recommended modality, visual display (seven specifications), auditory display (five
specifications), haptic display (four specifications).
Signalized Intersection Deployment System (communications only; others are the same as for stop sign case):
- Communications link with infrastructure: Communication path, data latency, update rate, range, content of data stream (packet content),
packet size.
Signalized Intersection FOT System (communications only; others are the same as for stop sign case):
- Communications link with infrastructure: Communication path, data latency, update rate, range, content of data stream (packet content),
packet size.
|
General Comments
- This review is part 2 of a two-part review and covers task 2 of the report.
- This report summarized tasks 1 and 2 of the larger Vehicle-Based Countermeasures for Signal and Stop Sign Violations project.
|
| Title Older Driver Perception-Reaction Time for Intersection Sight Distance and Object Detection, Volume I: Final Report
(FHWA-RD-93-168) |
Funding Agency and Contact Address Office of Safety and Traffic Operations
Research and Development
Federal Highway Administration
6300 Georgetown Pike
McLean, VA 22101-2296 COTR: Elizabeth Alicandri |
| Authors Lerner, N.D., Huey, R.W., McGee, H.W., and Sullivan, A. |
| Publication Date January 1995 |
Number of Pages 116 |
| Document Web Site None |
| Source Type On-Road Study |
| Driving Conditions Normal |
Vehicle Platforms Not Specified |
| Objective To determine the appropriate perception-reaction time (PRT) values for use in design equations for stopping
sight distance (SSD), intersection sight distance (ISD), and decision sight distance (DSD). |
| General Approach Four on-road experiments investigated whether the assumed values for driver PRT used in AASHTO design
equations adequately represent the range of actual PRT for older drivers. |
| Methods Case III (Stop-Controlled) Intersection Sight Distance:
- A total of 102 subjects (thirty-three 20 to 40 year olds, thirty-five 65 to 69 year olds, and thirty-four age 70 plus) drove their vehicles over
an extended route, including a number of stop-controlled intersections.
- The experiment included a variety of intersection characteristics and left-turn, right-turn, and crossing vehicle maneuvers.
Stopping Sight Distance:
- Data were obtained from 116 subjects (thirty 20 to 40 year olds, forty-three 65 to 69 year olds, and forty-three age 70 plus).
- Subjects were driving their cars along a route and did not know that an event requiring rapid braking would occur.
- At one point along the route, protected from other traffic, a crash barrel rolled from behind brush on a berm and onto the edge of the roadway.
- The driver’s PRT was measured from the moment the barrel came into the driver’s view until the driver stepped on the brake.
Decision Sight Distance:
- Subjects drove their vehicles along an extended route that included both freeway and arterial sections.
- At various sites, lane-change maneuvers were required by roadway features that were appropriate to the decision sight distance model.
- Drivers verbalized when they first noted the necessity of changing lanes; they also verbally indicated the cue that informed them of the need to
make the maneuver.
- PRT was measured from the point where the cue first became visible to the moment the driver verbalized the need to change lanes.
Gap/Lag Acceptance:
- A total of 138 subjects (fifty-two 20 to 40 year olds, thirty-nine 65 to 69 year olds, and forty-seven age 70 plus) participated.
- Subjects were not actually driving. They viewed traffic from a vehicle on the roadside and made decisions about when it would be safe to make
various maneuvers.
|
| Key Terms Older Drivers, Aging, Perception-Reaction Time, Sight Distance |
| Key Results Case III (Stop-Controlled) Intersection Sight Distance:
- The results indicated that older drivers did not have longer PRT than younger drivers.
- The 85th percentile PRT closely matched the AASHTO design equation value of 2.0 s.
- Although older drivers did not appear to require more time at intersections, there was an age-by-gender interaction. Women in the oldest group
were slower than men for both PRT and maneuver times.
Stopping Sight Distance:
- Driver reactions: Of the 116 valid subjects, 101 (87 percent) made some overt vehicle maneuver in reaction to the emergence of the crash barrel
(36.2 percent swerved only, 7.8 percent braked only, and 43.1 percent both braked and swerved).
- Brake PRT: The mean brake reaction time, overall and for various subgroups, was about 1.5 s, with a standard deviation of about 0.4 s (see table
A). The 85th percentile brake reaction time is approximately 1.9 s.
- There were apparent differences in the distribution of PRT among age groups.
- Younger drivers accounted for most of the fastest PRT, but there were no age differences in the 50th or 85th percentiles.
- All observed PRT were encompassed by the current AASHTO design value of 2.5 s.
Decision Sight Distance:
- Although observed DSD values were generally longer with increasing driver age, the 85th percentile PRT for all age groups were well
below AASHTO design assumptions (see table B).
Gap/Lag Acceptance:
- Younger subjects accepted shorter gaps and rejected lags later than older subjects.
- Averaged over all conditions, the point at which 50 percent of the subjects would accept a gap was just over 1 s longer for the oldest group than
it was for the youngest group.
- The oldest group had a mean lag rejection point that was about 0.5 s longer than the younger subjects.
Table A. Mean (standard deviation (S.D.)), median, and 85th percentile brake reaction times.
| Group |
S.D. |
50th percentile |
85th percentile |
| All (n = 56) |
1.51 (0.39) |
1.44 |
1.91 |
| |
|
|
|
| Male (26) |
1.49 (0.34) |
1.42 |
1.88 |
| Female (30) |
1.52 (0.44) |
1.47 |
1.93 |
| |
|
|
|
| 20-40 years old (14) |
1.44 (0.48) |
1.35 |
1.97 |
| 65-69 years old (18) |
1.59 (0.38) |
1.47 |
1.92 |
| Age 70+ (24) |
1.49 (0.34) |
1.52 |
1.72 |
Table B. 50th and 85th percentile PRT by age, situation type, and daytime/nighttime condition.
| Age Group |
Freeway PRT (s) |
Arterial PRT (s) |
| 50th percentile |
85th percentile |
50th percentile |
85th percentile |
| Day |
Night |
Day |
Night |
Day |
Night |
Day |
Night |
| 20-40 |
2.9 |
3.8 |
7.8 |
7.1 |
2.0 |
2.8 |
4.2 |
5.2 |
| 65-69 |
3.9 |
3.8 |
7.6 |
6.7 |
2.8 |
2.4 |
7.6 |
4.9 |
| 70+ |
4.2 |
4.0 |
7.8 |
7.0 |
3.4 |
2.8 |
7.1 |
5.6 |
| AASHTO |
|
10.0 |
|
9.5 |
|
Conclusions, Recommendations, Best Practices, Design Implications, or Design Guidelines
- Based on these findings and consideration of the implications of changes in PRT for sight distance requirements, no changes to the design PRT
values, based on older driver performance, were recommended for ISD, SSD, or DSD.
- Overall, it would appear that to the extent current models are reasonable and are appropriate analogs of actual driver behavior, the PRT design
parameters of those models are generally adequate to accommodate most older drivers.
|
| General Comments None |
| Title Association of Selected Intersection Factors With Red-Light Running Crashes (FHWA-RD-00-112) |
Funding Agency and Contact Address Federal Highway Administration
6300 Georgetown Pike
McLean, VA 22101-2296 COTR: Not Specified |
| Authors Mohamedshah, Y.M., Chen, L.W., and Council, F.M. |
| Publication Date May 2000 |
Number of Pages 6 |
| Document Web Site http://www.tfhrc.gov/library/library.htm |
| Source Type Crash/Demographic Statistical Analysis |
| Driving Conditions Normal |
Vehicle Platforms All |
| Objective To examine selected geometric characteristics of intersections and their impact on red-light running (RLR)
crash rates and to establish a relationship between them. |
General Approach
- The major questions addressed in this report concerning RLR crashes are:
- Does the width of the cross street have any effect on RLR crash risk?
- What is the relationship of other select intersection characteristics?
- Using this information, how can one better target urban intersections for traffic law enforcement techniques such as RLR cameras or
heightened intersection enforcement coupled with publicity?
|
| Methods State Databases Used:
- Data from the Highway Safety Information System (HSIS) database for California was reviewed.
- Crash files for a 4-year period (from 1993 through 1996) and the intersection data for 1996 were used to develop a model that shows the
relationship of geometric variables to RLR crashes.
Analysis Methods and Model Development:
- Limited contingency table analysis was done to examine the similarities and the differences between RLR crashes and all crashes at urban
signalized intersections (USI).
- Regression-type models were developed to examine the effects of intersection characteristics on RLR crash frequencies.
- Separate models were developed to predict RLR crashes for streets defined in the raw intersection file as "mainline" (i.e., primarily
higher volume streets) and for streets defined as "cross streets" (i.e., primarilylower volume streets).
|
| Key Terms Red–Light Running, Intersections, Urban Signalized Intersections |
| Key Results Effect of Cross-Street Lanes:
- The negative-binomial model for the cross street shows that there is a 7-percent increase in cross-street RLR crashes for each one-lane
increase when one controls for signal operation type, opposite street ADT, and left-turn channelization (see figure A).
- However, the number of cross-street lanes did not have a significant effect on mainline RLR crashes.
Effect of ADT:
- RLR crashes on the mainline seemed to increase with higher entering street ADT, as well as with the increase in cross-street ADT per lane.
- Similar to the mainline, RLR crashes involving vehicles entering from the cross street tended to increase with higher entering street ADT.
However, in contrast to the mainline finding, RLR crashes for vehicles entering from the cross street did not increase with the opposite-street ADT
per lane.
Effect of Traffic Control:
- Fully actuated signals tend to have more crashes per approaching street than approaches with semi–actuated and pretimed signals (35 to 39
percent higher than pretimed) when other factors are held constant (see figure B).
|
| Figure A. Effects of the number of cross–street lanes on crashes. |
Figure B. Effects of traffic control type. |
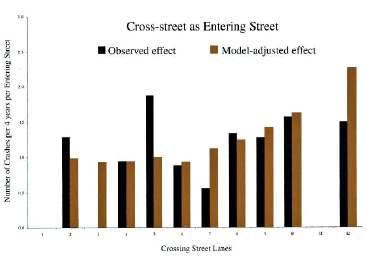 |
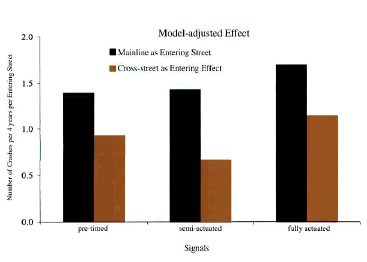 |
|
Conclusions, Recommendations, Best Practices, Design Implications, or Design Guidelines
- The results obtained from the model show that the traffic volume on both the entering and crossing streets, the type of signal in operation at
the intersection, and the width of the cross street (as measured by the
number of cross-street lanes) are the major variables affecting RLR crashes.
- The intersections with higher entering volumes on the mainline and cross streets, especially intersections with high volumes on cross streets;
intersections where the volume on a minor road is relatively high, coupled with a wide mainline street; and locations with fully actuated signals
would be considered as highpriority intersections for such treatments as installing cameras that detect RLR or heightened spot enforcement coupled
with publicity.
|
| General Comments None |
| Title Analysis of Crossing-Path Crashes (DOT-HS-809-423) |
Funding Agency and Contact Address National Highway Traffic Safety Administration
400 Seventh Street, S.W.
Washington, DC 20590 COTR: Not Specified |
| Authors Najm, W.G., Smith, J.D., and Smith, D.L. |
| Publication Date July 2001 |
Number of Pages 76 |
| Document Web Site http://www.tfhrc.gov/safety/ihsdm/libweb.htm |
| Source Type Crash/Demographic Statistical Analysis |
| Driving Conditions Normal |
Vehicle Platforms All Vehicles |
| Objective To define the problem of crossing-path (CP) crashes in the United States. This analysis of CP crashes is
concerned with understanding the precrash scenarios in order to evaluate proposed countermeasure designs. |
| General Approach This report separates CP crashes into five common scenarios that represent vehicle movements immediately
prior to the crash. This report also describes the locations where CP crashes occurred in terms of their relationship to a roadway junction and the type of
traffic control device at these locations. |
Methods
- The NHTSA National Automotive Sampling System (NASS) was principally used in this analysis.
- This study also queried the 1998 General Estimates System (GES) for fatal crashes to see if the fatality demographics followed the crash
demographics, or if some types of CP crash scenarios had more fatalities than others.
- These GES fatal crash counts were also compared to statistics from the 1998 Fatality Analysis ReportingSystem (FARS).
|
| Key Terms Crossing-Path Crash, Traffic Conflict, Crash Scenario, Crash Frequency, Opposite Direction Conflict, Lateral
Direction Conflict, Merge Conflict, Straight Crossing Paths, Relationship to Junction, Traffic Control Device, Violation Charged, Vision Obstruction, Driver
Distraction, Pedestrian, Pedalcyclist. |
Key Results
- Five common CP crash scenarios: (1) left turn across path–opposite direction conflict (LTAP/OD); (2) left turn across path–lateral
direction conflict (LTAP/LD); (3) left turn into path–merge conflict (LTIP); (4) right turn into path–merge conflict (RTIP); and (5)
straight crossing paths (SCP).
- CP crashes accounted for about 1.72 million police-reported collisions in 1998 based on the GES statistics.
- GES estimated that more CP crashes occurred at unsignalized intersections and driveways than at signalized intersections (about 42 percent of
CP crashes occurred in the presence of signals, while the remaining 58 percent occurred at unsignalized intersections).
- The analysis of the 1998 GES revealed that CP crashes at intersections with no controls had the highest fatality rates
- "Failure to Yield Right of Way" was the most dominant violation in all CP crash scenarios at intersections and driveways controlled
by stop signs or with no controls (see table below).
- Alcohol and drug violations were charged to fewer than 2 percent of the vehicles involved in CP crashes at intersections and driveways.
- About 9 percent of drivers attributed vision obstruction as a contributing factor in LTAP crashes at intersections with either no controls or
stop signs. Vision obstruction was also reported by about 16 percent and 10 percent of drivers involved in LTAP crashes at driveways with stop
signs and no controls, respectively.
- Pedestrian crashes are typically severe and account for about 15 percent of the total collision fatality population each year.
- Pedestrian and pedalcyclist collisions are more likely to be fatal at nonjunction locations than at intersections, and are more likely to be
fatal at intersections than at driveways.
- The most dominant precrash event of pedestrian and pedalcyclist collisions involved a vehicle that was in the process of turning/merging,
was preparing to turn/merge, or had just completed a turning/merging maneuver.
Table A. Violations charged to vehicles in CP crashes at driveways (based on 1998 GES).
| Traffic Control Device |
Violation Charged |
LTAP/OD |
LTAP/LD |
LTIP |
RTIP |
SCP |
Other |
| Turning |
Straight |
Turning |
Straight |
Turning |
Straight |
Turning |
Straight |
| Signal |
Alcohol or Drugs |
|
|
4.8% |
|
24.1% |
|
7.5% |
|
|
|
| Speeding |
|
|
|
|
|
|
|
|
|
0.1% |
| Alcohol or Drugs and Speeding |
|
|
|
|
|
|
|
|
|
|
| Reckless Driving |
|
|
|
|
|
|
|
|
|
|
| Failure to Yield Right of Way |
26.6% |
1.3% |
11.1% |
1.8% |
|
7.9% |
15.8% |
|
4.1% |
3.2% |
| Running a Traffic Signal or Stop Sign |
|
3.8% |
|
8.2% |
|
|
|
|
16.6% |
1.3% |
| Other Violation |
11.0% |
13.7% |
20.9% |
3.4% |
|
13.5% |
30.5% |
0.1% |
0.2% |
15.1% |
| |
| Sign Stop |
Alcohol or Drugs |
|
|
|
|
|
|
|
|
|
|
| Speeding |
|
|
|
|
|
|
|
|
|
|
| Alcohol or Drugs and Speeding |
|
|
|
|
|
|
|
|
|
|
| Reckless Driving |
|
|
|
|
|
|
|
|
|
|
| Failure to Yield Right of Way |
63.3% |
|
30.9% |
0.7% |
40.2% |
|
41.7% |
|
19.0% |
13.8% |
| Running a Traffic Signal or Stop Sign |
|
|
3.9% |
|
2.7% |
|
5.1% |
|
|
|
| Other Violation |
|
|
14.7% |
2.4% |
14.6% |
0.1% |
20.2% |
|
4.9% |
9.0% |
| |
| No Controls |
Alcohol or Drugs |
0.9% |
|
0.7% |
|
0.5% |
|
|
|
0.2% |
0.3% |
| Speeding |
|
0.7% |
0.1% |
|
1.0% |
|
|
0.3% |
|
1.3% |
| Alcohol or Drugs and Speeding |
|
|
|
|
|
|
|
0.3% |
|
|
| Reckless Driving |
0.6% |
|
|
0.1% |
|
|
0.5% |
|
|
|
| Failure to Yield Right of Way |
31.2% |
0.1% |
38.6% |
0.1% |
36.2% |
0.3% |
28.6% |
|
14.4% |
5.9% |
| Running a Traffic Signal or Stop Sign |
|
|
0.1% |
|
|
|
|
|
|
|
| Other Violation |
17.1% |
7.3% |
17.2% |
6.1% |
10.6% |
5.2% |
26.1% |
10.2% |
10.5% |
17.8% |
Note: Empty cells refer to scenarios that had no crashes in the 1998 GES sample.
|
| Conclusions, Recommendations, Best Practices, Design Implications, or Design Guidelines See Key Results above. |
| General Comments None |
| Title Guidance for Implementation of the AASHTO Strategic Highway Safety Plan, Volume 5: A Guide for Addressing
Unsignalized Intersection Collisions, NCHRP Report 500 |
Funding Agency and Contact Address National Cooperative Highway
Research Program Transportation Research Board
500 Fifth Street, N.W.
Washington, DC 20001 COTR: Not Specified |
| Authors Neuman, T.R., Pfefer, R., Slack, K.L., Hardy, K.K., Harwood, D.W., Potts, I.B., Torbic, D.J., and Kohlman Rabbani,
E.R. |
| Publication Date 2003 |
Number of Pages 71 |
| Document Web Site http://trb.org/news/blurb_browse.asp?id=2 |
| Source Type Guidelines and Recommendations |
| Driving Conditions Normal |
Vehicle Platforms All |
| Objective To provide guidance to highway agencies that want to implement safety improvements at unsignalized intersections.
Includes a variety of strategies that may be applicable to particular locations. |
| General Approach NCHRP Project 17-18(3) is a series of guides to assist State and local agencies in reducing injuries and
fatalities in targeted areas. Each guide includes a brief introduction, a general description of the problem, the strategies/countermeasures to address the
problem, and a model implementation process. |
| Methods The strategies in this guide were identified from a number of sources, including the literature, contact with State
and local agencies throughout the United States, and Federal programs. Some of the strategies are widely used, while others are used at a State or even local
level of the safety system. |
| Key Terms Unsignalized Intersections, Traffic Control Devices, Geometric Design Improvements, Traffic Calming |
| Key Results The objectives for improving safety at unsignalized intersections and the strategies to achieve them are
listed below.
- Improve management of access near unsignalized intersections: Implement driveway closures/relocations and implement driveway turn
restrictions.
- Reduce the frequency and severity of intersection conflicts through geometric design improvements: Provide the following at
intersections: Left-turn lanes, offset left-turn lanes, bypass lanes on shoulders at T-intersections, left-turn acceleration lanes at
divided-highway intersections, right-turn lanes, offset right-turn lanes, right-turn acceleration lanes, full-width paved shoulders, signage to
restrict or eliminate turning maneuvers. Close or relocate high-risk intersections. Convert four-leg intersections to two T-intersections. Convert
offset Tintersections to four-leg intersections. Realign intersection approaches to reduce or eliminate intersection skew. Use indirect left-turn
treatments to minimize conflicts at divided-highway intersections. Improve pedestrian and bicycle facilities to reduce conflicts between
motorists and nonmotorists.
- Improve sight distance at unsignalized intersections: Provide clear sight triangles on stop- or yield-controlled approaches to
intersections. Provide clear sight triangles in the medians of divided highways near intersections. Change horizontal and/or vertical alignment
of approaches to provide more sight distance. Eliminate parking that restricts sight distance.
- Improve availability of gaps in traffic and assist drivers in judging gap sizes at unsignalized intersections: Provide an automated
real-time system to inform drivers of the suitability of available gaps for making turning and crossing maneuvers. Provide roadside markers or
pavement markings to assist drivers in judging the suitability of available gaps for making turning and crossing maneuvers. Re-time adjacent
signals to create gaps at stop-controlled intersections.
- Improve driver awareness of intersections as viewed from the intersection approach: Improve visibility of intersections by providing
enhanced signage and delineation. Improve visibility of the intersection by providing lighting. Install splitter islands on the minor-road approach
to an intersection. Provide a stop bar on minor-road approaches. Install larger regulatory and warning signs at intersections. Call attention to
the intersection by installing rumble strips on approaches. Provide dashed markings for major-road continuity across the median opening at
divided-highway intersections. Provide supplementary stop signs mounted over the roadway. Provide pavement markings with supplementary messages.
Provide improved maintenance of stop signs. Install flashing beacons at stop-controlled intersections.
- Choose appropriate intersection traffic control to minimize crash frequency and severity: Avoid signalized through roads. Provide
all-way stop control at appropriate intersections. Provide roundabouts at appropriate locations.
- Improve driver compliance with traffic control devices and traffic laws at intersections: Provide targeted enforcement to reduce
stop sign violations. Provide targeted public information and education on safety problems at specific intersections.
- Reduce operating speeds on specific intersection approaches: Provide targeted speed enforcement. Provide traffic calming on
intersection approaches through a combination of geometrics and traffic control devices. Post appropriate speed limit on intersection approaches.
- Guide motorists more effectively through complex intersections: rovide turn-path markings. Provide a double yellow centerline on the
median opening of a divided highway at intersections. Provide lane assignment signage or marking at complex intersections.
The model process for implementing a program of strategies for any given emphasis area of the AASHTO Strategic Highway Safety Plan is listed below:
- Model Process: Identify and define the problem; recruit appropriate participants for the program; establish crashreduction goals; develop program
policies, guidelines, and specifications; develop alternative approaches to addressing the problem; evaluate alternatives and select a plan; submit
recommendations for action by top management; develop a plan of action; establish foundations for implementing the program; carry out the action
plan; and assess and transition the program.
|
| Conclusions, Recommendations, Best Practices, Design Implications, or Design Guidelines See Key Results above. |
| General Comments This is the fifth volume of Guidance for Implementation of the AASHTO Strategic Highway Safety
Plan, NCHRP Report 500 (a series in which relevant information is assembled into single, concise volumes, each pertaining to specific types of highway
crashes or contributing factors). |
| Title Intersection Collision Avoidance Using ITS Countermeasures, Performance Guidelines, Final Report (DOT-HS-809-171)
|
Funding Agency and Contact Address U.S. Department of Transportation
National Highway Traffic
Safety Administration
Office of Advanced Safety Research
Washington, DC 20590 COTR: Not Specified |
| Authors Pierowicz, J., Jocoy, E., Lloyd, M., Bittner, A., and Pirson, B. |
| Publication Date September 2000 |
Number of Pages 172 |
| Document Web Site http://www.its.dot.gov/itsweb/EDL_webpages/webpages/SearchPages/Alpha_Search.cfm |
| Source Type Closed-Track Study |
| Driving Conditions Imminent Crash (ICA) |
Vehicle Platforms Light Vehicles |
| Objective To develop an Intersection Collision Avoidance System (ICAS) test bed, implement the systems on a vehicle, and
perform testing to determine the potential effectiveness of the system in preventing intersection crashes. |
General Approach
- This report documents the analyses performed in support of the Intersection Collision Avoidance Using ITS Countermeasures program.
- The overall effort consisted of three phases: Analytical, design, and implementation. This report is the final product of the implementation
phase.
|
| Methods There were three technical phases associated with this project: (1) analytical, (2) design, and (3) implementation.
The analytical tasks performed in phase I indicated that while crashes occurred at intersections with varying configurations, the causes and major
characteristics of these crashes demonstrated similar features. Three countermeasure concepts were developed from the analyses of these crashes.
In phase II, an Intersection Collision Avoidance (ICA) test-bed vehicle was designed based on the functional descriptions of the countermeasure concepts
developed in phase I. The test-bed vehicle was constructed and tested in phase III. |
| Key Terms Intersection Collision Avoidance System (ICAS), Performance Guidelines, Driver-Vehicle Interface (DVI), ICAS
Test Bed, Threat Detection System |
Key Results
- The ICAS test-bed vehicle was a Ford Crown Victoria that supported the following features:
- Threat detection system.
- Geographical Information System/Global Positioning System (GIS/GPS).
- Driver-Vehicle Interface, including Head-Up Display (HUD), auditory system, and haptic warning system.
- Vehicle systems that integrate the ICAS equipment into the test-bed vehicle.
- The two primary defensive collision scenarios, left turn across path (LTAP) and violation of traffic control, were encountered during testing of
the countermeasures; the countermeasure was found to be able to detect and warn the driver about an impending collision.
- The Differential GPS/GIS system software was able to access the map database in real time to support transfer of intersection information to
the threat detection system and unsignalized intersection warning system in a timely manner.
- The physical size limitations of the antennas for the limited coverage system and the full coverage system may make lane discrimination difficult
because the beam width is too large.
|
| Figure A. ICAS architecture. |
 |
|
| Conclusions, Recommendations, Best Practices, Design Implications, or Design Guidelines Design Guidelines:
The following guidelines were used in designing the on-vehicle ICAS:
- System should not rely on systems on other vehicles.
- There should be minimum reliance on infrastructure.
- Minimum crash severity should occur if crash cannot be completely avoided.
- System should operate in all weather.
- Maximum use of intersection parameters derived from on-board GIS map and GPS.
Recommendations:
- Integrate LTAP sensor algorithms developed on the ICAS into the NHTSA IVI program.
- Continue development of map-based unsignalized intersection system.
- Fund development of forward-viewing, wide-field sensor.
- Investigate use of signal-to-vehicle communications to improve ICAS effectiveness.
- Continue investigation of DVI effectiveness and driver acceptance.
|
| General Comments None |
| Title Influence of Traffic Signal Timing on Red-Light Running and Potential Vehicle Conflicts at Urban Intersections
(Transportation Research Record 1595, pp. 1-7) |
Funding Agency and Contact Address Insurance Institute for Highway Safety
1005 North Glebe Road
Arlington, VA 22201 COTR: Not Specified |
| Authors Retting, R.A., and Greene, M.A. |
| Publication Date 1997 |
Number of Pages 7 |
| Document Web Site None |
| Source Type Field Test |
| Driving Conditions Normal |
Vehicle Platforms Not Specified |
| Objective To examine vehicle actions in relation to change-interval timing at intersections where the all-red interval
or the yellow interval, or both, was lengthened. |
| General Approach Data were collected during an experiment in an urban location involving changes in signal timing at some
10 intersections. Observations included the proportion of signal cycles with vehicles entering on a red light and the proportion of vehicles exiting the
intersection after the onset of a conflicting green signal. |
| Methods
Study Site:
- Research was conducted in a medium-sized city in New York State.
Intersection Selection:
- To be eligible for selection, an intersection required a yellow or an all-red phase, or both, that was shorter than the value computed using the
Institute of Transportation Engineers (ITE)-proposed recommended practice for determining vehicle change intervals.
- This procedure computes yellow interval timing as a function of approach speed and grade, along with assumed values for
perception-reaction time, deceleration rate, and acceleration caused by gravity.
- From these intersections, 10 were chosen at random for the study. Each intersection contributed 2 sites, for a total of 20 sites.
Data Collection:
- Fifty-six measurement sessions were conducted.
- Observers used portable laptop computers to record information about each vehicle that approached the site and entered after the onset of the
yellow signal.
- There were three categories of cycles: (1) violation cycles (those with at least one red-light run or one late exit by a through vehicle), (2)
nonviolation cycles (those in which at least one vehicle approached the site during the yellow or red signal and then stopped or turned), and (3)
inactive cycles (those in which no vehicles approached or entered the site).
|
| Key Terms Red-Light Violations, Intersection Safety, All-Red Interval, Yellow Interval |
| Key Results Red-Light Running Study:
- The results indicated that red-light running (RLR) is low for sites where the all-red signal length is below about 55 percent of the ITE value,
and there is a positive slope up to about 80 percent of the ITE value, followed by a negative slope.
- The results showed that RLR decreases when yellow intervals are increased.
Late-Exit Study:
- The results show a downward trend from about 70 percent of the ITE-proposed recommended timing (i.e., as the length of the all-red period
increases, the percentage of cycles with late exits decreases).
- The results show a trend to support the finding that with the exception of a few sites with long yellow signals, sites with shorter yellow
signals tend to have more late exits.
- Yellow timing was lengthened at some sites. Four sites (A, F, P, and Q) had both intervals changed, and showed substantial decreases in the
proportion of late exits.
- Four other sites (B, I, M, and N) had the yellow timing lengthened. All sites, except N, showed substantial decreases in the proportion of late
exits.
- In wave 3, sites Q, R, and O had about the same all-red signal timing with about the same percentage of late exits. Site P strongly contrasted
with this pattern; the all-red timing was increased in wave 3 from 105 to 112 percent of the ITE value; however, late exits increased from 3 to 11
percent.
|
Conclusions, Recommendations, Best Practices, Design Implications, or Design Guidelines
- The RLR study shows that increasing the length of the yellow signal toward the ITE recommendations significantly decreased the chance of RLR.
The length of the all-red interval did not seem to affect RLR. Finally, habituation to the longer yellow appeared to be confined to a single site.
- The results indicate that change intervals set closer to ITE’s proposed recommended practice can reducered-light violations and potential right
–angle vehicle conflicts and that such safety benefits can be sustained.
|
| General Comments None |
| Title Roundabouts: An Informational Guide (FHWA-PL-00-067) |
Funding Agency and Contact Address Federal Highway Administration
6300 Georgetown Pike
McLean, VA 22101-2296 COTR: Joe Bared |
| Authors Robinson, B.W., Rodegerdts, L., Scarborough, W.,
Kittelson, W., Troutbeck, R., Brion, W., Bondzio, L.,
Courage, K., Kyte, M., Mason, J., Flannery, A., Myers, E., Bunker, J., and Jacquemart, G. |
| Publication Date June 2000 |
Number of Pages 284 |
| Document Web Site None |
| Source Type Informational Guide |
| Driving Conditions Normal |
Vehicle Platforms Not Specified |
| Objective To provide an informational guide on the use of roundabouts. |
| General Approach
The guidance supplied in this document is based on established international and U.S. practices and is supplemented by recent research. The guide is
comprehensive in recognition of the diverse needs of transportation professionals and the public for introductory material through design detail, as well as
the wide range of potential applications of roundabout intersections. |
|
Methods This guide has been developed with the input from transportation practitioners and researchers around the world.
|
| Key Terms Roundabouts, Traffic Circles, Intersections, Traffic Control, Intersection Design, Intersection Performance,
Intersection Safety, Highway Capacity |
| Key Results
Policy Considerations:
- Safety: Roundabouts have been demonstrated to be generally safer for motor vehicles and pedestrians than other forms of at-grade
intersections.
- Vehicle delay and queue storage: When operating within their capacity, roundabout intersections typically operate with lowervehicle
delays than other intersection forms and control types.
- Delay of major movements: Since all intersection movements have equal priority at a roundabout, major-street movements may be delayed
more than desired.
- Spatial requirements: Roundabouts usually require more space for the circular roadway and central island than the traditional.
- Traffic calming: By reducing speeds, roundabouts complement other traffic-calming measures.
- Pedestrians: Pedestrian crossings should be set back from the yield line by one or more vehicle lengths.
- Bicycles: Bicycle lanes through roundabouts should never be used.
- Large Vehicles: Design roundabouts to accommodate the largest vehicle that can reasonably be expected.
- Transit: Public transit buses should not be forced to use a truck apron to negotiate a roundabout.
Planning:
- Planning steps: Consider the context; etermine a preliminary lane configuration and roundabout category based on capacity requirements;
identify the selection category; perform the analysis appropriate to the selection category; determine the space requirements; and, if additional
space must be acquired, an economic evaluation may be useful.
- Considerations of context: Consider whether the roundabout will be part of a new roadway, the first in the area, or a retrofit of an
existing intersection.
- Number of entry lanes: The volume-to-capacity ratio of any roundabout leg is recommended to not exceed 0.85.
- Comparing operational performance of alternative intersection types: Roundabouts may offer an effective solution at twoway,
stop-controlled intersections with heavy left turns from the major street. Roundabouts work better when the proportion of minor-street traffic is
higher. A substantial part of the delay-reduction benefit of roundabouts, compared to all-way stopcontrolled intersections, comes during off-peak
periods.
- Space requirements: There are design templates in appendix B that may be used to determine initial space requirements.
Operation:
- Traffic operation at roundabouts: Approach speed is governed by the approach roadway width, roadway curvature, and approach volume. The
following geometric elements affect entry capacity: Approach half width, entry width, entry angle, and average effective flare length.
- Data requirements: Different sizes of vehicles have different capacity impacts; passenger cars are used as the basis for comparison.
Entry flow and circulating flow for each approach are the volumes of interest for roundabout capacity analysis, rather than turning-movement volumes.
- Capacity: Roundabouts should be designed to operate at no more than 85 percent of their estimated capacity. Circulating flow should not
exceed 1,800 vehicles per hour (veh/h) at any point in a single-lane roundabout. Exit flows exceeding 1,200 veh/h may indicate the need for a
double-lane exit.
- Performance analysis: Key performance measures for roundabouts are degree of saturation, delay, and queue length.
Geometric Design:
- General design principles: Increasing vehicle-path curvature decreases relative speeds between entering and circulating vehicles, but
also increases side friction between adjacent traffic streams in multilane roundabouts. The entry-path radius should not be significantly larger than
the circulatory radius.
- Geometric elements: The following geometric elements are discussed in detail: Inscribed-circle diameter, entry width, circulatory roadway
width, central island, entry curves, exit curves, pedestrian crossing location and treatments, splitter islands, stopping sight distance,
intersection sight distance, vertical considerations, bicycle provisions, sidewalk treatments, parking considerations and bus stop locations, and
right-turn bypass lanes.
- Rural roundabouts: Roundabout visibility is a key design element at rural locations. Curbs should be provided at all rural roundabouts.
Extended splitter islands are recommended.
Traffic Design and Landscaping:
- Signing: Yield signs are required on all approaches. One-way signs establish the direction of traffic flow. Lane-use control signs are
generally not recommended. Exit guide signs reduce the potential for disorientation.
- Pavement markings: Yield lines provide a visual separation between the approach and the circulatory roadway. Raised pavement markers
are useful supplements to pavement markings. Zebra crosswalks provide an important visual cue for drivers and pedestrians.
- Illumination: Lighting from the central island causes vehicles to be backlit and less visible. Special consideration should be given
to lighting pedestrian crossing and bicycle merging areas.
|
| Conclusions, Recommendations, Best Practices, Design Implications, or Design Guidelines See Key Results above. |
| General Comments None |
| Title Signalized Intersections: Informational Guide (FHWA-HRT-04-091) |
Funding Agency and Contact Address Federal Highway Administration
6300 Georgetown Pike
McLean, VA 22101-2296 COTR: Joe Bared |
| Authors Rodegerdts, L.A., Nevers, B., Robinson, B., Ringert, J., Koonce, P., Bansen, J., Nguyen, T., McGill, J., Stewart,
D., Suggett, J., Neuman, T., Antonucci, N., Hardy, K., and Courage, K. |
| Publication Date August 2004 |
Number of Pages 369 |
| Document Web Site None |
| Source Type Informational Guide |
| Driving Conditions Normal |
Vehicle Platforms Not Specified |
| Objective To provide a single, comprehensive document with methods for evaluating the safety and operations of signalized
intersections and tools to remedy deficiencies. |
| General Approach The treatments in this guide range from low-cost measures such as improvements to signal timing and
signage, to high-cost measures such as intersection reconstruction or grade separation. Topics covered include: Fundamental principles of user needs,
geometric design, and traffic design and operation; safety and operational analysis techniques; and a wide variety of treatments to address existing or
projected problems, including individual movements and approaches, pedestrian and bicycle treatments, and corridor techniques. |
| Methods This guide takes a holistic approach to address signalized intersections and considers the safety and
operational implications of a particular treatment on all system users. It is organized into the following parts:
- Fundamentals.
- Project Process and Analysis Methods.
- Treatments.
|
| Key Terms Signalized Intersections, Intersection Safety, Intersection Design, Intersection Performance, Intersection
Treatments |
| Key Results
Part I: Fundamentals
User Needs:
- The following items offer key information regarding the application of human factors principles in the analysis and design of a signalized
intersection:
- All road users must first recognize signalized intersections before they can respond.
- Adequate illumination for nighttime operations is required.
- Navigational information must be available sufficiently in advance.
- Signal indications must be visible from a sufficient approach distance.
- Phasing and clearance intervals for both vehicles and pedestrians must be suited for a mix of road users.
- Geometric aspects of the intersection must be clear.
- Route through the intersection itself must be explicit in order to avoid vehicles encroaching on each other.
Geometric Design:
- This chapter addresses the principles of channelization, number of intersection approaches, intersection angle, horizontal and vertical
alignment, corner radius and curb ramp design, detectable warnings, access control, sight distance, and pedestrian and bicycle facilities.
Traffic Design and Illumination:
- This chapter deals with the traffic signal hardware and software. The proper application and design of the traffic signal is a key component in
improving the safety and efficiency of the intersection. Topics discussed include: Traffic signal control types, traffic signal phasing, vehicle
and pedestrian detection, traffic signal pole layout, traffic signal controllers, basic signal timing parameters, signage and pavement markings,
and illumination.
Part II: Project Process and Analysis Methods
- The following are the steps discussed in the project process: Project initiation, identify stakeholder interests and objectives, collect data,
identify the problem, identify the cause of the problem, and select a treatment.
- The following steps are described in the safety analysis method: Selection of an intersection, identification of potential problems,
identification of possible treatments, and improvement plan development.
Part III: Treatments
Systemwide Treatments:
- Treatments in this chapter apply to roadway segments located within the influence of signalized intersections and to intersections affected by
traffic flow along a corridor. These treatments primarily address safety concerns associated with rearend collisions, turbulence related to vehicles
turning midblock from driveways or nonsignalized intersections, and coordination deficiencies associated with how traffic progresses from one
location to another. The following four specific treatments are examined: Median treatments, access management, signal coordination, and signal
preemption and/or priority.
Intersectionwide Treatments:
- Pedestrian treatments: Reduce curb radius, provide curb extensions, modify stop bar location, improve pedestrian signal displays,
and modify pedestrian signal phasing and grade-separate pedestrian movements.
- Bicycle treatments:Provide bicycle box and bicycle lanes.
- Transit treatments:Relocate transit stop.
- Traffic control treatments:Change signal control from pretimed to actuated, modify yellow change interval and/or red clearance interval,
modify cycle length, and late night/early morning flash removal.
- Street lighting and illumination:Provide or upgrade illumination.
Alternative Intersection Treatments:
- Intersection reconfiguration and realignment treatments:Remove intersection skew angle, remove deflection in travel path for through
vehicles, convert four-leg intersection to two T-intersections, convey two T-intersections to four-leg intersection, close intersection leg.
- Indirect left-turn treatments:Jughandle, median U-turn crossover, continuous-flow intersection, quadrant roadway intersection, and
super-street median crossover.
- Grade separation treatments: Split intersection and diamond interchange.
Approach Treatments:
- These treatments ensure that approaching motorists, bicyclists, or pedestrians can see that an intersection is ahead, and that a traffic signal
is controlling the traffic flow. The following treatments are discussed in detail: Signal-head placement and visibility, signage and speed control
treatments, roadway surface improvements, and sight distance treatments.
Individual Movement Treatments:
- These treatments influence how vehicles travel though signalized intersections and how they make left-, right-, and U-turns at these
intersections. The following treatments are discussed: Left turn, through lane, right turn, and variable lane use.
|
| Conclusions, Recommendations, Best Practices, Design Implications, or Design Guidelines See Key Results above. |
| General Comments None |
| Title U-Turns at Signalized Intersections (KTC-04-12/SPR258-03-3F) |
Funding Agency and Contact Address Kentucky Transportation Cabinet
200 Mero Street
Frankfort, KY 40622 COTR: Not Specified |
| Authors Stamatiadis, N., Kala, T., Clayton, A., and Agent, K. |
| Publication Date June 2004 |
Number of Pages 30 |
| Document Web Site None |
| Source Type Literature Review, Survey; Simulation |
| Driving Conditions Normal |
Vehicle Platforms Not Specified |
| Objective To examine the safety consequences from the installation of U-turns at signalized intersections in Kentucky and
to develop a set of guidelines for using this alterative in the future. |
| General Approach A literature review was completed, followed by a safety study of the current applications and a
simulation analysis for developing guidelines based on volumes and delays. A questionnaire was also administered at one of the Kentucky sites (Somerset)
to determine the opinions of business owners related to the effect of the design on their business, as well as the safety impacts. |
| Methods Kentucky Installations:
- Three signalized intersection sites where U-turns have been installed were examined (Somerset, Lexington, and Pikeville).
- Crash history for each site was examined to determine whether there were any safety consequences from the U-turn design.
Opinion Survey:
- A questionnaire was developed that was distributed to a large number of the businesses along the Somerset location.
- The questionnaire asked the respondents to identify their type of business and provide comments regarding the U-turn installation and perceived
problems or benefits as a result of the new design.
- A total of 200 questionnaires were mailed and 73 responses were received.
Operational Guidelines:
- A simulation of a basic corridor was used.
- The corridor volume and the left- and U-turning volume percentages were varied to examine their influence on the operation of the corridor
under both conditions.
|
| Key Terms U-Turns, Safety, Delays, Traffic Flow, Capacity |
| Key Results
Literature Review:
- The most efficient configuration of a U-turn is that of a stop-controlled median U-turn. This has been shown to increase intersection capacity
by 20 to 50 percent while decreasing the rate of crashes by up to 30 percent.
- Median openings placed only on the arterial also work well.
Opinion Survey:
- The survey found that there is a perception by about one-third of the businesses that there has been a negative economic impact, while
about one-quarter felt that there was a positive effect on their business.
- The most common negative comment about safety dealt with drivers disregarding the red indication.
Operational Guidelines:
- The movements under the base condition experienced higher average delays than the corresponding movements under the U-turn condition.
Statistical tests indicated that there was a statistically significant difference.
|
Conclusions, Recommendations, Best Practices, Design Implications, or Design Guidelines
- The most efficient configuration is that of stop-controlled medium U-turns.
- An analysis of the crash data shows that the U-turn design in the Kentucky locations did not result in a large number of crashes involving
U-turning vehicles.
- Also, at the Somerset location where the design eliminated median crossovers between intersections, there was a decrease in total crashes.
- Using delay time as a measure of effectiveness, it was concluded that the presence of the U-turn enhances the operation of the corridor most
likely because of the more efficient processing of vehicles at the downstream intersection.
- The study recommends that U-turns should be considered for corridors with peak volumes greater than 1,500 veh/h or for cases where the expected
total turn volume is greater than 20 percent of the total approach volume.
|
| General Comments It is recommended that further research be conducted in this area, especially if it is desired to
further refine the guidelines for future use of this design. |
| Title Intersection Negotiation Problems of Older Drivers, Volume I:
Final Technical Report |
Funding Agency and Contact Address National Highway Traffic Safety
Administration
400 Seventh Street, S.W.
Washington, DC 20590 COTR: Not Specified |
| Authors Staplin, L., Gish, K.W., Decina, L.E., Lococo, K.H., and
McKnight, A.S. |
| Publication Date September 1998 |
Number of Pages 69 |
| Document Web Site |
| Source Type On-Road Study |
| Driving Conditions Normal |
Vehicle Platforms Not Specified |
| Objective To obtain valid field measures of older drivers’ difficulties when negotiating intersections, and to
determine if their visual, mental, or physical abilities measured in an office could predict their performance behind the wheel. |
| General Approach Field observations of intersection negotiation were conducted using 82 subjects, age 61 and older
(average age was 77). The subjects first completed a functional test battery measuring vision, attentional capabilities, and head/neck flexibility. They
then underwent on-road testing administered by department of motor vehicles (DMV) examiners. |
Methods
- Each subject completed a battery of functional measures to test vision, attention, and selected perceptual skills. Specifically, the functional
abilities of the study sample measured by the test battery included static and dynamic visual acuity, static and dynamic visual contrast sensitivity,
sensitivity to the relative motion of other vehicles slowing or stopping in the road ahead, divided attention (in a brake reaction situation),
detection of pedestrian and vehicle targets in the visual periphery, skills attending to a central (foveal) task, and head/neck flexibility
(degrees of rotation to both sides).
- Following completion of the functional test battery, all subjects performed test drives over a common standard route of relatively low
familiarity. Unless terminated for safety reasons, the subject then completed a test drive over a high-familiarity route in his/her home area. On
both routes, the subjects used their own vehicles, and were accompanied by a DMV examiner.
- During the on-road tests, a miniature, multiple-camera apparatus in the driver’s own vehicle recorded visual search behaviors, brake
and accelerator use, and traffic events in the forward scene.
|
| Key Terms Driver, Safety, Mobility, Age, Intersection, Familiarity, Functional Impairment, Functional Testing, Road Test,
Licensing, Screening, Vision, Attention, Maneuver Errors. |
Key Results
- Analysis of the videotaped data revealed a high incidence of visual search errors. Drivers failed to observe behind their vehicles before
slowing down during the approach to an intersection 87 percent of the time on unfamiliar routes and 96 percent of the time on familiar routes.
They also failed to scan to the sides after entering the intersection 75 percent of the time, on both route types. One type of maneuvering error,
"infringing on others’ right of way when changing lanes," was also notable, occurring at a 90 percent rate on unfamiliar routes and
a 57 percent rate on familiar routes.
- The highest error rate for an actual maneuver, as captured by the cameras, was making a lane change with an unsafe gap. This problem was
exaggerated on the low-familiarity test route, where drivers had no expectation of where the next turn would occur.
- Analysis of errors recorded by the DMV examiners followed the same general pattern as the video-based error classification, where scanning
errors predominated across both familiar and unfamiliar test routes, and maneuver errors occurred less frequently.
- Those driving errors observed most often by the examiners included failure to stop completely at a stop sign, stopping over a stop bar,
improper turning path, and stopping for no reason.
- Regression analyses examined the relationships between functional test results and weighted examiners’ error scores. Speed of response
on visual discrimination tasks was the best predictor; however, no single measure accounted for more than 18 percent of the variance on the criterion.
|
Conclusions, Recommendations, Best Practices, Design Implications, or Design Guidelines
- Older drivers, like all drivers, seem to engage in many intersection negotiation behaviors that could be classified as driving errors,
but which have little apparent bearing on safety. Therefore, research into the types of predictor-criterion relationships at issue here should
focus specifically and exclusively on those errors that best predict crashes, consistent with the practices of licensing examiners.
- The present findings suggest that improvements in the safety of intersection negotiation by older drivers can be brought about through changes
in engineering practice, such as increased use of signals. However, since this practice is likely to be cost-prohibitive at all but the highest
crash sites, a suggested benefit of restricting certain high-risk older drivers to travel on familiar routes should be evaluated, under controlled
studies wherever permissible.
- Practical limitation in the time, expense, and/or complexity of any assessment procedures considered for large-scale implementation among the
older population suggest that the greatest contribution to improved safety may result from measures designed to identify only the most clear and
profound levels of diminished functional capability.
|
| General Comments This report is part of a two-volume report. Volume I presents the field study methodology and results.
Volume II presents the background synthesis. |
| Title Intersection Geometric Design and Operational Guidelines for Older Drivers and Pedestrians, Volume III: Guidelines
(FHWA-RD-96-137) |
Funding Agency and Contact Address Office of Safety and Traffic Operations
Research and Development
Federal Highway Administration
6300 Georgetown Pike
McLean, VA 22101-2296 COTR: Elizabeth Alicandri |
| Authors Staplin, L., Harkey, D.L., Lococo, K.H., and Tarawneh, M.S. |
| Publication Date May 1997 |
Number of Pages 64 |
| Document Web Site None |
| Source Type Literature Review, Field Test |
| Driving Conditions Normal |
Vehicle Platforms All |
| Objective To develop guidelines for changes in the geometric design and operations at intersections with the greatest
potential to aid in their use by older drivers and pedestrians. |
| General Approach A literature review identified age-related diminished capabilities that affect performance at
intersections, and examined current design standards and their adequacy for older road users. A set of problem identification studies (crash database
analysis, task analysis, focus group discussions, field observations) were conducted to better define older persons’ difficulties in intersection use,
and an expert panel met to prioritize variables for more extensive laboratory and field studies ater in the project. These studies subsequently focused on
age and the effects of opposite left-turn lane geometry, right-turn channelization and curb radius, and varying median pedestrian refuge island
configurations, using both objective (performance) and subjective measures. |
| Methods The following is the method for the parent study, upon which the recommendations in this report are based.
Laboratory Study:
- The laboratory study evaluated left-turn gap acceptance by drivers waiting in a left-turn storage bay to turn left across a stream of opposing
traffic during the permissive signal phase.
- Four levels of offset left-turn lane geometry were studied: (1) 3.6-m (12-ft) "full positive" offset, (2) 1.8-m (6-ft) "partial
positive" offset, (3) aligned (no offset), and (4) 1.8-m (6-ft) "partial negative" offset.
- Measures of effectiveness: Critical gap size, last safe moment to turn, frequency of unsafe gaps accepted, ratings of the perceived level of
hazard.
- Seventy-two subjects participated in the study (24 were ages 25 to 45, 24 were ages 65 to 74, and 24 were age 75 or older).
Field Studies:
- Four levels of offset of opposite left-turn lane geometry were examined in the field: (1) 1.8-m (6-ft) "partial positive" offset,
(2) aligned (no offset) left-turn lanes, (3) 0.91-m (3-ft) "partial negative" offset, and (4) 4.3-m (14-ft) "full negative"
offset.
- All intersections were located on major or minor arterials within a growing urban area where the speed limit was 56 km/h (35 mi/h).
- Measures of effectiveness: Critical gap size, clearance time, left-turn conflict, longitudinal and lateral positioning, percentage of drivers
positioning themselves within the intersection, site-specific intersection use survey, and general intersection safety survey.
- A total of 100 subjects were tested across the same three age groups used in the laboratory study.
|
| Key Terms Safety, Mobility, Age, Intersection, Design, Operations, Sight Distance, Channelization, Driver, Pedestrian,
Critical Gap,
Left-Turn Lane Offset |
| Key Results Recommendations for Design:
- Unrestricted sight distances and corresponding left-turn lane offsets are recommended, whenever possible,in the design of opposite left-turn
lanes at intersections.
- At intersections where there are large percentages of left-turning trucks, the offsets required to provide unrestricted sight distances for
opposing left-turning trucks should be used.
- The following countermeasures are recommended to reduce the potential for wrong-way maneuvers by drivers turning left from the stop-controlled
minor roadway:
- Proper signage must be implemented.
- Channelized left-turn lanes should contain white pavement lane-use arrows.
- Pavement markings that scribe a path through the turn.
- Use of a wide (61-cm) white stop bar at the end of the channelized left-turn lane.
- Placement of 7.2-m wrong-way arrows in the through lanes.
Recommendations for Operational and Traffic Control Countermeasures:
- Where problems with sight-restricted geometries are intractable, the following are recommended:
- Eliminate permissive left turns at intersections and implement only protected/prohibited left-turn operations where the sight distance
falls significantly below the required minimum sight distance, and/or a pattern of permissive left-turn crashes occur.
- Restrict permissive left turns to low-volume conditions (such as during nonrush hour).
- Narrow the left-turn lanes to force the lateral position of drivers as close to the right edge as possible.
- Add a lag-protected phase to clear out queued drivers.
- Consider the use of intelligent signal phasing (such as gap-sensitive signal phasing).
|
Conclusions, Recommendations, Best Practices, Design Implications, or Design Guidelines
- A critique of the data obtained in these studies during a second expert panel meeting concluded that sufficient evidence exists to support
guidelines for: (1) geometric design to ensure a minimum required sight distance for drivers turning left from a major roadway, and (2) operational
changes to accommodate older drivers where (re)design of an intersection to meet sight distance requirements is not feasible.
- A revision of case V in the AASHTO Green Book to determine sight distance requirements that reflect the perceptual task of gap judgment by a
left-turning driver more accurately than the current assumptions in case IIIB is recommended.
- Further research needs to enhance the safety and mobility of older road users at intersections are identified.
|
| General Comments This volume is the third in a series. The other volumes in the series are: Volume I: Final Report
(FHWA-RD-96-132), and Volume II: Executive Summary (FHWA-RD-96-138). |
| Title Intersection Geometric Design and Operational Guidelines for
Older Drivers and Pedestrians, Volume I: Final Report
(FHWA-RD-96-132) |
Funding Agency and Contact Address Office of Safety and Traffic Operations
Research and Development
Federal Highway Administration
6300 Georgetown Pike
McLean, VA 22101-2296 COTR: Elizabeth Alicandri |
| Authors Staplin, L., Harkey, D.L., Lococo, K.H., and Tarawneh, M.S. |
| Publication Date May 1997 |
Number of Pages 249 |
| Document Web Site None |
| Source Type Laboratory Study, Field Test |
| Driving Conditions Normal |
Vehicle Platforms All |
| Objective To develop guidelines for changes in the geometric design and operations at intersections with the greatest
potential to aid in their use by older drivers and pedestrians. |
| General Approach A literature review identified age-related diminished capabilities that affect performance at
intersections, and examined current design standards and their adequacy for older road users. A set of problem identification studies (crash database
analysis, task analysis, focus group discussions, field observations) were conducted to better define older persons’ difficulties in intersection use,
and an expert panel met to prioritize variables for more extensive laboratory and field studies later in the project. |
| Methods Focus Group:
- Eighty-one older road users, assembled in 11 discussion groups, were recruited as paid study participants. Focus group discussions were
conducted with 6 to 8 individuals at a time.
- The activity included the completion of an intake questionnaire addressing intersection use patterns, as well as more general information
regarding driving history and exposure.
Laboratory Study:
- The laboratory study evaluated left-turn gap acceptance by drivers waiting in a left-turn storage bay to turn left across a stream of opposing
traffic during the permissive signal phase.
- Four levels of offset left-turn lane geometry were studied: (1) 3.6-m (12-ft) "full positive" offset, (2) 1.8-m (6-ft) "partial
positive" offset, (3) aligned (no offset), and (4) 1.8-m (6-ft) "partial negative" offset.
- Measures of effectiveness: Critical gap size, last safe moment to turn, frequency of unsafe gaps accepted, ratings of the perceived level of
hazard.
- Seventy-two subjects participated in the study (24 were ages 25 to 45, 24 were ages 65 to 74, and 24 were age 75 or older).
Field Studies:
- Four levels of offset of opposite left-turn lane geometry were examined in the field: (1) 1.8-m (6-ft) "partial positive" offset,
(2) aligned (no offset) left-turn lanes, (3) 0.91-m (3-ft) "partial negative" offset, and (4) 4.3-m (14-ft) "full negative"
offset.
- All intersections were located on major or minor arterials within a growing urban area where the speed limit was 56 km/h (35 mi/h).
- Measures of effectiveness: Critical gap size, clearance time, left-turn conflict, longitudinal and lateral positioning,percentage of drivers
positioning themselves within the intersection, site-specific intersection use survey, and general intersection safety survey.
- A total of 100 subjects were tested across the same three age groups used in the laboratory study.
|
| Key Terms Safety, Mobility, Age, Intersection, Design, Operations, Sight Distance, Channelization, Driver, Pedestrian,
Critical Gap, Left-Turn Lane Offset |
| Key Results Focus Group Results:
- Almost everyone responded positively regarding the jughandle design. Overall, 76 percent of the group agreed that entirely eliminating left
turns across busy roadways through the use of this design was a safe and convenient practice. However, 22 percent of this group qualified this
statement with the fact
that it was only a good idea if plenty of advance warning was given.
- Of the participants, 28 percent voiced a negative opinion about traffic circles.
Laboratory Study:
- Smaller critical gap sizes were found for the full positive geometry than for the partial positive, aligned, or partial negative geometries.
- Virtually equal "least safe gap" sizes were found across geometry, except for a sharp decrease in mean least safe gap size for the
partial negative offset condition.
- Larger gaps were required in the presence of an oncoming truck compared to the gap size for an oncoming passenger car.
- The mean least safe gap size increased with increasing driver age.
- Significant three-way interactions were found between geometry, age, and oncoming vehicle type on mean least safety gap judgments, with the
largest gap requirements for the age 75+ group with aligned geometry and trucks as the oncoming vehicle.
- Disproportionately higher percentages of unsafe gaps were accepted by the age 75+ group under the partial negative geometry, for both opposite
left-turning vehicle types.
Field Study:
- Significant main effects of age and geometry on critical gap size were found, with longer critical gaps demonstrated for the age 75+ drivers and
the -4.3-m opposite left-turn lane offset.
- A significant effect of geometry on lateral positioning and on longitudinal positioning was found, where the more negative the offset, the
farther to the left and the closer drivers must move longitudinally to the center of the intersection to improve their visibility of through traffic.
- A significant effect of age and gender on vehicle positioning was found, where older drivers and female drivers were less likely to position
themselves within the intersection to improve sight distance.
- Subjective responses to survey questions indicated that two-thirds of drivers feel that a green arrow is safer than a green ball, 8 out of 10
drivers feel that making a left turn on a green ball is safe at some locations and unsafe at others (underscoring the importance of geometric
elements), and 9 out of 10 drivers feel that making a left turn on a green ball is the most stressful of all intersection maneuvers.
|
| Conclusions, Recommendations, Best Practices, Design Implications, or Design Guidelines Future Research Priorities:
- Develop ecologically valid models of pedestrian crossing behavior at intersections.
- Identify and determine the relative importance of factors influencing driver gap decisions at intersections.
- Driver demand as a figure of merit for proposed highway engineering countermeasures.
- Implement and evaluate technologies for active traffic control at intersections.
- Implement and evaluate technologies for active pedestrian control at intersection.
|
| General Comments None |
| Title Examination of Signalized Intersection, Straight Crossing-Path Crashes, and Potential IVHS Countermeasures
(DOT-HS-808-143) |
Funding Agency and Contact Address National Highway Traffic Safety
Administration
400 Seventh Street, S.W.
Washington, DC 20590 COTR: Not Specified |
| Authors Tijerina, L., Chovan, J.D., Pierowicz, J., and Hendricks, D.L. |
| Publication Date August 1994 |
Number of Pages 60 |
| Document Web Site http://www.its.dot.gov/itsweb/EDL_webpages/webpages/SearchPages/Alpha_Search.cfm |
| Source Type Crash/Demographic Statistical Analysis |
| Driving Conditions Normal, Degraded, Imminent Crash (ICA) |
Vehicle Platforms Light Vehicles |
| Objective To provide a preliminary analysis of signalized intersection, straight crossing-path (SI/SCP) crashes and
applicable countermeasure concepts for the Intelligent Vehicle-Highway System (IVHS) program. The intent of the report is to identify crash avoidance
opportunities and to illustrate design challenges for SI/SCP crash countermeasures. |
General Approach
- This report presents the results of a study of the SI/SCP type of collision as identified by the NHTSA Office of Crash Avoidance Research (OCAR).
- An in-depth analysis of SI/SCP crashes was conducted to identify crash circumstances and causal factors. The sample consisted of 37 reports from
the 1992 Crashworthiness Data System (CDS) and 13 police accident reports (PARs) from the General Estimates System (GES) 1991 statistics.
|
Methods
- The SI/SCP crash was defined as a crash at a signalized intersection in which a subject vehicle (SV) with the right of way and a principal other
vehicle (POV) collide in straight crossing paths.
- An analytic model of intersection negotiation behavior at signalized intersections was presented to indicate possible sources of driver actions
that might contribute to such crashes.
- Crash avoidance system (CAS) concepts were developed to address each of the major causal factors identified in the data analysis.
- The report concluded with a discussion of research needs to support further refinement of the SI/SCP scenario and other crash avoidance concepts.
|
| Key Terms Vehicle Crash Analysis, Crash Countermeasures, IVHS, Kinematic Models, Crash Circumstances |
| Key Results Crash Characteristics and Causal Factors:
- SI/SCP crashes occur mostly under conditions of dry pavement (79 percent), good weather (66 percent), and daylight (72 percent), and involve
predominantly people less than 54 years of age traveling over a wide range of velocities.
- SI/SCP crashes were mostly attributed to the following three factors: (1) driver unawareness because of inattention and obstructed vision,
(2) failure to obey the red-light signal, and (3) driver attempted to beat the amber light signal (see figure).
CAS Countermeasure Concepts:
Three IVHS countermeasure concepts, specific to the SI/SCP crash scenario, were devised as follows to address the causal factors:
- In-vehicle alert: Indicates a signalized intersection ahead. Addresses factor 1 above.
- Driver warning: Graded warnings and constant warning times required to avoid the SI/SCP crash. Addresses factors 1 and 2 above.
- Control intervention: Automatically activated braking automation (soft braking, moderate braking, or graded braking, with or without driver
override). Addresses factors 1, 2, and 3 above.
|
Figure A. Distribution of causal factors associated with SI/SCP crashes.
|
| Conclusions, Recommendations, Best Practices, Design Implications, or Design Guidelines
Research Needs:
- Clinical Analysis Area: Increase sample size in analysis, SI/SCP crashes resulting from loss of traction.
- Driver Behavior at Signalized Intersections: Higher order responses, correlation between driver reaction time and braking rate, correlation
between brake reaction time and peak braking deceleration, driver decision processes, effects of fully automated control system (FACS) on the driver,
interaction between drivers, alternative alert displays, driver interaction with warning systems.
- SI/SCP Algorithm Research Needs: Additional crash countermeasure concepts, impact of errors on system effectiveness, CAS set points, impact
of velocity profiles on algorithm robustness.
Further Modeling Research Needs: Multiple vehicle interactions.
|
| General Comments None |
| Title Crash Models for Rural Intersections: Four-Lane by Two-Lane Stop-Controlled and Two-Lane by Two-Lane Signalized
(FHWA-RD-99-128) |
Funding Agency and Contact Address Office of Safety Research
and Development
Federal Highway Administration
6300 Georgetown Pike
McLean, VA 22101-2296 COTR: Joe Bared |
| Authors Vogt, A. |
| Publication Date October 1999 |
Number of Pages 182 |
| Document Web Site http://www.tfhrc.gov/safety/ihsdm/libweb.htm |
| Source Type Crash/Demographics Statistical Analysis, Field Study |
| Driving Conditions Normal |
Vehicle Platforms All |
| Objective To assess the combined and relative effects of highway variables on intersection crashes for the following
classes of intersection:
- Rural three-leg and four-leg intersections on four-lane highways, stop controlled on the minor legs.
- Signalized rural intersections of two-lane roads.
|
| General Approach Data were acquired from the Highway Safety Information System (HSIS), State and Federal photologs, and
field work at all intersections. The final data sets consisted of 84 three-leg intersections, 72 four-leg intersections, and 49 signalized intersections.
|
Methods
- Three classes of intersections were considered: (1) three-leg intersections with major-road four-lane and minor-leg two-lane stop controlled;
(2) four-leg intersections with major-road four-lane and minor-leg two-lane stop controlled; and (3) signalized intersections with both two-lane
major and minor roads.
- The field work included morning and evening traffic counts by movement and vehicle type, as well as alignment measurements out to 244 m
(800 ft) along the major road.
- The chief classes of variables in this study are: Crash variables, traffic variables, intersection geometric variables, roadside variables,
alignment variables, and sight distances. The intersection geometric variables concern medians, channelization, and intersection angle. Alignment
variables and sight distance variables, which pertain to the roadway as far out as 244 m (800 ft) to several thousand feet from the intersection
center, are treated separately.
- Negative binomial models were developed for each of the three data sets.
- Models were developed for all crashes within 76 m (250 ft) of the intersection center, for intersection-related crashes within 76 m (250 ft),
and for injury crashes. Models of crashes at signalized intersections by approach flows were also investigated.
|
| Key Terms Highway Safety, Crash Prediction Models, Negative Binomial Regression, Intersection Design |
Key Results
- Significant variables included major- and minor-road traffic; peak major- and minor-road left-turning percentage; number of driveways;
channelization; median widths; vertical alignment; and, in the case of the signalized intersections, the presence or absence of protected left-turn
phases and peak truck percentage.
- For injury crashes, intersection angle and minor-road posted speed are significant.
- For the three-leg intersections, ADT explains 17 to 18 percent of the variation, while MEDWIDTH1 and NODRWYI explain another 4 to 5 percent.
For the four-leg intersections, ADT explains 8 to 10 percent of the variation, while major-road left-turn percentage and/or the presence of a
major-road left turn explains another 5 percent.
- In sharp contrast, for the signalized intersections, ADT by itself explains a negligible percentage of crashes.Turning and truck percentages
explain 1 to 3 percent and the design variables PROT_LT and VEICOM explain 6 to 13 percent, depending on the model.
Table A. Accident Reduction Factors for the main models.
| Three-Leg Intersections |
| |
TOTACC Main Model
(Table 28) |
TOTACCI Main Model
(Table 29) |
| MEDWIDTH1 |
5.3% |
6.6% |
| NODRWY1 |
-4.0% |
-5.7% |
| Four-Leg Intersections |
| |
TOTACC Main Model
(Table 32) |
TOTACCI Main Model
(Table 33) |
| PK percentLEFT1 |
-11.6% |
-16.1% |
| LTLN1S |
38.4% |
- |
| Signalized Intersections |
| |
TOTACC Main Model
(Table 35) |
TOTACCI Main Model
(Table 36) |
| PK percentLEFT2 |
1.4% |
1.6% |
PK
percentTRUCK |
-3.2% |
-2.9% |
| PROT_LT |
49.1% |
37.5% |
| VEICOM |
-13.9% |
-11.9% |
Note: Negative Accident Reduction Factors signify an increase in crashes.
Table B. Variable descriptions for table A above.
| Variable |
Description |
Variable |
Description |
| LTLN1S |
Number of left-turn lanes on major road |
PK
percentTRUCK |
Percentage of truck traffic through intersection,
combined a.m./p.m. |
| MEDWIDTH1 |
Median width on major road |
PROT_LT |
Protected left turn: Multiphasing |
| NODRWY1 |
Number of residential driveways within
±76 m (250 ft) |
VEICOM |
Average change of grade per curve length, vertical
curves overlapping intersection center ±244 m
(800 ft), all intersections |
PK
percentLEFT1 |
Percentage of left turns, legs (1, 3) or
(2, 4) |
TOTACC |
Number of crashes occurring within ±76 m (250 ft)
of intersection |
PK
percentLEFT2 |
Percentage of left turns, legs (4, 1) or
(3, 2) |
TOTACCI |
Intersection-related crashes |
|
Conclusions, Recommendations, Best Practices, Design Implications, or Design Guidelines
- The data in this study have shortcomings. These include relatively small sample sizes, peak turning percentages and truck percentages measured
by samples not contemporary with the crash data, and the difficulty of measuring and defining crash and intersection variables.
- In addition to the six main models, alternate models deserve consideration. These include variants given in the tables using other variables,
the flow models in chapter 5, models that restrict the range of certain inputs (piecewise linear) or allow quadratic dependencies, and model forms
suggested by Hauer.
- Major-road ADT plays a lesser role as one passes from three-leg to four-leg to signalized intersections, with turning percentage measures
becoming more important and unexplained crash frequency variation increasing.
- The six main models adequately summarize the data in this study, with the choice of a crash variable TOTACC(all crashes within 76 m (250 ft))
or TOTACCI (all intersection-related crashes within 76 m (250 ft)) to be determined by other criteria.
|
| General Comments None |
| Title Accident Models for Two-Lane Rural Roads: Segments and Intersections (FHWA-RD-98-133) |
Funding Agency and Contact Address Office of Safety and Traffic
Operations Research and
Development
Federal Highway Administration
6300 Georgetown Pike
McLean, VA 22101-2296 COTR: Joe Bared |
| Authors Vogt, A., and Bared, J.G. |
| Publication Date October 1998 |
Number of Pages 179 |
| Document Web Site http://www.tfhrc.gov/safety/ihsdm/libweb.htm |
| Source Type Crash/Demographic Statistical Analysis |
| Driving Conditions Normal |
Vehicle Platforms All |
| Objective This report describes the collection, analysis, and modeling of crash and roadway data pertaining to segments
and intersections on rural roads. |
General Approach
- Data were acquired from the Highway Safety Information System (HSIS), photologs, construction plans, and State databases for Minnesota
(1985-1989) and Washington State (1993-1995).
- More than 1,300 segments and more than 700 intersections are included in the final samples on which the modeling is based.
- Models of Poisson type, negative binomial type, and extended negative binomial type (the latter by Shaw-Pin Miaou) were developed, and advanced
statistical techniques were applied to assess the explanatory value of the models in the presence of Poisson randomness and overdispersion.
|
| Methods Data collected include:
|
|
- Horizontal and vertical alignments.
|
|
|
- Commercial traffic percentage.
|
- Lane and shoulder widths.
|
|
|
|
- Intersection angles and channelization.
|
|
|
|
These data are often estimates based on averages and are subject to some uncertainties in location and time. ADTs are based on observations at selected
sites, interpolation, and/or extrapolation, and are particularly crude estimates in the case of intersections. In view of the importance of ADT in the
modeling, the crudeness of these estimates should serve as a caution. |
| Key Terms Highway Safety, Accident Prediction Models, Negative Binomial Regression, Extended Negative Binomial
Models, Highway Geometric Design |
Key Results
- The models derived from these data indicate that exposure and traffic counts are the chief highway variables contributing to crashes, but that
surface and shoulder width, roadside conditions, and alignments are also significant, especially in the segment models
- In general, the Poisson, negative binomial, and extended negative binomial models give mutually consistent values for regression coefficients.
The T1 statistic indicates that overdispersion is present and that negative binomial models are preferred.
- Most of the variables in the study are significant. The chief variables–exposure, lane and shoulder width, Roadside Hazard Rating and
driveway density, and the alignment variables–are all represented.
- Differences appear between the Minnesota and Washington State models (for example, the insignificance of the Roadside Hazard Rating in the
Minnesota segments, the anomalous sign of lane width in the Washington State segments, differences in the commercial traffic percentage variable
T between the two States, and the insignificance of most of the variables on the Washington State three-leg intersections).
- These models yield the Accident Reduction Factors shown in the table below. Recall that the Accident Reduction Factor is the percentage decrease
in mean predicted crash count when a variable is increased by one unit, all other variables being held fixed. A negative value signifies that
crashes increase by that percentage when the variable is increased by one unit.
Table A. Accident Reduction Factors for the final models.
Segment Model
(Table 27) |
Three-Leg Intersection
Model (Table 35) |
Four-Leg Intersection
Model (Table 35) |
| LW |
+8.1% |
|
|
|
|
| SHW |
+5.7% |
|
|
|
|
| RHR |
-6.9% |
RHRI |
-18.8% |
|
|
| DD |
-0.84% |
|
|
ND |
-13.1% |
| DEG |
-4.6% |
HI |
-3.4% |
HI |
-4.6% |
| V |
-59.2% |
VCI |
-33.7% |
VCI |
-33.4% |
| GR |
-11.0% |
|
|
|
|
| |
|
HAU |
-0.5% |
HAU |
+0.5% |
Table B. Variable descriptions for table A above.
| Variable |
Description |
Variable |
Description |
Variable |
Description |
| DEG |
Degree of curve |
HI |
Horizontal curves
overlapping intersection
center |
RHRI |
Roadside Hazard Rating
within ±76 m (250 ft) on
major road |
| DD |
Number of dry days |
LW |
Lane width |
SHW |
Shoulder width |
| GR |
Grade |
ND |
Number of driveways within
±76 m (250 ft) on major road |
V |
Vertical curve |
| HAU |
Intersection angle |
RHR |
Roadside Hazard Rating |
VCI |
Vertical crest curves
overlapping intersection
center |
|
Conclusions, Recommendations, Best Practices, Design Implications, or Design Guidelines
- Validation based on a chi-square statistic (
 ), mean absolute deviation (MAD), and mean absolute
scaled deviation (MASD) suggests that the models have some predictive power. ), mean absolute deviation (MAD), and mean absolute
scaled deviation (MASD) suggests that the models have some predictive power.
- Despite the incompleteness of the data and uncertainties in the values of some variables, the quantity, quality, and variety of the data give
the models both descriptive and predictive value.
- Of great importance for the practical utility of models, such as the ones presented here, is the issue of how to adapt them to different States
and regions and/or different time periods. A multiplier is needed that can be applied to a standard model to adjust it to a different State or
region (for example, New England vs. the Great Plains) and/or a different period (1999 vs. 2001-2005) for circumstances in which drivers, vehicles,
law enforcement, and demographics may differ from those under which the standard model was developed.
|
| General Comments None |
| Title Intersection Crossing-Path Crashes: Problem Size Assessment and Statistical Description (DOT-HS-808-190) |
Funding Agency and Contact Address National Highway Traffic Safety
Administration
Office of Collision Avoidance Research
400 Seventh Street, S.W.
Washington, DC 20590 COTR: Not Specified |
| Authors Wang, J.S., and Knipling, R.R. |
| Publication Date August 1994 |
Number of Pages 134 |
| Document Web Site http://www.its.dot.gov/itsweb/EDL_webpages/webpages/SearchPages/Alpha_Search.cfm |
| Source Type Crash/Demographic Statistical Analysis |
| Driving Conditions Imminent Crash (ICA) |
Vehicle Platforms All |
| Objective To present a problem size assessment and statistical crash description for intersection crossing-path (ICP)
crashes. |
| General Approach Data from the 1991 General Estimates System (GES) were analyzed for five vehicle type categories:
- All vehicles.
- Passenger vehicles.
- Combination-unit trucks.
- Medium/heavy single-unit trucks.
- Motorcycles.
|
Methods
- ICP crashes were classified into three subtypes: (1) signalized intersection perpendicular crossing path (SI/PCP), (2) unsignalized intersection
perpendicular crossing path (UI/PCP), and (3) left turn across path (LTAP) subtypes.
- The ICP crash problem size was assessed using such measures as number of crashes, number and severity of injuries, crash involvement rate, and
crash involvement likelihood.
- Descriptive statistics were provided for all vehicles only. ICP crashes and the three crash subtypes were described statistically primarily
in terms of the conditions under which they occur (e.g., time of day, weather, roadway type, relation to junction) and in terms of possible
contributing factors.
|
| Key Terms Traffic Accidents, Intersection Crossing-Path Crashes, Perpendicular Crossing-Path Crashes, Left Turn Across
Path Crashes, Crash Avoidance Countermeasures, Combination-Unit Trucks, IVHS, Single-Unit Trucks,
Motorcycles, Traffic Crash Statistic |
Key Results
- In 1991, there were 1,803,000 ICP crashes, constituting 29.5 percent of all police-reported crashes (see figure below). The estimated number
of non-police-reported ICP crashes was approximately 2,224,000.
- In these crashes, there were approximately 1,082,000 injuries, including 144,000 fatal or incapacitating injuries. ICP crashes caused
approximately 26.7 percent of all crash-caused delay.
- In 1991, ICP crashes constituted 30.2 percent of passenger vehicle crashes, 17.4 percent of combination-unit crashes, 25.3 percent of
single-unit truck crashes, and 31.0 percent of motorcycle crashes.
- Passenger vehicles were involved in 96.7 percent of all ICP vehicle crashes.
- Based on vehicle-miles of travel, motorcycles had the highest ICP involvement rate (351.2 per 100 million vehicle-miles traveled (VMT),
compared to 173.8 for passenger vehicles, 61.5 for single-unit trucks, and 34.8 for combination-unit trucks).
- The following numbers of vehicles were involved in ICP crashes: 21.0 per 1,000 combination-unit trucks, 19.2 per 1,000 passenger vehicles, 7.8
per 1,000 single-unit trucks, and 7.7 per 1,000 motorcycles.
- The table below summarizes the sizes and proportions of the three ICP crash subtypes relative to the total number of all crashes.
- During weekends, more ICP crashes occur during nighttime hours; however, during weekdays, more crashes occur during morning and evening rush
hours. Overall, about 26.0 percent of ICP crashes occurred during afternoon traffic hours compared with 13.2 percent occurring during morning
traffic hours.
- For all known values for which the roadway type is known, about 72.0 percent of ICP crashes occurred on nondivided highways, 24.5 percent on
divided highways, and 3.5 percent on one-way trafficways (unknown rate: 29.1 percent).
- 48.7 percent of ICP crashes occurred on one- or two-lane roadways, 36.8 percent on three- or four-lane roadways, and 14.5 percent on
roadways with five or more lanes (unknown rate 25.9 percent).
- Overall, 96.8 percent of ICP crashes occurred on straight roadways, 78.5 percent occurred on level roadways, and 76 percent occurred on roadways
that were both straight and level. Furthermore, 76.8 percent of ICP crashes occurred on dry roadways, 19.6 percent occurred on wet roadways, and 3.6
percent occurred on extreme surface conditions.
- ICP crash involvement rates per 100 million VMT were highest for younger driver, next highest for older drivers, and lowest for middle-aged
drivers. Overall, females had the highest involvement rate.
- The most common violations charged were failure to yield, running a traffic light, and impairment by alcohol/drugs.
|
Figure A. Intersection crossing-path crashes.
|
Table A. Various ICP crash subtypes as a portion of all crashes.
| Subtype |
Number of
Crashes |
Percentage of
All Crashes |
| SI/PCP |
260,000 |
4.2 |
| UI/PCP |
621,000 |
10.2 |
| LTAP |
413,000 |
6.8 |
Other ICP
Types |
509,000 |
8.3 |
Total ICP
Crashes |
1,803,000 |
29.5 |
|
| Conclusions, Recommendations, Best Practices, Design Implications, or Design Guidelines See Key Results above. |
| General Comments None |
3.3 SPEED MANAGEMENT
This subsection contains reviews for the Speed Management topic.
| Title
Restoring Credibility to Speed Setting: Engineering, Enforcement, and Educational Issues (Speed Management Workshops) |
Funding Agency and Contact Address Federal Highway Administration
6300 Georgetown Pike
McLean, VA 22101-2296 COTR: Not Specified |
| Authors Anonymous |
| Publication Date 2000 |
Number of Pages 7 |
| Document Web Site http://safety.fhwa.dot.gov/speed_manage/docs/workshopreport.pdf |
| Source Type Workshop |
| Driving Conditions Normal |
Vehicle Platforms Not Specified |
| Objective As part of an approach to address the problem of speeding, the U.S. DOT Speed Management Team joined with the
Intelligent Transportation Society of America to sponsor two speed management workshops. The objective of the workshops was to identify actions needed
to restore the credibility of speed limits across the Nation. |
| General Approach The first workshop was held in January 2000, in conjunction with the Transportation Research Board
(TRB) annual meeting in Washington, DC. The second workshop was held in March 2000, in Dallas, TX. |
| Methods Workshop participants addressed the following issues:
- Methodologies used for setting realistic speed limits.
- Public perception and acceptance of speed limits and enforcement efforts.
- Existing and new speed-setting and enforcement technologies.
- Engineering and operations concerns.
- Judicial considerations.
- Lessons learned through domestic and foreign experiences in speed management.
|
| Key Terms Speed Management, Engineering, Enforcement, Education, Speed Setting |
| Key Results Engineering Issues:
- Participants at the workshops concurred on the need to improve cooperation between engineering and law enforcement personnel to set realistic,
enforceable speed limits that are appropriate to roadway design.
- Participants felt that it was important to review, evaluate, and
update speed limits periodically to accommodate changing demographics and increasing urbanization of previously rural areas.
- The following is a list of other issues addressed in the breakout sessions: Designing roadways with adequate infrastructure to accommodate law
enforcement operations, monitoring speeds on roadways more effectively, incorporating new technologies to alert drivers to safety problems,
developing standards for implementing variable speed limits, and increasing public education about the meaning and use of enforcement in
construction work zones.
Enforcement Issues:
- Workshop participants at both sessions raised the issue of credibility in enforcing reasonable speed limits.
- They noted the crucial need for automated enforcement technology.
- Both sessions identified the importance of consistent and uniform enforcement of speed limits nationwide.
- The following is a list of other issues addressed in the breakout sessions: Reinforcing the quality, consistency, and accountability of speed limit enforcement; appropriating sufficient resources (personnel and technology) for speed limit enforcement; establishing reciprocity between jurisdictions; basing enforcement on what contributes to crashes; identifying safety as a paramount rationale for enforcement; establishing incentives for obeying speed limits; and using technology to keep drivers better informed about road conditions and incidents.
Judicial Issues:
- Improving cooperation between agencies and disciplines was raised as a critical issue.
- Participants also discussed the need for uniform consequences for reasonable enforcement of realistic speed limits, and increasing involvement
and education among the agencies involved in establishing, enforcing, and adjudicating problems of speeding.
- The following is a list of other issues addressed in breakout sessions: Improving communication and training, reducing public tolerance for
speeding, informing courts about where and why speed limits are updated, encouraging consistent and fair punishment for speeding violations,
and seeking input from judicial officials on what they expect with regard to speed limits.
Political and Public Policy Issues:
- Education and cooperation were paramount concerns to workshop participants.
- They felt that there is a need for ongoing communication to educate politicians and policymakers about the rational setting, enforcing, and
adjudicating of realistic speed limits.
- The following is a list of other issues addressed: Involving political officials in the process of setting speed limits; educating legislators
on the benefits and uses of enforcement technologies; encouraging equal and consistent application of speed limits, enforcement, and adjudication
across States; establishing and using reciprocity agreements among jurisdictions; changing speed laws from basic to absolute; educating the
public, politicians, and policymakers about how aggressive enforcement improves traffic safety and quality of life.
|
Conclusions, Recommendations, Best Practices, Design Implications, or Design Guidelines
- The results of the speed management workshops emphasize the need for enhanced communication and cooperation among the engineering, enforcement,
judicial, and political partners who directly affect safety on the Nation’s roads.
|
| General Comments None |
| Title
Traffic Calming, Auto-Restricted Zones, and Other Traffic Management Techniques: Their Effects on Bicycling and Pedestrians (FHWA-PD-93-028) |
Funding Agency and Contact Address Federal Highway Administration
400 Seventh Street, S.W.
Washington, DC 20590 COTR: Not Specified |
| Authors Clark, A., and Dornfeld, M.J. |
| Publication Date| 1994 |
Number of Pages 75 |
| Document Web Site http://www.bikewalk.org/technical_assistance/case_studies.htm |
| Source Type Case Study |
| Driving Conditions Normal |
Vehicle Platforms Not Specified |
| Objective To examine the development of traffic calming in Europe and the United States, with a particular emphasis on
the impact of such traffic management on bicyclists and pedestrians. |
| General Approach This report examines the development of traffic calming in Europe and the United States, with
particular emphasis on the impact of such traffic management on bicyclists and pedestrians. |
| Methods The body of the report can be divided into three parts:
- The first two major sections examine the history and traffic-calming techniques, respectively, installed in Europe, Japan, and the United States.
- The final section of the report examines the practical and policy implications of traffic calming.
|
| Key Terms Traffic Calming, Auto-Restricted Zones, Speed Management, Traffic Management |
| Key Results Traffic Calming in the United States:
- Traffic calming attempts in the United States tend to focus on spot locations and most have resulted in lower motor vehicle speed and fewer motor
vehicle crashes.
- The following are a sample of traffic-calming techniques used in the United States: Speed hump installations, traffic circles (miniroundabouts),
chicanes, bicycle boulevard, channelization changes, slow streets, transit street and pedestrian zones, signage techniques, traffic diverters, and
corner radii treatments.
- In general, acceptance of traffic calming is high. Local residents felt that the benefits of traffic calming outweighed any minor inconveniences.
- There is little information on the effects of traffic calming on bicycle and pedestrian use. However, evaluations of the Palo Alto, CA, bicycle
boulevard and Seattle, WA, channelization changes showed increases in the amount of bicycle traffic.
Benefits to Bicyclists and Pedestrians:
- The experience from Europe shows that bicycle use has been encouraged by traffic calming and that walking has been made much more attractive
and levels of activity have increased in residential and shopping streets that have been calmed.
- Safety for children playing in their neighborhoods is improved by reducing the speeds of motor vehicles and can be accomplished by traffic
calming.
Costs and Benefits of Traffic Calming:
- In the United States, the costs of failing to address excessive traffic and motor vehicle dependency are escalating. Traffic crashes alone cost
the Nation up to $137 billion a year in direct costs, lost time, and productivity. Congestion is also costly.
- Lower and more consistent speeds improve the capacity of roadways, and the dedicated spaces typically provided for walking, bicycling, and
transit can achieve shifts in modal choice toward these more efficient modes.
|
Conclusions, Recommendations, Best Practices, Design Implications, or Design Guidelines
- Well-designed and implemented traffic-calming techniques can have a number of beneficial impacts for bicyclists and pedestrians. The reduced
vehicle speeds associated with such projects can reduce both the severity and incidences of motor vehicle/bicycle/pedestrian crashes and can make
bicyclists and pedestrians feel more comfortable in traffic.
- Traffic calming may be a more cost-effective and practical means of encouraging bicycling and walking than the development of separate networks
of trails and multiuse paths.
- Traffic calming has been used to create more livable neighborhoods; vibrant automobile-free shopping streets; and pleasant, convenient bicycle
routes.
- Traffic planners and engineers in the United States are realizing that traffic calming must be approached on an areawide basis.
|
| General Comments There is a need for more research in the United States on the effects that traffic calming has on
bicycle and pedestrian use. |
| Title FHWA International Technology Scanning Program: Summary Report of the FHWA Study Tour for Speed Management and
Enforcement Technology (FHWA-PL-96-006) |
Funding Agency and Contact Address Federal Highway Administration
6300 Georgetown Pike
McLean, VA 22101-2296 COTR: Not Specified |
| Authors Coleman, J.A., Cotton, R.D., Parker, M.R., Covey, R., Pena, H.E., Jr., Graham, D., Robinson, M.L., McCauley, J.,
Taylor, W.C., and Morford, G. |
| Publication Date December 1995 |
Number of Pages 69 |
| Document Web Site http://ntl.bts.gov/DOCS/speed06.html |
| Source Type Informational Report |
| Driving Conditions Normal |
Vehicle Platforms All |
| Objective To document the findings of a study team from the United States that conducted a scanning tour in the
Netherlands, Germany, Sweden, and Australia. The purpose of the tour was to obtain firsthand knowledge about the practices and policies concerning speed
management and enforcement technology. |
| General Approach A brief overview of the speed management and enforcement policies, as well as individual speed-related
projects that were reviewed are presented for each country visited. General conclusions are given based on the findings from all countries visited. |
Methods
- The Transportation Technology Evaluation Center (TTEC) of Loyola College in Maryland planned and coordinated the study tour.
- The study team, consisting of 11 members, represented a cross section of Federal, State, and local highway agencies, enforcement officials, and
researchers involved in speed management.
- Prior to conducting the scanning tour, the team prepared a comprehensive list of questions concerning speed management and enforcement
technologies.
- During the period from April 21 through May 5, 1995, the scanning team visited the Netherlands, Germany, Sweden, and Australia.
- In each country, the team met with Federal, regional, and local transportation officials; law enforcement officers; researchers; communications
experts; educators; consultants; and contractors.
- The team also made field trips to locations where speed management techniques and/or automated enforcement technologies were implemented.
|
| Key Terms Speed Limits, Speed Control, Law Enforcement, Study Tours, Traffic Calming, Radar, Laser Radar, Red-Light
Running, Cameras, VASCAR, Photo Radar, Speed Management |
| Key Results For a speed management program to be successful, the following components are essential:
- The speed-related safety problem must be clearly identified and effectively communicated to everyone involved, especially the public.
- The strategy methods selected for implementation must have the potential for solving the problem.
- Engineering, enforcement, and educational speed management techniques must be integrated and coordinated.
- The plan must be fair and reasonable to the majority of road users.
- Implementation must be augmented with a continuous ongoing evaluation program to monitor and determine the effectiveness of the management
techniques.
- The plan must be flexible and change when safety conditions merit.
- The road safety community must work with legislators to ensure that the necessary legislation is enacted and revised, as needed, to accomplish
the speed management goals.
- Through each phase of the program, all participants must be kept informed and involved.
Major components of the plan should include:
- Long-term framework: Public education through extensive advertising to address beliefs and attitudes and to provide a rational basis
to encourage that change is essential.
- Medium-term reviews: Examination and rationalization of the process, procedures, and practices.
- Short-term initiatives: Special targeted enforcement activity, with appropriate warnings, is necessary to reinforce particular safety
issues.
The following are specific speed management methods:
- Realistic speed limits: The relationship between speed limits and the roadway environment must be credible and consistent.
- Variable speed limits: Because of the cost, variable speed limit systems should be implemented in areas where environmental and/or
traffic conditions result in significant fluctuations in the desired speed.
- Speed governors on heavy vehicles: It is likely that there would be little political resistance if top speeds for heavy vehicles
were limited to 113 km/h (70 mi/h).
- Traffic-calming techniques: Speed humps, roundabouts, lane narrowing, and other traffic-calming methods were employed to reduce
vehicle speeds in residential areas in the countries visited.
- Speed limits based on driver perception: Additional research is suggested before implementation of these techniques.
- Public education/information: Examples include using music and sports figures to relay safety concepts to teenagers and introducing
traffic safety curriculums into secondary schools.
- Enforcement technology: Specific enforcement technology and deployment methodologies that may be applicable in the United States are
listed below:
- VASCAR (Visual Average Speed Computer and Recorder).
- Radar (RAdio Distance and Ranging).
- Lidar (LIght Distance and Ranging).
- Photo radar.
- Red-light cameras.
|
| Conclusions, Recommendations, Best Practices, Design Implications, or Design Guidelines See Key Results above. |
| General Comments None |
| Title Traffic Calming: State of the Practice (FHWA-RD-99-135) |
Funding Agency and Contact Address
Office of Safety Research
and Development
Federal Highway Administration
6300 Georgetown Pike
McLean, VA 22101-2296 COTR: Not Specified |
| Authors Ewing, R. |
| Publication Date 1999 |
Number of Pages 245 |
| Document Web Site http://www.ite.org/traffic/tcstate.htm |
| Source Type Literature Review, Survey |
| Driving Conditions Normal |
Vehicle Platforms Not Specified |
| Objective To provide a synthesis of traffic-calming experiences to date in the United States and Canada. |
| General Approach This report draws from detailed information collected on traffic-calming programs in 20 featured
communities, another 30 communities surveyed less extensively, and a parallel Canadian effort by the Canadian Institute of Transportation Engineers (CITE)
and the Transportation Association of Canada (TAC). The intended audience is transportation professionals. |
| Methods This report is broken down into the following sections:
- Brief history of traffic calming.
- Toolbox of traffic-calming measures.
- Engineering and aesthetic issues.
- Traffic-calming impacts.
- Legal authority and liability.
- Emergency response and other agency concerns.
- Warrants, project selection procedures, and public involvement.
- Beyond residential traffic calming.
- Traffic calming in new developments.
|
| Key Terms Traffic Calming, Speed Reduction, Pedestrian Safety |
| Key Results Brief History of Traffic Calming:
- Several trends are evident in Europe and Australia, such as the shift from volume controls to speed controls, from simple to diverse programs,
and from spot to areawide treatments.
- The following are lessons learned from the implementation of traffic calming in Seattle, WA: Test complex areawide treatments before
implementing them permanently, assess public support, conduct before/after studies of traffic impacts, include traffic crashes among the impacts
studied, work with emergency services, and opt for the most conservative design.
Toolbox of Traffic-Calming Measures:
- Volume control measures: The primary purpose is to discourage or eliminate through traffic. The following are examples: Full- and
half-street closures, diverters of various types (semi-diverters and diagonal diverters), median barriers, and forced turn islands.
- Speed control measures: The primary purpose is to slow traffic. The following are speed control measures: Speed humps, speed tables,
raised intersections, textured pavement, traffic circles, chicanes, chokers, lateral shifts, and realigned intersections.
- Important trends: The following trends in the design and application of traffic-calming measures are discussed and should be considered
in future practice: Simple to diverse programs, from volume to speed controls, from random to predictable treatments, from narrowing to deflection,
spacing of measures, and from spot to areawide treatments.
Engineering and Aesthetic Issues:
- Horizontal curvature vs. vehicle speed: The sharper the horizontal curvature at a circle, chicane, or other slow point, the slower
motorists will travel around or through it.
- Vertical curvature vs. vehicle speed: Vertical curves produce forces of acceleration that are uncomfortable for drivers exceeding
given operating speeds. The sharper the vertical curvature at speed humps, speed tables, and other slowpoints, the slower motorists will travel
over them.
Traffic-Calming Impacts:
- Traffic speeds: Speed humps have the greatest impact on 85th percentile speeds, reducing them by an average of more than
11.3 km/h (7 mi/h), or 20 percent. Raised intersections, long speed tables, and circles have the least impact.
- Traffic volumes: The impact of traffic-calming measures on traffic volumes depends on the availability and quality of alternative
routes.
- Collisions: The Insurance Corporation of British Columbia published a report titled Safety Benefits of Traffic Calming, which
summarized 43 international studies. Among the 43 studies, collision frequencies declined by anywhere from 8 to 100 percent (see figure). In this
particular survey, traffic circles and chicanes had the most favorable impacts on safety, reducing collision frequency by an average of 82 percent.
Emergency Response and Other Agency Concerns:
- The following are strategies for addressing emergency response concerns: Avoid emergency response routes, avoid emergency response facilities,
gradually build traffic-calming measures, communicate, and use measures that accommodate fire and rescue vehicles.
|
Figure A. Reduction in collision frequency for all researched case studies.
|
| Conclusions, Recommendations, Best Practices, Design Implications, or Design Guidelines See Key Results above. |
| General Comments None |
| Title Effects of Raising and Lowering Speed Limits on Selected Roadway Sections (FHWA-RD-92-084) |
Funding Agency and Contact Address Federal Highway Administration
6300 Georgetown Pike
McLean, VA 22101-2296
COTR:
Howard H. Bissell
Davey L. Warren |
| Authors Federal Highway Administration |
| Publication Date 1996 |
Number of Pages 84 |
| Document Web Site http://www.ibiblio.org/rdu/sl-irrel.html |
| Source Type Crash/Demographic Statistical Analysis |
| Driving Conditions Normal |
Vehicle Platforms Not Specified |
| Objective To determine the effects of changing speed limits on traffic operations and safety for surface (nonfreeway)
rural and urban roadways. |
| General Approach Speed and crash data were collected in 22 States at 100 sites before and after speed limits were
altered. Before/after data were also collected simultaneously at comparison sites where speed limits were not changed to control for the time trends.
|
| Methods Data Collection:
- The speed limits were lowered at 59 sites and raised at 41 sites. The sites included 63 rural sites, 22 small urban sites, and 15 urban sites.
The section lengths varied from 0.5 to 20.3 km (0.3 to 12.6 mi).
- Traffic data were collected before and after the speed limits were changed for 24-hour (h) periods using automated roadside units connected
to inductive loop mats to record speeds, headways, and types of vehicles. Data were collected for more than 1.6 million vehicles.
- Crash data included more than 6,000 reported crashes. For most sections, crash data were collected for a 3-year period before and a 2-year
period after the speed limits were changed. Data were coded for crash type, severity, and light and surface conditions.
Data Analysis:
- Free-flow speeds (vehicles with headways of 4 s or greater) were used for the speed analyses. Mean speed, standard deviation of the speed
distribution, percentile speeds, and percentage of vehicles exceeding the posted speed limits by 8, 16, 24, and 32 km/h (5, 10, 15, and 20 mi/h)
were computed for all sites.
- Comparisons were made for groups of sites where speed limits were lowered by 8, 16, and 24 km/h (5, 10,and 15 mi/h).
- The analyses included a check for comparability, paired comparison ratios, cross-product ratios, an Empirical Bayes method, and the weighted
average logit method. Because of the small sample sizes, the main analyses combined all sites where the speed limits were raised and all sites
where they were lowered.
|
| Key Terms Speed Limits, Roads, Traffic Accidents |
Key Results
- Neither raising nor lowering the speed limit had much effect on vehicle speeds (mean speeds and the 85th percentile speeds did not
change more than 1.6 or 3.2 km/h (1 or 2 mi/h)), even for speed limit changes based on the amount that the posted speed limit was altered.
- The percentage of compliance with the posted speed limits improved when the speed limits were raised. When the speed limits were lowered,
compliance decreased.
- Lowering the speed limit below the 85th percentile or raising the limit to the 85th percentile speed also had little
effect on drivers’ speeds (see figure).
|
Figure A. Maximum and average changes in the 85th percentile speeds at the experimental
sites.
1 mi/h = 1.61 km/h |
Conclusions, Recommendations, Best Practices, Design Implications, or Design Guidelines
- Although changes in vehicle speeds were small, driver violations of the speed limits increased when the posted speed limits were lowered.
Conversely, violations decreased when limits were raised.
- Based on the sites selected for this study, it appears that highway agencies have a tendency to set speed limits slightly below the average
speed of traffic.
- Changing posted speed limits alone, without additional enforcement, educational programs, or other engineering measures, has only a minor
effect on driver behavior.
- There is not sufficient evidence in this data set to reject the hypothesis that crash experience changed when posted speed limits were
either raised or lowered.
|
| General Comments Attention should be given to identifying factors or a method that leads to establishing uniform
speed limits for similar roadway and traffic conditions. |
| Title Synthesis of Studies on Speed and Safety
(Transportation Research Record 1779, pp. 86-92) |
Funding Agency and Contact Address School of Civil and Environmental
Engineering
Georgia Institute of Technology
Atlanta, GA 30318 300 Home Park Avenue, N.W. COTR: Not Specified |
| Authors Feng, C. |
| Publication Date 2001 |
Number of Pages 7 |
| Document Web Site None |
| Source Type Literature Review |
| Driving Conditions Normal |
Vehicle Platforms Not Specified |
| Objective To present an overview of research interest in the United States and elsewhere on the relationship between
speed and safety. |
| General Approach Studies on the relationship between speed and safety were compiled and reviewed. This paper tries
to present a complete picture of these studies so that further exploration of the relationship can be based on solid ground. |
| Methods Previous research is discussed for the following topics:
- Factors affecting safety.
- Factors affecting speed.
- Speed management.
|
| Key Terms Safety, Speed Management, Traffic Calming |
| Key Results
Selected studies are reported for each topic below. The report gives a detailed review of several studies for each topic.
Factors Affecting Safety:
- Environment: These factors affect safety by impairing visibility, decreasing stability, and reducing controllability.Precipitation, fog,
sunshine, and dust storms are possible causes of impaired visibility. Rain, snow, and ice can make road surfaces slippery and decrease vehicle
stability. Simulation studies indicated that a sudden visibility reduction showed that traffic safety is decreased. However, drivers may compensate
for a higher crash risk by reducing speeds,maintaining safe spacing, and driving more carefully.
- Distraction: Actions falling into this category are driving while talking, tuning the radio, looking for directions, using a cellphone,
drinking, eating, smoking, and exercising curiosity.
- Speed limit: The speed of vehicles has shown an upward trend over the last 20 years; overall crash rates showed a steady decline.
However, the fatality rate on the rural Interstate system has shown a 36 percent increase since the 105-km/h (65-mi/h) speed limit went into effect
in 1987.
- Speed: NHTSA estimates that speed plays a role in 31 percent of all fatal crashes. Increases in travel speeds lead to a dramatic
increase in collision severity.
Factors Affecting Speed:
- Environment: These factors affect not only mean speed, but also speed variance, because of the difference in driver experiences and
characteristics. Some studies indicate that the standard deviation of speed doubles during fog events and triples during snow. Another study
examined how various driver groups differ in their perception and adjustments.Survey results suggested that most drivers recognize the seriousness
of the traffic safety problem and, in fact, had a fairly accurate impression of the relative risk associated with various driving conditions.
However, the range of driver adjustments invoked during inclement weather did not reflect the magnitude of the weather hazard. The results
suggested that countermeasure programs should focus either on improved skills training or on ways to induce greater caution during inclement
conditions.
- Advisory and regulatory information: One study investigated the effects of route guidance systems on attentional demand and efficiency
of the driving task. The results indicate that for long distances, no significant differences in speed and standard deviation of speed existed.
However, for shorter distances, significant changes in speeds were identified. These findings suggested that drivers compensate by driving faster
after a period of slowing in response to advisory information.
Speed Management:
- Variable speed limit: Previous research indicates that the benefits of variable speed limits were increased traffic throughput and
improved safety.
-
Camera: The results from one study indicate that: (1) speeding decreased at all sites, but the decreases were greater attest sites where
photo radar was used; (2) the greatest decreases in the proportion of speeding vehicles at all sites were for vehicles traveling at the highest
rates of speed; (3) media coverage of the use of photo radar affected the behavior of drivers at all sites; (4) the greatest speed reductions
occurred on the six-lane test section; (5) the presence of signage announcing photo radar reduced speeding; and (6) an increase in enforcement
presence and fully deployed photo radar units reduced speeding on the test roadways even more.
- Traffic-calming techniques: Previous research has concluded that using traffic-calming techniques can have positive effects on traffic
safety, risk perception, and the environmental quality of the area.
|
Conclusions, Recommendations, Best Practices, Design Implications, or Design Guidelines
- Most studies are site and time specific, so their results may not be true when generalized. To analyze the relationship between speed and safety
in the long run, studies need to be carried out constantly and systematically.
- The speed limit must reflect real-time road, traffic, and weather conditions. A speed-limit calculation should be based on traffic flow
prediction, prevailing speed, and environmental factors, so that the limit will be accepted by most drivers. This calls for variable speed limits.
- Studies found that drivers may not always accurately rate their driving behavior. This finding reminds one not to rely too heavily on data
obtained by subjective methods.
- Recent studies showed strong interests in weather, and weather is found to have a close relationship with speed and safety. The impact of
weather may include reduced visibility, stability,and controllability.
|
| General Comments None |
| Title Design Factors That Affect Driver Speed on Suburban Arterials(FHWA/TX-00/1769-3) |
Funding Agency and Contact Address Research and Technology Transfer
Section, Construction Division
Texas Department of Transportation
P.O. Box 5080
Austin, TX 78763-5080 COTR: Not Specified |
| Authors Fitzpatrick, K., Carlson, P.J., Wooldridge, M.D., and Brewer, M.A. |
| Publication Date June 2000 |
Number of Pages 160 |
| Document Web Site None |
| Source Type Field Test |
| Driving Conditions Normal |
Vehicle Platforms Not Specified |
Objective
- Identify those factors that affect speed on suburban arterials and determine the range of the influence.
- This research project will help answer the following questions:
- Do roadway variables affect speed on suburban arterials?
- Which alignment, cross section, roadside, or traffic control device variables affect operating speed?
- For a variable that affects speed, what is the design value range that is influential?
|
| General Approach The project was subdivided into two phases. Phase I investigated potential data collection techniques,
preliminary analysis techniques, and experimental designs. The lessons learned from the pilot studies conducted in phase I were used to develop the data
collection methodology for phase II of the project. |
| Methods Phase I :
- Laser Pilot Study: Laser guns were used to collect the speed of free-flowing vehicles as they approached, traversed, and departed the
study site. Three laser guns were employed at six study sites to obtain a comprehensive speed profile for the horizontal curve and its approaches.
The laser guns were wired to laptop computers that recorded data three times per second when the gun was activated.
- Individual Driver Pilot Study: Individual drivers drove an instrumented test vehicle. Six drivers drove through several arterial
sections while their speeds and positions on the roadway network were monitored.
Phase II:
- The data collection and reduction methodology used was similar to the methodology used in the pilot effort. Laser guns were used to collect
the speed of free-flowing vehicles through the study sites.
|
| Key Terms Operating Speed, 85th Percentile Speed, Posted Speed Limit, Suburban Arterials, Curves, Straight
Sections |
Key Results
- When all variables were considered, the only significant variable for straight sections was posted speed limit (see table below).
- In addition to posted speed, deflection angle and access density classes influence speed on curve sections.
- Without speed limit, only lane width is a significant variable for straight sections.
- For curve sites without speed limit, the impact of median presence now becomes significant along with roadside development.
Table A. Summary of regression analyses.
| Category |
Curve Sections |
Straight Sections |
| Adjusted R2 (percent) |
Prob > F |
Significant Variables |
Adjusted R2 (percent) |
Prob > F |
Significant Variables |
| Alignment |
21 |
0.0480 |
- Curve Radius
- Deflection Angle
|
17 |
0.0068 |
Downstream
Distance to
Control |
| Cross Section |
24 |
0.0320 |
Median Presence |
25 |
0.0012 |
Average Lane
Width |
| Roadside |
40 |
0.0228 |
- Access Density
- Roadside Development
|
N/A |
N/A |
No Variables
Found Significant |
| Traffic Control Device |
49 |
0.0005 |
Posted Speed
Limit |
53 |
0.0001 |
Posted Speed
Limit |
| All |
71 |
0.0001 |
- Posted Speed Limit
- Deflection Angle
- Access Density
|
53 |
0.0001 |
Posted Speed
Limit |
|
Conclusions, Recommendations, Best Practices, Design Implications, or Design Guidelines
- Using speed profiles, researchers were able to verify that the midpoint of a horizontal curve is where speeds are most influenced. This should
help other researchers collecting data using spot speed methods.
- A finding from this project is that the way a curve appears to a driver may have an effect on the speed a driver selects prior to and within the
beginning of a horizontal curve. Additional research is needed to develop a better understanding of how the appearance of the curve affects speed.
- While individual variables have an influence on speeds, the combination of several variables may also form an environment that has a significant
influence on drivers. Limited access points, wide medians, unnarrowed lanes, few trees along the roadside, and other characteristics in combination
encourage the higher speeds. Therefore, additional research could examine what
combination of variables and their dimensions would encourage speeds within a given range.
- The operations at traffic signals can have a very significant impact on the speeds along a suburban arterial. In addition, the amount of traffic
on the roadway can also result in decreased travel speeds. The influences of these variables were minimized in this study by selecting sites away
from signals. Another study could include consideration of these other, highly influential variables on driver speeds on suburban arterials.
|
| General Comments None |
| Title Speed Prediction for Two-Lane Rural Highways (FHWA-RD-99-171) |
Funding Agency and Contact Address Office of Safety Research
and Development
Federal Highway Administration
6300 Georgetown Pike
McLean, VA 22101-2296 COTR: Ann Do |
| Authors
Fitzpatrick, K., Elefteriadou, L., Harwood, D.W., Collins, J.M., McFadden, F., Anderson, I.B., Krammes, R.A., Irizarry, N., Parma, K.D., Bauer, K.M.,
and Passetti, K. |
| Publication Date August 2000 |
Number of Pages 217 |
| Document Web Site http://www.tfhrc.gov/safety/ihsdm/libweb.htm |
| Source Type Crash/Demographic Statistical Analysis |
| Driving Conditions Normal |
Vehicle Platforms Light Vehicles, Commercial Vehicles |
| Objective To develop speed-prediction equations for horizontal and vertical alignments and for other vehicle types,
determine the effects of spiral transitions on speeds, determine the deceleration and acceleration rates for vehicles approaching and departing horizontal
curves, validate the speed-prediction equations, develop a speedprofile model for inclusion in the Interactive Highway Safety Design Model (IHSDM), and
identify the relationship of the design consistency module to other modules and components of the IHSDM. |
General Approach
- Speed and geometry data were collected from 176 sites distributed across 6 States (Minnesota, New York,Pennsylvania, Oregon, Washington, and
Texas). Regression models were developed to predict the 85thpercentile speed of passenger vehicles on horizontal curves, vertical curves,
and combined horizontal and vertical curves based only on the geometry of the curves.
- Three possible ways in which combined horizontal and vertical alignments affect operating speeds were identified. Regression analysis was used
to determine which alternative best describes how geometry influences the speeds of passenger cars.
- Regression analyses were also performed to determine if the presence of spiral transitions influenced the speed of passenger car drivers. In
addition to evaluating passenger car speeds, the speeds of trucks and recreational vehicles were examined.
|
| Methods Independent Variables:
- Horizontal curve (degree of curvature, deflection angle, radius, length, grade, milepoint or station at the beginning of the curve).
- Vertical curve (approach grade, departure grade, length, milepoint or station at the beginning of the curve, point of intersection, end
of curve, crest or sag, approach tangent length, approach tangent grade).
- Pavement geometry (pavement width, lane width, unpaved shoulder width, superelevation rate).
Dependent Variables:
|
| Key Terms Two-Lane Rural Highway, Speed-Prediction Equations, Acceleration/Deceleration, IHSDM |
Key Results
- A speed-profile model was developed that can be used to evaluate the design consistency of a facility or to generate a speed profile along an
alignment. The design consistency evaluation consists of identifying undesirable speed changes between features. The speed-prediction equations
are used to predict the speeds for the features, and then the differences in speed between successive features would be calculated.
- The speed-profile model developed in the research appears to provide a suitable basis for the IHSDM design consistency module.
- There is no difference in 85th percentile speeds at the midpoint on circular curves from those with spiral transitions.
- The data for all truck types and recreational vehicles on horizontal curves display a general speed behavior that is similar to that of
passenger vehicles.
- Of the candidate design consistency measures, four have relationships to crash frequency that are statistically
significant and appear to be sensitive enough that they may be potentially useful in a designconsistency methodology. These four candidate design
consistency measures are: (1) predicted speed reduction by motorists on a horizontal curve relative to the preceding curve or tangent, (2) ratio of
an individual curve radius to the average radius for the roadway section as a whole, (3) average rate of vertical curvature on a roadway section,
and (4) average radius of curvature on a roadway section. Of these candidate design consistency measures, the speed reduction on a horizontal curve
relative to the preceding curve or tangent clearly has the strongest and most sensitive relationship to crash frequency.
|
| Figure A. Predicted speed profile for sample roadway. |
Figure B. Closeup of a portion of the design consistency evaluation. |
 |
 |
|
Conclusions, Recommendations, Best Practices, Design Implications, or Design Guidelines
- Of the different alternatives examined, a design consistency methodology based on predicted speed reductions was the best identified.
- Additional insight into the influences of speeds on tangent sections of various lengths and grades is needed.This would greatly enhance the
effectiveness of any speed-profile model because it would validate the assumptions currently being made.
- Further research should be conducted to extend all aspects of this research, such as speed-prediction equations, acceleration/deceleration
behavior, and the design consistency module speed-profile model, to roadway types other than two-lane rural highways.
- The IHSDM should contain a design consistency module based on the speed-profile model developed in this research. Further refinements should
be made to the IHSDM design consistency module in future research to include the
capability of identifying design inconsistencies based on factors other than horizontal and vertical alignment. Such factors might include
intersections, driveways, and auxiliary lanes.
- Because the safety evaluation demonstrated that predicted speed reduction has the strongest relationship to crash frequency, speed reduction
should be the primary measure in design consistency methodology for horizontal and vertical curvature.
|
| General Comments None |
| Title Effectiveness of Changeable Message Signs in Controlling Vehicle Speeds in Work Zones (FHWA/VA-95-R4) |
Funding Agency and Contact Address Virginia Department of Transportation
1401 E. Broad Street
Richmond, VA 23219 COTR: Not Specified |
| Authors Garber, N.J., and Patel, S.T. |
| Publication Date August 1994 |
Number of Pages 97 |
| Document Web Site http://ntl.bts.gov/DOCS/EC.html |
| Source Type Field Test |
| Driving Conditions Degraded |
Vehicle Platforms Not Specified |
| Objective
To evaluate the effectiveness of the changeable message sign (CMS) with radar unit in reducing work-zone speeds. |
| General Approach Four CMS messages designed to warn drivers that their speed exceeded the maximum safe speed were tested
at seven work zones on two interstate highways in Virginia. |
Methods
- Speed and volume data for the whole population traveling through the work zone were collected with automatic traffic counters.
- To assess the effect of CMS on high-speed drivers in particular, vehicles that triggered the radar-activated display were videotaped as they
passed through the work zone.
- Using the data obtained from the traffic counters and videotapes, speed characteristics were determined at the beginning, middle, and end of
the work zone.
- Those characteristics were computed for the entire population and for high-speed vehicles separately.
- The following four CMS were used: "You are speeding slow down," "High speed slow down," "Reduce speed in work
zone," and "Excessive speed slow down."
|
| Key Terms Work Zones, Speed Reduction, Changeable Message Signs, Video Taping |
Key Results
- The odds ratios indicated that CMS effectively reduced the number of vehicles speeding by any amount, by 8.0 km/h (5 mi/h) or more, and by
16.1 km/h (10 mi/h) or more in the work zone. Approximately three-quarters of the odds ratios calculated represented a potential reduction of 70
percent or greater in the number of vehicles speeding if CMS were used in the work zones.
- An analysis of variance (ANOVA) used to compare speeds when using the CMS with speeds when using MUTCD signage only showed that all speed
characteristics–average speeds, 85th percentile speeds, speed variance, and the percentage of vehicles speeding by any amount, by
8.0 km/h (5 mi/h) or more, and by 16.1 km/h (10 mi/h) or more–were reduced by any of the four CMS messages. In some cases, these reductions
were not significant.
- Trends in average and 85th percentile speeds observed from the camera data show that all of the messages were effective in reducing
the speeds of high-speed vehicles through the work zone (see figure).
- Finally, t-tests were conducted using the speed data obtained for the high-speed vehicles, and all of the messages were effective in
significantly reducing the average speeds of those vehicles traveling 94.9 km/h (59 mi/h) or faster in an 88.5-km/h (55-mi/h) work zone when
compared to MUTCD signage only.
|
Figure A. Average speeds (mi/h), camera data (I-81 South Buffalo Gap) (threshold speed limit: 94.9 km/h (59 mi/h),
posted speed limit: 88.5 km/h (55 mi/h)). 1 mi/h = 1.61 km/h |
Conclusions, Recommendations, Best Practices, Design Implications, or Design Guidelines
- CMS with a radar unit are more effective than static MUTCD signs in altering driver behavior in work zones. Using personalized messages for
high-speed drivers will result in these drivers being more inclined to reduce vehicle speeds in work zones.
- All of the messages on the CMS reduce the odds of speeding in the work zone. In most cases, the use of the CMS resulted in the reduction of
vehicles speeding by 50 percent or more.
- There were no significant differences between the four messages. However, based on the behavior of the entire population, the messages were
ranked in the following order of effectiveness: (1) "You are speeding slow down," (2) "High speed slow down," (3) "Reduce
speed in work zone," and (4) "Excessive speed slow down."
- The following guidelines are suggested for the use of CMS: (1) threshold speed should be set at approximately 4.8 km/h (3 mi/h) greater than
the posted speed limit in order to warn drivers, (2) CMS should be placed justbefore the beginning of the actual activity area, and (3) the message
should read "You are speeding slow down" or "High speed slow down."
|
| General Comments None |
| Title The Effect of Crosswalk Markings on Vehicle Speeds in Maryland, Virginia, and Arizona (FHWA-RD-00-101) |
Funding Agency and Contact Address Office of Safety Research
and Development
Federal Highway Administration
6300 Georgetown Pike
McLean, VA 22101-2296 COTR: Carol Tan Esse |
| Authors Knoblauch, R.L., and Raymond, P.D. |
| Publication Date August 2000 |
Number of Pages 9 |
| Document Web Site http://www.tfhrc.gov/safety/pedbike/index.cfm |
| Source Type Field Test |
| Driving Conditions Normal |
Vehicle Platforms Light Vehicles |
| Objective To determine if the presence of crosswalk markings alter drivers’ speeds. |
| General Approach A before/after evaluation of pedestrian crosswalk markings was performed in Maryland, Virginia, and
Arizona.Six sites that had been recently resurfaced were selected. All sites were uncontrolled intersections with a speed limit of 56 km/h (35 mi/h).
"Before" data were collected after the centerline and edgeline delineations were installed, but before the crosswalk was installed. "After
" data were collected after the crosswalk markings were installed. Speed data were collected under three conditions: (1) no pedestrian present, (2)
pedestrian looking, and (3) pedestrian not looking. All pedestrian conditions involved a staged pedestrian. |
Methods
- Study locations: Maryland, Virginia, and Arizona.
- All sites were uncontrolled intersections with a stop control on the minor leg.
- Under the "before" conditions, all other roadway delineations were installed, but the crosswalk had not yet been installed.
- "After" condition data were collected after the crosswalk markings were installed.
- The speed limit at all sites was 56 km/h (35 mi/h).
- All sites were observed under the following three pedestrian conditions:
- "No Pedestrian": Speeds were measured with no pedestrian present.
- "Pedestrian Looking": A staged pedestrian approached the crosswalk, stopped at the edge of the curb as though waiting to cross,
and looked square at the oncoming traffic.
- "Pedestrian Not Looking": A staged pedestrian approached the crosswalk, stopped at the edge of the curb as though waiting to
cross, and looked directly ahead.
- Traffic speed was measured by timing vehicles between two marked spots approximately 54.9 m (180 ft) apart.
|
| Key Terms Pedestrians, Safety, Crosswalks, Crosswalk Markings, Unsignalized Intersections |
Key Results
- Because of the inexplicable large speed reduction found in the No Pedestrian condition at site 5, it was decided to exclude site 5 from the
analysis of all sites combined.
- Overall, the crosswalk alone resulted in a speed reduction (average speed reduction of 3.32 km/h) that was significant (see table below).
- In the Pedestrian Looking scenario, there was a small decrease in speed (0.28 km/h) that was not significant.
- In the Pedestrian Not Looking scenario, there was a significant decrease in average speed (2.61 km/h).
Table A. Effect of crosswalk markings on vehicle speed.
| Site |
Pedestrian
Scenario |
Mean Speed (km/h) |
Speed
Change |
t (df) |
Significance |
| Before |
After |
Site #1
Jefferson St.
Rockville, MD |
No Ped |
60.60 |
61.15 |
+0.55 |
-0.26 (78) |
NS |
| Ped Looking |
57.48 |
65.25 |
+7.77 |
-4.21 (78) |
< 0.001 |
| Ped Not Looking |
59.57 |
61.53 |
+1.96 |
-1.26 (78) |
NS |
| |
|
|
|
|
|
|
Site #2
Battery Lane
Bethesda, MD |
No Ped |
55.77 |
55.51 |
-0.26 |
0.14 (78) |
NS |
| Ped Looking |
58.89 |
56.77 |
-2.12 |
0.91(78) |
NS |
| Ped Not Looking |
56.48 |
53.69 |
-2.79 |
1.52 (78) |
NS |
| |
|
|
|
|
|
|
Site #3
Burke Lake Rd.
Fairfax County,
VA |
No Ped |
72.14 |
66.36 |
-5.78 |
2.75 (78) |
0.008 |
| Ped Looking |
68.47 |
67.04 |
-1.43 |
0.70 (78) |
NS |
| Ped Not Looking |
68.59 |
66.91 |
-1.68 |
1.03 (78) |
NS |
| |
|
|
|
|
|
|
Site #4
Gallows Road
Fairfax County,
VA |
No Ped |
75.70 |
69.49 |
-6.21 |
3.30 (78) |
0.001 |
| Ped Looking |
73.34 |
68.44 |
-4.90 |
2.83(78) |
0.006 |
| Ped Not Looking |
70.53 |
67.67 |
-2.86 |
1.80 |
0.760 |
| |
|
|
|
|
|
|
Site #5
4th Ave.
Extension at
Main Canal
Yuma, AZ |
No Ped |
63.85 |
58.94 |
-4.91 |
2.05 (78) |
0.044 |
| Ped Looking |
59.63 |
58.88 |
0.75 |
0.30 (78) |
NS |
| Ped Not Looking |
62.58 |
55.29 |
-7.29 |
3.59 (78) |
0.001 |
| |
|
|
|
|
|
|
Site #6
4th Ave.
Extension at
37th Street
Yuma, AZ |
No Ped |
79.11 |
59.31 |
-19.80 |
5.81 (78) |
< 0.001 |
| Ped Looking |
61.53 |
59.38 |
-2.15 |
0.79 (78) |
NS |
| Ped Not Looking |
66.49 |
56.67 |
-9.82 |
3.91 (78) |
< 0.001 |
| |
|
|
|
|
|
|
Sites 1-5
(weighted
equally) |
No Ped |
65.64 |
62.32 |
-3.32 |
2.96 (384.76) |
0.003 |
| Ped Looking |
63.58 |
63.30 |
-0.28 |
0.26 (398) |
NS |
| Ped Not Looking |
63.65 |
61.04 |
-2061 |
2.69 (398) |
0.007 |
| |
|
|
|
|
|
|
All Sites
(weighted
equally) |
No Ped |
67.88 |
61.81 |
-6.07 |
5.32 (478) |
< 0.001 |
| Ped Looking |
63.22 |
62.63 |
-0.59 |
0.58 (478) |
NS |
| Ped Not Looking |
64.11 |
60.29 |
-3.82 |
4.16 (478) |
< 0.001 |
|
Conclusions, Recommendations, Best Practices, Design Implications, or Design Guidelines
- The results indicate a slight reduction at most, but not all, of the sites.
- Overall, there was a significant reduction in speed under both the No Pedestrian and the Pedestrian Not Looking conditions.
- It appears that crosswalk markings alone make drivers on relatively low-speed arterials more cautious and more aware of pedestrians.
|
| General Comments None |
| Title Evaluation of Work Zone Speed Reduction Measures |
Funding Agency and Contact Address Center for Transportation Research
and Education
Iowa State University
2901 South Loop Drive, Suite 3100
Ames, IA 50010-8632 COTR: Not Specified |
| Authors Maze, T., Kamyab, A., and Schrock, S. |
| Publication Date April 2000 |
Number of Pages 141 |
| Document Web Site None |
| Source Type Literature Review, Survey |
| Driving Conditions Degraded |
Vehicle Platforms All |
Objective
- Study work–zone speed–reduction strategies.
- Explore transportation agencies’ policies regarding managing speeds in long-term, short–term, and moving work zones.
|
| General Approach This report consists of three chapters. The first chapter, "Literature Review" examines the
current speedreduction practices in work zones and provides a review of the relevant literature. The speed control strategies reviewed in this chapter range
from posting regulatory and advisory speed limit signs to using the latest radar technologies to reduce speeds in work zones. The second chapter, "
Technology Description," includes a short writeup for each identified speed control technique. The writeup includes a description, the results of any
field tests, the benefits, and the costs of the technology or technique. The third chapter, "Survey," provides summaries of the response to each
question of a survey administered. |
| Methods Survey:
- The survey consisted of six multipart questions.
- Every State DOT and a number of non-DOT transportation agencies in some States were contacted.
- Surveys were sent to 63 State transportation agencies. Thirty-nine responses were received.
- Responses were entered into a database to allow queries to be conducted on each individual question.
|
| Key Terms Speed Reduction, Work Zone |
| Key Results Literature Review:
- Almost every transportation agency posts regulatory and advisory speed signs to inform motorists of the reduced speed limit in work zones. There
are also a few agencies that place flaggers. Some agencies have experimented with lane narrowing and other advanced strategies such as using drone
radar, speed monitoring displays, removable rumble strips, and optical bars.
- Flagging and police enforcement speed-reduction strategies have had very positive impacts in reducing work-zone speeds. They are, however, labor
intensive and can become costly with long-term use.
- Replacing these strategies with innovative technologies, such as robotic flaggers and photo-radar enforcement units, may be practical, more
cost-effective solutions.
- None of the techniques described individually is capable of reducing vehicle speeds to the desired level.
- The most effective speed reduction will probably involve some combination of the techniques described inthis literature review.
Technology Description:
- Safety Alert System (Cobra Electronics Corporation): This is a warning system that alerts drivers of emergency vehicles, road hazards,
and trains. Research indicates that after the transmitter placement, average passenger car and truck speeds were reduced by 25 and 45 percent,
respectively.
- Safety Warning System (SWS) (MPH Industries, Inc.): This system consists of a transmitter and a receiver. The transmitter can be
mounted on the outside of a vehicle. The SWS transmitter sends warning messages concerning road hazards to drivers of vehicles equipped with SWS
detectors.
- Speed Monitor Display (MPH Industries, Inc.): Speed displays use a radar device to detect and display the speeds of approaching
vehicles. Speed monitoring displays are not generally used to enforce speed limits and issue citations; rather, the assumption is that motorists
will drive slower once they see their excessivespeed on the display.
- SpeedGuard Speed Monitor Display (Stalker, A Division of Applied Concepts, Inc.): SpeedGuard is a trailer-mounted radar system that
displays the speeds of approaching vehicles on a high-intensity, 60.9-cm (24-inch) LED. There are several options when using SpeedGuard. When the
unit detects a target vehicle traveling over the speed limit, a strobe lamp flashes toward the offending driver to simulate photo radar. It also
alerts workers in work zones of approaching high-speed vehicles.
- Wizard Work Zone Alert and Information Radio (TRAFCON Industries, Inc.): This is designed to give drivers of heavy trucks enough
advance warning of delays at upcoming construction sites or incidents. The wizard unit automatically broadcasts an alert message over any Citizen
’s Band (CB) channel.
- Removable Rumble Strips (Advance Traffic Markings, A Division of Patch Rubber Company): Removable rumble strips are designed forplacement
at construction sites to alert motorists of upcoming roadwayconditions
Survey:
- During construction activities, most participating State agencies reported reducing speed limits to 16.1 km/h (10 mi/h) below the normal posted
speed. There are a few agencies that even consider reducing speed limits by 32.2 km/h (20 mi/h).
- Among the 12 identified speed-reduction strategies, the use of regulatory speed limit signs and police enforcement are the most common practices
reported by the agencies. However, only 7 percent of the participating agencies consider the use of regulatory signs to be an effective
speed-reduction strategy.
- The survey results indicate that the use of changeable message signs (CMS) by 18 out of 34 agencies might be an indication of their potential
in reducing work-zone speeds. A number of these agencies use CMS in conjunction with radar to detect and display the speeds of approaching vehicles.
|
| Conclusions, Recommendations, Best Practices, Design Implications, or Design Guidelines See Key Results above. |
| General Comments None |
| Title Handbook of Speed Management Techniques (FHWA/TX-00/1770-2) |
Funding Agency and Contact Address Research and Technology
Transfer Office
Texas Department of Transportation
P.O. Box 5080
Austin, TX 78763-5080 COTR: Not Specified |
| Authors Parham, A.H., and Fitzpatrick, K. |
| Publication Date September 1998 |
Number of Pages 248 |
| Document Web Site None |
| Source Type Handbook |
| Driving Conditions Normal |
Vehicle Platforms Not Specified |
| Objective To identify speed management techniques that are used throughout the country and develop a handbook documenting
these techniques. |
| General Approach This handbook was created to provide practitioners with basic information regarding speed management
techniques, including descriptions, photographs, experiences of agencies that have used the techniques, and lessons learned. |
| Methods The techniques are divided into the following four categories:
- Roadway Design Techniques: Physical measures designed to alter the driver’s path.
- Road Surface Techniques: These change the surface of the roadway by adding vertical elements such as speed humps, by narrowing the
roadway, or by drawing the driver’s attention through the use of pavement markings.
- Traffic Control Techniques: For example, signs and beacons that are used to alert drivers of allowable speeds or to warn them of an
approaching hazard or other traffic control device, such as a traffic signal.
- Enforcement Techniques: These techniques remind drivers of speed limits and of the speed they are traveling through speed displays or
additional enforcement.
|
| Key Terms Speed Management, Traffic Calming, Devices |
Key Results
Table A. Analysis of roadway design techniques.
| Technique |
Key Advantages |
Key Disadvantages |
| Roadway Design Techniques |
| Chicane |
Can reduce speeds at the chicane or on the entire street, can reduce cut-though volumes |
May require high initial costs, is restrictive for emergency vehicles, potential crash obstacles |
| Neckdown/Choker and Central Narrowing Island |
Can shorten crossing pedestrian time, creates refuge, can make pedestrian crossing more visible |
May require some parking removal, may give pedestrians false sense of security, creates potential crash obstacles |
| Roadway Narrowing Technique |
Provides continuous visual channelization, can be inexpensive to install, does not affect emergency vehicles |
Requires regular maintenance, increases cost of roadway resurfacing, may be expensive to install |
| Full Closure |
Reduces traffic volume, allows bicycle and pedestrian access |
Restricts emergency vehicles, may increase trip length |
| Half Closure |
Reduces through traffic, can provide for bicyclists and pedestrians |
May increase emergency response time, does not provide 100 percent compliance |
| Entrance Feature |
Helps to create a sense of identity, creates additional areas for landscaping |
Is not uniform, may add additional landscaping costs |
| Traffic Circle |
Reduces vehicle speeds, improves safety conditions, can be visually attractive |
Adds a potential hazard to the middle of roadway, can increase emergency response time |
| Roundabout |
Can noticeably reduce speeds, reduces the number of conflict points at an intersection, provides an orderly and
continuous flow of traffic, is effective at multileg intersections |
May be restrictive for some larger emergency vehicles, requires pedestrian and bicyclist to adjust patterns, may have
reduced aesthetic value |
| Road Surface Techniques |
| Speed Hump |
Reduces speed, inexpensive, doesn’t affect intersection operations |
Can increase emergency response times, may shift traffic to parallel streets |
| Speed Table/Raised Intersection/Speed Cushion |
Reduces speed, draws attention to intersection and pedestrian areas |
May be expensive to construct and maintain, may affect emergency response times, requires additional signage and driver
education |
| Bicycle Mobility Technique |
Encourages nonmotorized travel, better defines where bicyclists are expected |
Could create additional conflicts between vehicles and bicycles |
| Innovative Pavement Marking |
May reduce traffic speeds and crashes, may heighten drivers’ sense of awareness |
More research is needed, expensive to maintain |
| Rumble Strip |
May reduce speeds, creates driver awareness, inexpensive to install |
May require high maintenance, may adversely impact bicyclist, is noisy |
| Traffic Control Techniques |
| Flashing Beacon |
Draws attention to hazards, low cost |
Effects may diminish over time |
| School Speed Zone |
Alerts drivers of pedestrian presence, uniform colors and symbols, reduces speed limits for certain hours |
Can be costly to implement and enforce, may cause confusion |
| Traffic Signal Coordination |
Can reduce number of stops, can encourage a preferred speed, can conserve fuel and minimize air pollution |
May be difficult to include all intersections, may be difficult to optimize both directions |
| Warning Sign |
Easily recognizable, alerts drivers of hazards |
Can cause disrespect for signs if used unnecessarily |
|
| Conclusions, Recommendations, Best Practices, Design Implications, or Design Guidelines
The key advantages and disadvantages are described above for each technique. Enforcement techniques are also discussed in the report. |
| General Comments None |
| Title Synthesis of Safety Research Related to Speed and Speed Management (FHWA-RD-98-154) |
Funding Agency and Contact Address Office of Safety and Traffic Operations
Research and Development
Federal Highway Administration
6300 Georgetown Pike
McLean, VA 22101-2296 COTR: Not Specified |
| Authors Stuster, J., Coffman, Z., and Warren, D. |
| Publication Date July 1998 |
Number of Pages 24 |
| Document Web Site http://www.tfhrc.gov/safety/speed/speed.htm |
| Source Type Literature Review |
| Driving Conditions Normal |
Vehicle Platforms Not Specified |
| Objective To present a synthesis of research findings on the safety effects of speed, speed limits, enforcement, and
engineering measures to manage speed. |
| General Approach This document provides a review of safety research related to speed and speed management. This review
builds upon a similar synthesis prepared in 1982. This synthesis highlights the relationships among vehicle speed and safety; factors influencing speeds;
and the effects on speed and crashes of speed limits, speed enforcement, traffic calming, and other engineering measures intended to manage speed. |
Methods
- A systematic review of the literature concerning safety research related to speed and speed management was conducted. Initial listings of
citations were generated by using key word filters on several bibliographic databases.
- The most productive databases were those of the National Technical Information Service (NTIS), the Knight-Ridder Transportation Resources Index,
and the Transportation Research Information Service (TRIS).
|
| Key Terms Speed, Speed Management, Safety, Speed Limits, Traffic Calming |
| Key Results Speed-Safety Relationships:
- Solomon (1964) found a relationship between vehicle speed and crash incidence that is illustrated by a U-shaped curve. Crash rates were lowest
for travel speeds near the mean speed of traffic and increased with greater deviations above and below the mean.
Factors Influencing Speed:
- Speed choice can be influenced by driver age; gender; attitude; perceived risks of law enforcement; weather, road, or vehicle characteristics;
speed zoning; speed adaptation; impairment; or simply "running late."
Enforcement:
- The following areas of speed enforcement were discussed: Mobile and stationary patrol vehicles, aerial enforcement, radar and laser speed
monitoring, automated enforcement, drone radar, speed feedback indicators, Public Information and Education (PI&E), and traffic enforcement
notification signs.
Engineering Measures:
- The current review found the mosteffective traffic-calming measures to involve vertical shifts in the roadway, such as speed humpsand speed
tables. However, the effectiveness of these is dependent upon spacing.
- Greater reductions in vehicle speeds and crashes are achieved when combinations of measures are used and when traffic calming is implemented
systematically over a wider area than a single neighborhood.
- Reductions in the incidence and severity of crashes of 50 percent or more are frequently reported (see table). However, most trafficcalming
projects result in reductions in traffic volume and many of the safety studies do not take this diversion into account.
Table A. Summary of the effects of traffic-calming measures.
| Reference |
Country |
Measure |
Results |
| Zaidel, et al. (1986) |
United States |
Rumble strips |
Mean speeds reduced by 40 percent |
| Bowers (1986) |
Germany |
Speed tables, narrowing, chicanes, gateways |
No change in crash rate Injuries reduced by 50 percent |
| Chua and Fisher (1991) |
Australia |
Various methods |
Crashes reduced by 50 percent Through traffic reduced by 35 percent Vehicle speeds reduced by 25 percent |
| Herrstedt (1992) |
Netherlands |
Various methods (staggering, gateways) |
Vehicle speeds reduced by 10 km/h (6 mi/h) |
| Kjemtrup and Herrstedt (1992) |
Netherlands and France |
Various methods (humps, staggerings) |
Crashes reduced by 30 to 60 percent |
| Engel and Thomsen (1992) |
Denmark |
Various methods (humps, staggerings) |
Speeds reduced by 11 km/h (7 mi/h) Injury rate reduced by 72 percent in calmed areas Injury rate increased by 96 percent on adjoining streets |
| Vis, et al. (1992) |
Netherlands |
Humps, staggerings, islands |
Speeds reduced by 20 percent Volumes reduced by 5 to 30 percent Crashes reduced by 5 percent, injury crashes by 25 percent |
| Webster (1993) |
United Kingdom |
Speed humps |
85th percentile speeds reduced by 12 km/h (10 mi/h) Crashes reduced by 71 percent on treated streets Crashes reduced by 8 percent on
surrounding roads |
| Dahlerbrach (1993) |
United States |
Speed humps |
Speeds reduced by 14 percent (8 km/h (5 mi/h))Traffic volume reduced by 7 percent |
| Halbert, et al. (1993) |
United States |
Speed humps, traffic circles |
85th percentile speeds reduced by 30 percent 85th percentile speeds reduced by 22 percent |
| Bulpitt (1995) |
United Kingdom |
Humps and chicanes |
Speeds reduced by 16 km/h (10 mi/h) Crashes reduced by up to 80 percent and traffic by 30 to 50 percent |
| Wheeler and Taylor (1995) |
United Kingdom |
Gateway signage, marking, narrowing |
Speeds reduced by 0 to 19 km/h (0 to 12 mi/h) Injury crashes decreased by 14 percent |
| Webster and Mackie (1996) |
United Kingdom |
Mostly humps and speed tables |
Speeds reduced by 14 km/h (9 mi/h) Crashes reduced by 61 percent |
| Griffin and Reinhard (1996) |
Japan and United Kingdom |
Chevron markings,transverse markings |
Crashes reduced by 5 to 50 percent Crashes reduced by 25 to 50 percent |
| Ewing, et al. (1998) |
United States |
Speed humps Minicircles |
Crashes reduced by 13 percent, speeds by 22 percent Crashes reduced by 18 percent, speeds by 14 percent |
|
Conclusions, Recommendations, Best Practices, Design Implications, or Design Guidelines
- There is evidence that crash risk is lowest near the average speed of traffic and increases for vehicles traveling much faster or slower than
average.
- Despite the large number of references concerning traffic calming, very few reports include the results of a systematic evaluation. In many
cases, traffic volume and speed are reduced. As a result of the traffic diversion, crashes may be migrating to other roads.
- More research is needed to assess the systemwide impacts and permit comparisons to be made among individual and combinations of traffic-calming
measures.
|
| General Comments None |
3.4 PEDESTRIANS AND BICYCLES
This subsection contains reviews for the Pedestrians and Bicycles topic.
| Title Passive Pedestrian Detection at Unsignalized Crossings
(Transportation Research Record, 1636, pp. 96-103) |
Funding Agency and Contact Address DKS Associates
921 S.W. Washington Street, Suite 612
Portland, OR 97205-3500 COTR: Not Specified |
| Authors Beckwith, D.M., and Hunter-Zaworski, K.M. |
| Publication Date 1997 |
Number of Pages 26 |
| Document Web Site None |
| Source Type Field Test |
| Driving Conditions Normal |
Vehicle Platforms Not Specified |
| Objective To evaluate the use of passive pedestrian detection sensors at unsignalized crossings. |
| General Approach This report includes a discussion of a project conducted by the City of Portland, OR, to evaluate
available sensor technologies for passive pedestrian detection, design of a crossing to utilize these sensor technologies, and a preliminary evaluation of
how well the sensors operate once installed at the crossing. |
| Methods Existing Technologies Research:
- Literature was reviewed and telephone interviews with sensor manufactures were conducted.
Preliminary (Short-Term) Testing:
- The objective was to test the initial group of sensors identified as possible candidates to determine if the detectors could detect pedestrians,
what types of detection zones could be expected, location requirements, and if there were an excessive number of false calls.
- A location that showed a high level of pedestrian traffic adjacent to a bus stop was chosen to conduct the preliminary testing of each sensor.
- Each sensor was mounted on a pedestrian signal and positioned to detect pedestrian traffic. The sensors were then connected to a type 170 controller
at the location. The controller cabinet was retrofitted with two lights mounted on top that lit up each time a pedestrian entered the detection zone of
the sensor.
- Each intersection chosen was equipped with video cameras and a video cassette recorder that allowed formonitoring of the sensors over extended
periods without having an observer present at all times.
Secondary (Long-Term) Testing:
- Based on the preliminary testing, the infrared sensor was chosen for monitoring the landing areas of the crossing and the Doppler radar was
chosen for monitoring the area within the crossing itself.
- The sensors actuate yellow beacons placed above reflective yellow pedestrian crossing signs suspended above the crossing. A four-sensor
crossing was used that consisted of two passive infrared (1 and 4) and two Doppler radar (2 and 3) sensors.
|
| Key Terms Pedestrian Crossing, Sensor Technologies, Passive Pedestrian Detection |
| Key Results Summary of Existing Technologies:
- Literature on passive pedestrian detection consists of limited articles on the following techniques: PUFFIN (Pedestrian User Friendly Intelligent
Signals) and PUSSYCAT (Pedestrian Urban Safety System and Comfort at Traffic Signals). These crossings use a combination of devices such as
piezometric pads and Doppler radar or passive infrared sensors in detecting the presence of pedestrians in Great Britain and the Netherlands.
- Five types of technologies that have been used in detection systems and could possibly be used for passive pedestrian detection: Passive
infrared (PIR), ultrasonic, Doppler radar, video imaging, and pieozometric.
- Of the potential technologies reviewed, the following technologies were selected for the project: Passive infrared, microwave radar,
and two ultrasonic sensors.
Preliminary Test Results:
- Of the detectors chosen, three were tested. Theseincluded passive infrared, Doppler radar, and one ultrasonic sensor.
- The infrared sensor had a very good detection rate and was versatile regarding sensor position. This allows the detector to be installed in
many different types of applications with minimum upgrading required to existing facilities and also low installation time and cost.
- The Doppler radar sensor was the only sensor that effectively detected pedestrians at a distance of 9.1 m (30 ft) or greater and had no maximum
operating angles. It also had a detection zone that was wide enough to cover the width of a standard crossing. Therefore, only one or two sensors is
needed to effectively monitor a crossing,keeping installation time and cost at a minimum.
Secondary Test Results:
- Five items were recorded from the location: (1) weather conditions; (2) date; (3) time of day; (4) detection reliability (each item was observed
to see whether it false detected (F) with no pedestrian present, detected a pedestrian with no problems (D), intermittently detected a pedestrian
(I), or lost detection of a pedestrian (L)); and system shutdown time.
- Of the 60 crossings observed, there were eight intermittent (I) detections with pedestrians present in the Doppler radar zones and one in the
passive infrared zones. At no time during any of the observed crossings were pedetrians not detected or caught within the crossing when the system
shut down.
- On the average, beacons would remain activated after the pedestrian left the crossing for 32 s. The maximum time recorded for beacons remaining
on was 125 s, with a minimum time of 6 s.
- During heavy rainfall, if the passive pedestrian detection system had been activated by a
pedestrian, the Doppler radar sensors would remain active, keeping beacons illuminated.
|
Conclusions, Recommendations, Best Practices, Design Implications, or Design Guidelines
- Through continued research, it is anticipated that the safety of unsignalized pedestrian crossings can be facilitated by using passive pedestrian
detection systems.
- The infrared and Doppler radar sensors that passed the preliminary testing discussed in this report have shown encouraging initial secondary test
results.
|
| General Comments None |
| Title Pedestrian Safety in Australia (FHWA-RD-99-093) |
Funding Agency and Contact Address Federal Highway Administration
6300 Georgetown Pike
McLean, VA 22101-2296 COTR: Carol Tan Esse |
| Authors Cairney, P. |
| Publication Date December 1999 |
Number of Pages 40 |
| Document Web Site http://www.tfhrc.gov/safety/intersect.htm |
| Source Type Literature Review |
| Driving Conditions Normal |
Vehicle Platforms Not Specified |
| Objective This report was one in a series of pedestrian safety synthesis reports prepared for FHWA to document pedestrian
safety in other countries. |
| General Approach This report provides a summary of pedestrian crash experience; an overview of crash countermeasures and
safety programs; and information on various topics related to pedestrian safety, including pedestrian facilities, traffic-calming measures, innovative
devices, education considerations, and enforcement and regulation. |
| Methods There are three basic source documents used for information on signs and markings for pedestrian facilities,
provision and design of pedestrian facilities, and proposed legislative changes. The following is a list of the three source documents:
- The Australian Standard Manual on Uniform Traffic Control Devices.
- Austroads Guide to Traffic Engineering Practice.
- Australian Road Rules (draft).
|
| Key Terms Australia, Pedestrian Crossings, Local Area Traffic Management, Pedestrian Safety, Pedestrian Signals |
| Key Results Sidewalks:
- A general minimum width of 1.2 m (4 ft) is specified for sidewalks. Wider paths are called for if pedestrian volumes are large, or if provision
is required to be made for wheelchairs, or if the facility is to be shared with cyclists.
Midblock Crossings:
-
Pelican crossings: These crossings are similar to midblock pedestrian signals, except that during the pedestrian clearance phase, the
display facing the motorists changes to a flashing yellow, indicating that vehicles may proceed across the crossing; however, they are required
to give way to pedestrians.
- PUFFIN crossings: These crossings use infrared sensors to detect the presence of pedestrians and monitor their progress across the
crossing. Trials have recently been held.
Provision for the Disabled Pedestrian:
- Specific ways to provide for disabled people are listed in the Austroads Guide to Traffic
Engineering Practice, Part 13, and include: Width of footpaths to accommodate wheelchairs, need for obstruction-free paths, placement of gratings
and manhole covers, treatment of ramps and curb ramps, installation of textured paving at waiting areas to provide tactile cues for the visually
impaired, loops to detect wheelchairs and allow longer pedestrian green times at signalized crossings, provision of information on routes used by
the visually impaired, and signage of facilities and routes for the disabled.
School Zone Safety:
- School zone safety is generally addressed by the provision of warning signs to indicate a school zone, and the provision of pedestrian-operated
traffic signals or children’s crossings, depending on pedestrian and vehicle flows. They may be enhanced by the provision of curb extensions
(bulbouts).
Traffic Calming for Pedestrians:
- Local Area Traffic Management (LATM): LATM has been widely adopted in Australia over the last20 years. LATM aims to effect changes
by altering the physical environment rather than by regulations and their enforcement.
- Effects of humps and raised platforms: The results from a study where pedestrian ramps were installed along a busy shopping street
showed that unjust crashes fell from 18 per year to 3 per year, pedestrian delay was reduced, and traffic flow and speed were also reduced. Curb
extensions appear to have been relatively successful. Curb extensions on their own produced an adjusted reduction of 27 percent, and curb
extensions at existing pedestrian crossings produced an adjusted rate showing a 44 percent reduction.
- Roundabouts: The splitter islands on the approaches to the roundabout give pedestrians the opportunity to make staged crossings as does
a median or pedestrian refuge. Although roundabouts are recognized as a treatment that is effective in reducing the severity of crashes, there
does not appear to be Australian data on their effect on pedestrian crashes.
Innovative Devices:
- Infrared sensors: Research indicated that a 40 percent reduction in vehicle delays was found with infrared sensors. In addition, there
was no increase in red-light running or other driver behaviors that might adversely affect safety. There was an increase in pedestrian compliance
with signals. There was a significant reduction in the percentage of pedestrians starting to cross before the green (10 percent).
|
Conclusions, Recommendations, Best Practices, Design Implications, or Design Guidelines
- PUFFIN crossings with infrared detectors seem promising.
- Pelican crossings are likely to find ready application, and having them set up for double-cycle operations appear to offer benefits.
- Australia was particularly innovative in developing the "Safe Routes to School" program, which integrates education, route selection,
and engineering treatments to increase pupil safety.
- Also in development is the "Walk With Care" program designed for the elderly.
|
| General Comments None |
| Title
A Review of Pedestrian Safety Research in the United States and Abroad (FHWA-RD-03-042) |
Funding Agency and Contact Address
Office of Safety Research
and Development
Federal Highway Administration
6300 Georgetown Pike
McLean, VA 22101-2296 COTR: Carol Tan Esse and Ann Do |
| Authors Campbell, B.J., Zegeer, C.V., Huang, H.H., and Cynecki, M.J. |
| Publication Date January 2004 |
Number of Pages 150 |
| Document Web Site https://www.fhwa.dot.gov/environment/bikeped/pedbiketrb2005.htm |
| Source Type Literature Review |
| Driving Conditions Normal |
Vehicle Platforms All |
| Objective To provide an overview of research studies on pedestrian safety, including the details of pedestrian crash
characteristics, measures of pedestrian exposure and hazard, and specific roadway improvements and their effects on pedestrian safety. |
| General Approach This report is an update resulting from two earlier reports. The most recent was Synthesis of Safety
Research: Pedestrians , by C.V. Zegeer (FHWA-SA-91-034). The earlier work was chapter 16, "Pedestrian Ways," by R.C. Pfefer, A. Sorton, J.
Fegan, and M.J. Rosenbaum, which was published by FHWA in Synthesis of Safety Research Related to Traffic Control and Roadway Elements. This
updated report includes results from numerous studies, both foreign and domestic. |
Methods
- Readers will find the details of pedestrian crash characteristics, measures of pedestrian exposure and hazards, and specific roadway features
and their effects on pedestrian safety.
- Such features include crosswalks and alternative crossing treatments, signalization, signage, pedestrian refuge islands, provisions for
pedestrians with disabilities, bus stop location, school crossing measures, reflectorization and conspicuity, grade-separated crossings,
traffic-calming measures, and sidewalks and paths.
- Pedestrian educational and enforcement programs are also discussed.
|
| Key Terms Pedestrians, Safety Research, Crashes, Countermeasures, Education, Enforcement |
Key Results
- Fatal pedestrian crashes tend to occur during nighttime hours.
- Pedestrian crashes are more frequent on Friday and Saturday and less frequent on Sunday.
- The largest percentage of pedestrian fatalities falls into the 25-to-44 age category.
- Alcohol is an important factor in pedestrian crashes. A North Carolina study showed that between 42 and 61 percent of fatally injured pedestrians
had blood alcohol concentration (BAC) levels of 0.10 or greater.
- Overall, 74 percent of pedestrian crashes occur where there is no traffic control, 7 percent where there is a stop sign, and 17 percent in the
presence of a traffic signal.
- Most pedestrian crashes occur where speed limits are low or moderate.
- Although most pedestrian crashes occur in urban areas, 60 percent of all crashes in urban areas do not occur at intersections. This compares
to 75 percent of child pedestrian crashes that occur not at an intersection (see figure).
Figure A. Pedestrian crashes (fatal and nonfatal) by age and intersection vs. nonintersection (Source: General Estimates System, NHTSA, 1990). |
Conclusions, Recommendations, Best Practices, Design Implications, or Design Guidelines
- More substantial improvements are recommended to provide for safer pedestrian crossings, such as adding traffic signals (with pedestrian signals)
when warranted, providing raised medians, installing speedreduction measures, and/or others.
- Providing raised medians on multilane roads can substantially reduce pedestrian crash risk.
- There is evidence that substantially improved nighttime lighting can enhance pedestrian safety.
- Allowing vehicles to make a right turn on red (RTOR) maneuver appears to result in a small, but clear, safety problem for pedestrians.
Countermeasures that have been effective in reducing pedestrian risks related to RTOR include illuminated No Turn on Red (NTOR) signs, offset stop
bars, variations in NTOR signs, and others.
- Curb medians provide a safer environment for pedestrians compared with two-way, left-turn lanes
(TWLTLs), while undivided highways have the highest crash risk for pedestrians in TWLTL settings.
- Numerous treatments exist to address the needs of pedestrians with disabilities, such as textured pavements, audible and vibrating pedestrian
signals, larger signs and pedestrian signals, wheelchair ramps, and others.
- Careful placement of bus stops can affect pedestrian safety. Use of bus stops on the far side of an intersection and at locations with good
sight distance and alignment is important.
- Overpasses and underpasses can substantially improve safety for pedestrians who need to cross freeways or busy arterial streets. However, such
facilities must be carefully planned and designed to encourage pedestrians to use the facilities and not continue to cross at street level.
- Traffic-calming measures such as street closures, speed humps, chicanes, traffic curbs, diverters, and others are in use in various U.S. cities.
Many of these measures have been found to effectively
improve safety forpedestrians and/or traffic as a whole.
|
| General Comments None |
| Title Intelligent Traffic Signals for Pedestrians: Evaluation of Trials in Three Counties (Transportation Research
Record Part C, 6, pp. 213-220) |
Funding Agency and Contact Address Institute for Transport Studies
University of Leeds
Leeds LS2 9JT, UK COTR: Not Specified |
| Authors Carsten, O.M.J., Sherborne, D.J., and Rothengatter, J.A. |
| Publication Date 1998 |
Number of Pages 17 |
| Document Web Site None |
| Source Type Field Test |
| Driving Conditions Normal |
Vehicle Platforms Not Specified |
| Objective To evaluate the effects of the Vulnerable Road User Traffic Observation and Optimization (VRU-TOO) traffic.signal
on pedestrian behavior and safety. |
| General Approach The DRIVE II project VRU-TOO carried out trials of innovative pedestrian signalized crossings that were
designed to be more responsive to pedestrians’ needs and thereby improve pedestrian safety and comfort. These advanced crossings were installed at
sites in three European countries and a comprehensive evaluation of the impacts was carried out, with a particular emphasis on changes in pedestrian
behavior and safety. |
Methods
- The generic VRU-TOO system: Microwave detectors were mounted on traffic signals to register the approach of pedestrians.
Location Sites Studied:
- Leeds, England: Three crossings along one quadrant of the new one-way loop road that encircles the city center were fitted with the
VRU-TOO system.
- Porto, Portugal: The crossing was on a major east-west arterial, linking the city center with the coastal industrial zone.
- Elefsina, Greece: The location was a crossroad in the town center on what had been the main Athens-to-Corinth highway, prior to the
building of a bypass.
Evaluation:
- For all locations except Elefsina, a comprehensive evaluation was carried out covering pedestrian safety, comfort and behavior, and the side
effects on vehicle traffic.
- In Elefsina, a full evaluation was only carried out for the western crossing (because of the availability of equipmentand possible video
locations).
- The main criterion evaluated was pedestrian/vehicle conflicts, which were counted by observers.
- Other criteria evaluated included the following: Percentage of pedestrians arriving on red who violated the red light, especially the percentage
violating red when vehicle traffic had a green, and the number of encounters between pedestrians and vehicles.
|
| Key Terms Pedestrians, Pedestrian Safety, Pedestrian Crossings, Intelligent Transport System |
| Key Results Safety:
- When the three sites in Leeds are combined, the total number of conflicts observed was 55 before implementation and 45 after implementation. This
change is significant at the 0.10 level, but not at the 0.05 level (p = 0.08, one-tailed).
- In Porto, the number of conflicts in the "before" study was 133, and the number in the "after" study was 130, so the overall
number of conflicts did not change significantly.
- The overall number of conflicts in Elefsina changed significantly between the before and after periods from 82 to 64 (significant at the p
< 0.05 level, one-tailed).
Comfort:
- In Leeds, the expected delay was reduced at all three sites, with a particularly large reduction at site 3.
- In Porto, the expected delay did not change at crossing 1, whereas at crossing 2, it was considerably reduced from a mean of 37 s before to one
of 29 s after.
Effects on Vehicle Traffic:
- There was no significant change in vehicle flow through the relevant sector of the one-way city center loopin Leeds between the before and after
periods. Average journey time increased from 2.6 minutes (min) in the "before" survey to 3.8 min in the "after" survey,
indicating some negative effects on vehicle movement.
- In Porto, total hourly vehicle flow through the junction decreased by 13 percent between the before and after observations. Mean journey time
increased by 4 percent eastbound along the main road, by 3 percent westbound along the main road, and by 15 percent along the side streets. In no
case was the increase in journey time statistically significant. There were no significant changes in queue lengths.
- In Elefsina, queue lengths were observed. In the westbound direction, the mean number of cars queuing decreased from 6.7 in the before period to
5.9 in the after period. The number of cycles in which no passenger car was observed to queue increased from 23 to 40. In the opposite direction,
the mean number of cars queuing decreased from 3.7 to 3.3, and the number of cycles in which no passenger car waited increased from 26 to 65.
|
Conclusions, Recommendations, Best Practices, Design Implications, or Design Guidelines
- While there were important differences in the impacts at the various sites, partly reflecting differences in system implementation, there were
general gains in safety and comfort for pedestrians.
- These improvements were obtained without major side effects on vehicle travel.
- Further experimentation with signal timings in order to obtain additional benefits in terms of pedestrian safety and comfort, as well as the
development of more extensive applications covering urban corridors or areas, is encouraged.
|
| General Comments None |
| Title
Bicycle Safety-Related Research Synthesis(FHWA-RD-94-062) |
Funding Agency and Contact Address Office of Safety and Traffic Operations
Research and Development
Federal Highway Administration
6300 Georgetown Pike
McLean, VA 22101-2296 COTR: Carol H. Tan |
| Authors Clarke, A., and Tracy, L. |
| Publication Date April 1995 |
Number of Pages 152 |
| Document Web Site None |
| Source Type Literature Review |
| Driving Conditions Normal |
Vehicle Platforms All |
Objective
- Summarize bicycle safety-related research and applied research since 1981 in the United States.
- The report has been developed for the benefit of researchers and practitioners in the field.
|
| General Approach This report reviews research into current levels of bicycle use, potential levels of use, and the benefits
bicycling can bring to society; identifies the scale and nature of crashes related to bicycle use; discusses engineering countermeasures that have been
tested to prevent crashes; brings readers up to date with current practices related to bicycle facility selection and design; highlights surface
irregularities that endanger bicyclists, as well as countermeasures to correct them; introduces readers to traffic-calming techniques; reviews bicyclists
’ equipment safety and helmet use; and reviews educational programs and enforcement programs to improve safety. |
| Methods As part of the development of this report, case studies were commissioned from the Netherlands, Great Britain,
Australia, Japan, Germany, and Denmark to add international experience and perspective. |
| Key Terms
Bicycle, Bicycle Safety, Bicycle Facilities, Bicycle Helmets, Bicycle Use, Highway Design, Traffic Calming
|
| Key Results Section 1. Bicycling in the United States in the 1990s:
- This section discusses increasing bicycle sales and use, the potential for bicycling in the United States, factors influencing bicycle mode
choice, costs and benefits associated with bicycling, and international comparisons.
Section 2. Bicycle Crash Experience:
- This section describes bicycle crashes in general, bicycle/motor vehicle crashes, crash causes, bicyclist behavior, motorist behavior, alcohol
involvement, bicyclist statistics, economic impacts of bicycle/motor vehicle crashes, nonmotor-vehicle-related bicycle crashes, and bicycling
injuries.
Section 3. Intersection Countermeasures:
- Stop signs: Where the potential exists to develop trails and bicycle boulevards, the number of stop signs can be diminished. Where this
cannot be done, education and consistent enforcement of bicyclist violations are likely to be the best solution to reducing bicycle/motor vehicle
crashes at intersections controlled by stop signs.
- Traffic signals:Bicycle-sensitive traffic signal detectors are available and are being used quite extensively in California and other
States. There are appropriate and effective methods of guiding bicyclists to the most sensitive part of older loop detectors to aid in their
detection. An appropriate formula for determining signal timing has been developed.
- Right turn on red (RTOR): RTOR laws have had a negative impact on the safety of bicyclists. At intersections with high crash records
and/or significant levels of bicycle use, RTOR prohibitions should be considered.
- Advanced stop lines:Advanced stop lines and other innovative intersection designs and road markings have not been used in the United
States despite their growing use in other countries. They should be tested at various locations to determine their applicability.
- Roundabouts: Bicycle safety is not well served by the use of large roundabouts designed to increase vehicle speed or capacity through
intersections. Traffic circles, however, show great potential for calming traffic in residential areas and in reducing the speed of vehicles.
Section 4. Bicycle Accommodations and Facilities:
- Facility selection: The selection of a facility may depend on vehicular and bicycle traffic characteristics, adjacent land use,
expedited growth patterns, and the type of bicyclist being served.
- Designing and selecting facilities: Facility types available to the traffic engineer and planner include: Shoulder, wide curb lane,
bicycle route, bicycle lane, bicycle path, shared lane, bicycle and bus lane, bicycle boulevard, and traffic calming.
Section 5. Surface Quality:
- This section discusses railroad crossings, drainage grate surface materials, maintenance, and other issues.
Section 6. Traffic Calming:
- Potential benefits: Both the incidence and severity of crashes involving bicyclists have been reduced, primarily through the reduction
in speed of motor vehicles through traffic-calming measures. Bicycle use has also been increased through traffic-calming measures.
- U.S. experience:Detailed manuals are available on traffic-calming techniques. The city of Seattle, WA, has pioneered the use of small
traffic circles in residential streets. Many cities have experimented with speed hump designs and installation. The most comprehensive program of
traffic calming is now underway in Portland, OR.
- Traffic-calming issues for the U.S.: The following are three primary obstacles to the widespread development of
traffic-calming techniques in the U.S.: (1) determining applicability, (2) legality, and (3) public acceptance.
Section 7. Safety Equipment:
- This section discusses various types of bicycling equipment and legislation.
Section 8. Education:
- This section describes program and materials development, types of programs, evaluation and implementation of programs, and program effectiveness.
Section 9. Enforcement and Regulations:
- This section discusses the lack of research in this area.
|
Conclusions, Recommendations, Best Practices, Design Implications, or Design Guidelines
- In the past 3 years, a significant amount of research and practical experience has been devoted to the area of facility selection (as opposed to
facility design) and that is where more work is still required in the near future. Facility design issues remain in certain areas, particularly at
intersections.
- One of the areas with the greatest potential in the United States is the application of traffic-calming techniques in a wide variety of
situations, particularly in urban and suburban locations. While a number of the techniques of traffic calming have already been employed in U.S.
cities, such as Seattle, WA, and Portland, OR, many more remain to be tested. In particular, the application of traffic-claming measures over wider
areas needs to be evaluated.
- The greatest need in the important areas of education and enforcement is for consistent implementation of programs. Research is needed in
determining how to more successfully implement existing programs, or how to get the message across to bicyclists and motorists in a way that can
be realistically implemented.
|
| General Comments None |
| Title
Analysis of Pedalcyclist Crashes (DOT-HS-809-572)
|
Funding Agency and Contact Address National Highway Traffic Safety
Administration
400 Seventh Street, S.W.
Washington, DC 20590 COTR: Not Specified |
| Authors daSilva M.P., Campbell, B.N., Smith, J.D., and Najm, W.G. |
| Publication Date November 2002 |
Number of Pages 68 |
| Document Web Site http://www-nrd.nhtsa.dot.gov/departments/nrd-12/pubs_rev.html |
| Source Type Crash/Demographic Statistical Analysis |
| Driving Conditions Normal |
Vehicle Platforms All |
| Objective To analyze the problem of pedalcyclist crashes in the United States in order to support the development and
assessment of effective pedalcyclist crash avoidance systems as part of the U.S. DOT’s Intelligent Vehicle Initiative. |
| General Approach
This study describes precrash scenarios most prevalent in pedalcyclist crashes by identifying vehicle maneuvers and pedalcyclist action combinations.
|
| Methods The analysis was conducted using a 4-year data set from the 1995–1998 National Automotive Sampling
System/General Estimates System (NASS/GES) and Fatality Analysis Reporting System (FARS) crash databases of the National Highway Traffic Safety
Administration. |
| Key Terms Pedalcyclist, Crashes, Crash-Imminent Scenarios, Test Scenarios, Intelligent Vehicle Initiative. |
Key Results
- In 1998, about 58,000 pedalcyclist crashes, or 0.9 percent of all police-reported crashes, occurred in the United States, resulting in 760 fatal
crashes, or 2.1 percent of all fatal motor vehicle crashes that year.
- Pedalcyclist crashes were broken down into eight precrash scenarios.
- Scenario 1: Vehicle traveling straight on a crossing path with the pedalcyclist (40.2 percent).
- Scenario 2: Vehicle traveling straight on a parallel path with the pedalcyclist (15.4 percent).
- Scenario 3: Vehicle turning right on a crossing path with the pedalcyclist (9.7 percent).
- Scenario 4: Vehicle turning right on a parallel path with the pedalcyclist (7.0 percent).
- Scenario 5: Vehicle turning left on a parallel path with the pedalcyclist (7.0 percent).
- Scenario 6: Vehicle starting in traffic lane on a crossing path with the pedalcyclist (3.0 percent).
- Scenario 7: Vehicle turning left on a crossing path with the pedalcyclist (2.9 percent).
- Scenario 8: Other (14.8 percent).
- Most crashes involving pedalcyclists occurred on straight, nonhillcrest roadways (94 percent).
- Almost 75 percent of the crashes occurred on roadways with speed limits between 40 and 56 km/h (25 and 35 mi/h).
- Nearly 12 percent of the drivers and more than 50 percent of the pedalcyclists were under age 20.
- Younger pedalcyclists, especially those 10 to 14 years old, were most susceptible to pedalcyclist crashes, accounting for nearly 27 percent of
all pedalcyclists involved in pedalcyclist crashes (see figure).
- Seventy-two percent of the pedalcyclist crash population fell into the 5- to 29-year-old age range.
- The highest frequency of incapacitating and fatal injuries occurred in cases where the vehicle was traveling straight on a parallel path with
the pedalcyclist (scenario 2).
- The fewest injuries were reported in scenario 6, which involves a vehicle starting in a traffic lane on a crossing path with the pedalcyclist.
- A relatively high percentage of drivers reported vision obscurity in precrash scenario 5, where the vehicle was turning left while on a
parallel path with the pedalcyclist, and scenario 6, where the vehicle was starting in the traffic lane on a crossing path with the pedalcyclist.
|
|
Figure A. Pedalcyclist age distribution for aggregate crash scenario total and U.S. population distribution (based on
1995–1998 GES).
|
Conclusions, Recommendations, Best Practices, Design Implications, or Design Guidelines
- Bicycle-riding exposure data could provide some further insight as to what age groups are most susceptible to the pedalcyclist crash type.
- A significant number of pedalcyclist-related crashes occurred at nighttime. Information on what types of clothes the pedalcyclists were wearing could
provide further insight into the development of vehicle-based and vehicleinfrastructure cooperative countermeasure systems.
|
| General Comments None |
| Title Analysis of Pedestrian Crashes (DOT-HS-809-585) |
Funding Agency and Contact Address National Highway Traffic Safety
Administration
400 Seventh Street, S.W.
Washington, DC 20590 COTR: Not Specified |
| Authors daSilva, M.P., Smith, J.D., and Najm, W.G. |
| Publication Date April 2003 |
Number of Pages 90 |
| Document Web Site http://www-nrd.nhtsa.dot.gov/departments/nrd-12/pubs_rev.html |
| Source Type Crash/Demographic Statistical Analysis |
| Driving Conditions Normal |
Vehicle Platforms All |
| Objective To analyze the problem of pedestrian crashes in the United States in order to support the development and
assessment of effective pedestrian crash avoidance systems as part of the U.S. DOT’s Intelligent Vehicle Initiative. |
| General Approach This report identifies prevalent precrash scenarios, describes their physical setting, and provides
statistics on driver/pedestrian ages and pedestrian injury severity per scenario based on General Estimates System (GES) and Fatality Analysis Reporting
System (FARS) data from 1995 through 1998. |
| Methods The analysis was conducted using a 4-year data set from the 1995-1998 National Automotive Sampling System(NASS)
GES and FARS crash databases of the National Highway Traffic Safety Administration. |
| Key Terms Pedestrian, Crashes, Crash-Imminent Scenarios, Test Scenarios, Intelligent Vehicle Initiative |
Key Results
- In 1998, 70,000 pedestrian crashes, or 1.1 percent of all police-reported crashes, occurred in the United States, resulting in 5,294 fatal
crashes or 14.3 percent of all fatal motor vehicle crashes that year.
- The following 10 specific pedestrian precrash scenarios were obtained by correlating the eight basic precrash scenarios with information about
the crash’s relationship to the junction (percentages shown refer to the frequency of each scenario relative to the size of all pedestrian
crashes):
- Scenario 1: Vehicle is going straight and pedestrian is crossing the roadway at nonjunction (25.9 percent).
- Scenario 2: Vehicle is going straight and pedestrian is crossing the roadway at intersection (18.5 percent).
- Scenario 3: Vehicle is going straight and pedestrian is darting onto the roadway at nonjunction (16.0 percent).
- Scenario 4: Vehicle is turning left and pedestrian is crossing the roadway at intersection (8.6 percent).
- Scenario 5: Vehicle is turning right and pedestrian is crossing the roadway at intersection (6.2 percent).
- Scenario 6: Vehicle is going straight and pedestrian is walking along the roadway at nonjunction (3.7 percent).
- Scenario 7: Vehicle is going straight and pedestrian is darting onto the roadway at intersection (2.5 percent).
- Scenario 8: Vehicle is backing up (2.5 percent).
- Scenario 9: Vehicle is going straight and pedestrian is not in the roadway at nonjunction (1.2 percent).
- Scenario 10: Vehicle is going straight and pedestrian is playing or working in the roadway at nonjunction (1.2 percent).
- The analysis of crash contributing factors in the 10 specific scenarios revealed that a very high percentage of drivers reported vision obscurity
in precrash scenarios where the pedestrian darted onto the roadway (scenarios 3 and 7).
- Alcohol involvement was particularly high for drivers in scenarios where the pedestrian was walking along the roadway at a nonjunction
(scenarios 6 and 9).
- Conversely, a high percentage of drunk pedestrians were reported in scenarios 1, 2, and 6, where a pedestrian was struck either crossing or
walking along the roadway.
- Almost 60 percent of pedestrian crashes in which the pedestrian was walking along the roadway at a nonjunction occurred at nighttime (scenario
6).
- Younger pedestrians, especially those ages 5 to 9, were the most susceptible to vehicle/pedestrian crashes, accounting for nearly 14 percent of
all pedestrians involved (see figure).
- Pedestrian injuries tended to be more severe away from junctions because of the higher speeds involved.
|
|
Figure A. Crash-involved pedestrian age distribution and overall age distribution of U.S. population (based on 1995–1998 GES).
|
Conclusions, Recommendations, Best Practices, Design Implications, or Design Guidelines
- Data on walking exposure could provide further insight as to what age groups are most susceptible to the pedestrian crash type.
- A significant number of pedestrian-related crashes occurred at nighttime. Information on what types of clothes the pedestrians were wearing
could provide further insight into the development of vehicle-based and vehicle-infrastructure cooperative countermeasure systems.
|
| General Comments None |
| Title Research, Development, and Implementation of Pedestrian Safety Facilities in the United Kingdom (FHWA-RD-99-089)
|
Funding Agency and Contact Address Federal Highway Administration
6300 Georgetown Pike
McLean VA 22101-2296 COTR: Not Specified |
| Authors Davis, D.G. |
| Publication Date December 1999 |
Number of Pages 47 |
| Document Web Site http://www.tfhrc.gov/safety/intersect.htm |
| Source Type Literature Review |
| Driving Conditions Normal |
Vehicle Platforms All |
Objective
- This report was one in a series of pedestrian safety synthesis reports prepared for FHWA to documentpedestrian safety in other countries.
- The aim of this report is to give an overview of the issues regarding research, development, andimplementation of pedestrian facilities in the
United Kingdom.
|
| General Approach This is a review of recent research on pedestrian safety carried out in the United Kingdom. A
comprehensive list of references is provided. The report covers many types of pedestrian facilities, the U.K. pedestrian safety record, and some education
and enforcement matters. The report cites an access document with adequate references to allow further investigation on specific areas, and some commentary
on research and implementation. |
| Methods This report has been compiled on the basis of the following:
- Literature search using the SilverPlatter CD-ROM database held at the Transport Research Laboratory library.
- Meeting of U.K. technical experts held at the Department of the Environment, Transport, and Regions (DETR).
- Consultation with various academicians and practitioners in local government.
- Review of relevant literature from a wide variety of sources, including literature search and material assembled over the past 5 years.
|
| Key Terms Pedestrians, Pelican Crossing , Zebra Crossing, PUFFIN Crossing, Traffic Calming, Tactile Pavement Surfaces
|
| Key Results
Overview of Crash Countermeasures and Safety Programs:
- Topics related to the safety of pedestrians, which have received new or increased DETR attention over the past 5 yers, include: Speed-reduction
publicity campaigns, traffic calming, 32-km/h (20-mi/h) zones, speed enforcement cameras, child pedestrian safety, and new forms of signal-controlled
pedestrian crossings.
- Pedestrian safety issues that have been highlighted or implemented by other safety interests, such as local highway authorities or nongovernmental
organizations, include: Lower speed limits, increased driver responsibility, safe routes to schools, road danger reduction, safety audit, urban
safety
management, and traffic reduction.
Pedestrian Crossings Without Signal Control (Crosswalks):
Zebra crossing: Over the past 10 years, many zebra crossings have been replaced by pelican crossings, and new crossings tend to be
pelicans rather than zebras. Broadly speaking, zebra crossings are considered inappropriate on high-speed or high-motor-traffic flow roads,
particularly multilane roads. The DETR guidance recommends that zebras should not be installed on roads where the 85th percentile speed
is greater than 56.35 km/h (35 mi/h). Pedestrian refuge island: Pedestrian refuges can provide a series of crossing points along a road where it would be impractical to
install zebras or pelicans at each crossing location. Overall, it seems that pedestrian refuges assist pedestrians to cross roads more easily, with
less delay and greater perceived safety. However, vehicle speeds are not necessarily reduced and pedestrian crashes may not be reduced if pedestrian
activity increases. There may also be adverse effects, such as parking problems and problems for pedalcyclists. Curb build-out: A study of an early scheme in Nottingham found a reduction in average pedestrian crashes from 4.7 per year to 1 per
year. As with pedestrian refuge islands, build-outs can cause concern to cyclists who are forced closer to motor vehicles. Flat-top road hump: These are generally successful in that they provide pedestrians with safer crossing locations that are easier
to use and reduce pedestrian delay.
Pedestrian Crossings With Signal Control:
- Pelican crossing:The installation of a pelican will not necessarily reduce pedestrian crashes. It may even result in an increase in
pedestrian crashes because of increased pedestrian activity or other factors. Studies have attempted to find relationships between crash rates and
levels of pedestrian and vehicle flow. A recent study, however, found no correlation.
- PUFFIN crossing: The PUFFIN crossing has been developed in response to the following shortcomings of the pelican: Inadequate time for
slow pedestrians to cross, the stressful and confusing nature of the flashing green man, unnecessary delays to vehicles, and excessive delays for
pedestrians.
- Toucan crossing: The toucan is designed for shared use by pedestrians and cyclists. There have been problems with the reliability of
the equipment; however, user response has been favorable.
School Zone Safety:
- Improving the safety of routes to school has typically involved a combination of traffic-calming techniques, provision of crossings, and
shared-use pedestrian and cyclist paths.
- Variable message signs have been tested in the vicinity of schools to warn drivers of excessive speed. Although these have shown some
speed-reduction effects, they are expensive and less effective compared to physical traffic-calming measures and, therefore, are generally
considered unsuitable.
|
Conclusions, Recommendations, Best Practices, Design Implications, or Design Guidelines
- The past 5 years have seen increased attention given to road safety issues in the United Kingdom. Developments of particular relevance to
pedestrians include a greater emphasis on reducing vehicle speeds in urban areas through physical, legal, and publicity measures, and on development
of PUFFIN crossings and new operating strategies such as Microprocessor Optimized Vehicle Actuation (MOVA).
- However, while specific facilities can affect safety at individual sites, improvements in overall safety for pedestrians require a comprehensive
road safety strategy that is fully integrated with land use and transport policy.
- Amendments to the construction and use regulations for motor vehicles, greater emphasis on driver responsibility toward pedestrians, and
reductions in traffic levels will also be needed to bring about further crash reductions and a perception that walking is becoming safer.
|
| General Comments None |
| Title Pedestrian Safety in Sweden (FHWA-RD-99-091) |
Funding Agency and Contact Address Federal Highway Administration
6300 Georgetown Pike
McLean, VA 22101-2296 COTR: Carol Tan Esse |
| Authors Ekman, L., and Hyden, C. |
| Publication Date December 1999 |
Number of Pages 37 |
| Document Web Site http://www.walkinginfo.org/rd/international.htm |
| Source Type Literature Review |
| Driving Conditions Normal |
Vehicle Platforms All |
| Objective This report was one in a series of pedestrian safety synthesis reports prepared for FHWA to document pedestrian
safety in other countries. |
| General Approach This report is a review of recent pedestrian safety research in Sweden, in particular, with some
attention to similar research in other Scandinavian countries. |
Methods
- Pedestrian safety: The report provides crash statistics from police reports, hospital records, and the Swedish Traffic Conflicts
Technique (TCT).
- Literature review: Previous research conducted in Sweden and other Scandinavian countries is reviewed in the following areas:
- Common pedestrian facilities: Zebra crossings, small roundabouts, traffic calming, and Project WAKCYNG.
- New pedestrian facilities: Detection of pedestrians at signal-controlled intersections, relevant warning systems, warning lights
mounted at the roadways, painted premarkings at zebra crossings in Stockholm, and ultraviolet light.
|
| Key Terms Pedestrians, Safety, Sweden, Walking, Cycling |
| Key Results Effects of Common Pedestrian Facilities:
- Zebra crossings: One study found that crossing at intersections where there are zebra markings seems to result in a higher risk for an
individual pedestrian than crossing at other intersections (see figure). This study concluded the following: The safety potential at signalized
intersections is not fully achieved; behavior adaptation or modification is the way to safety improvements or failure; and safety potential is
great at both zebra crossings and signalized intersections, since two-thirds of all pedestrians cross at these locations.
- Small roundabouts: If properly designed, small roundabouts work very well as a speed-reduction measure. The experience of rebuilding
a large number of intersections on arterial roads as small roundabouts in England showed that the number of crashes decreased by 30 to 40 percent.
At one intersection studied, the number of drivers that stopped or slowed down to let pedestrians pass increased from 27 to 50 percent.
Use of New Pedestrian Facilities:
- Detection of pedestrian at signal-controlled intersections: In a joint European study (Ekman and Draskozy, 1992), trials with microwave
detectors to trigger the traffic signal were carried out. The results indicate the following: It is possible to detect approaching pedestrians in a
reliable way, significant reductions in redlight violations can be achieved, and false detection was not a major problem.
- Relevant warning system: At one intersection, which encountered problems with low respect for an ordinary zebra crossing, a large
warning sign, activated by the presence of pedestrians, was installed. Theresults indicated a remarkable increase in the number of vehicles that
stopped for pedestrians to cross (from 12 percent before the sign was installed to 50 percent after installation).
- Warning lights mounted at the roadways: In one study, lamps similar to the type used on airport runways were mounted on the roadway at
two signal-controlled intersections to alert turning vehicles that crossing pedestrians had the right of way (Ekman, 1996). The results indicated
the following: Technically, the lamps worked well. At one of the intersections, a significant safety effect was found; at the other intersection,
the safety problem was so small that no major improvements in safety were possible. And the system could be further improved if pedestrians could
be detected.
|
|
Figure A. Crash rates for the three crossing types by age group.
|
Conclusions, Recommendations, Best Practices, Design Implications, or Design Guidelines
- The report states that even in Sweden, where attention has long been paid to pedestrian and bicyclist concerns, too much traffic planning is
addressed as if it were a vehicular issue only.
- If traffic cannot be separated, then consideration should be given in some areas to restricting vehicle speeds to 30 km/h.
- It is argued that future planning must better balance the competing needs of motor vehicle traffic, pedestrians, and cyclists.
|
| General Comments None |
| Title An Evaluation of Crosswalk Warning Systems: Effects on Pedestrian and Vehicle Behaviour (Transportation
Research Part F, 5, pp. 233-250) |
Funding Agency and Contact Address Transportation Research Institute
Technion – Israel Institute of
Technology
Technion City, Haifa 32000, Israel COTR: Not Specified |
| Authors Hakkert, A.S., Gitelman, V., and Ben-Shabat, E. |
| Publication Date 2002 |
Number of Pages 18 |
| Document Web Site none |
| Source Type Field Test |
| Driving Conditions Normal |
Vehicle Platforms Light Vehicles |
| Objective To evaluate the effects of a crosswalk warning system on pedestrian and vehicle behavior. |
| General Approach Two types of crosswalk warning systems were tested in a field experiment. The systems tested were the
Active Road Marking System for Road Safety (ARMS), a product of Dalmark Technology, Ltd, and Hercules, a modified product of Traffic System Corp. Each type
includes a pedestrian detection system, activated by sensors installed on low poles on both sides of the crosswalk, and a series of flashing warning light
units that are embedded in the pavement adjacent to a marked crossing. |
Methods
- Test sites: Four typical problematic locations of uncontrolled pedestrian crossings in urban areas were chosen.
- Before/after comparisons of the following behaviors were studied: Vehicle speeds, giving right of way to pedestrians, conflicts in
driver-pedestrian interactions, pedestrians crossing the road outside the crosswalk area, and pedestrians keeping to the safe crossing rules.
- Three rounds of field observations were carried out at each site: (1) baseline (before system installation), (2) several weeks after
installation, and (3) several months after installation.
- Five observers were involved in each round: Two were responsible for speed measurements (by means of a laser speed gun and also for traffic
counting), the third observed the drivers’ reactions each time a new pedestrian attempted to cross, the fourth recorded the actions of the
pedestrian, and the fifth counted the conflicts in the vehicle/pedestrian interactions and the number of pedestrians.
|
| Key Terms
Crosswalk Warning System, Pedestrian Safety |
Key Results
- The changes observed at the study sites were not uniform, which reflects the differences between the site conditions and, possibly, between the
system types studied.
- Both free speeds and the speeds near the crosswalks decreased after the system installation on sites 1 and 2, whereas on sites 3 and 4, a mixed
trend of changes was observed, and the speeds actually did not change. This suggests that the system can bring about a decrease of 2 to 5 km/h in
the average vehicle speeds in the crosswalk zone, but only at sites where the initial speeds are higher than 30 km/h.
- Overall, there was a positive change in giving way to a pedestrian at sites 1 through 3, while at site 4, the picture was unclear. At sites 1
through 3, the system brought about a doubling of the rate of giving way to a pedestrian who was beginning to cross, and this rate reached 40 percent
at sites 1 and 2.
- Across all the sites studied, the system diminished the rate of conflicts in the crosswalk area to a negligible, less than 1 percent level.
- It appears that the system encourages the pedestrians to cross the road at a legal crosswalk since a significant reduction in the number of
crossings outside the crosswalk area was observed at three out of four sites. This improvement was especially recognizable at site 1 where, before
system installation, about half of the pedestrians crossed the road outside the crosswalk area. Overall, the system seems to have the capability of
reducing this rate to about 10 percent, but not to neutralize the phenomenon completely.
- In general, the rate of stops before a crossing was and stayed at about 0.4 to 0.5, in the situation where no vehicle was oncoming, and varied
between 0.5 and 0.9, in the remainder of the cases.
|
| Conclusions, Recommendations, Best Practices, Design Implications, or Design Guidelines Under certain conditions, the
device can bring about a decrease of 2 to 5 km/h in average vehicle speeds near the crosswalk zone, an increase in the rate of giving way to pedestrians
(e.g., doubling the rate of giving way to a pedestrian who is beginning to cross to 40 percent), a significant reduction in vehicle/pedestrian conflicts in
the crosswalk zone (to a rate of < 1 percent), and a reduction in the number of pedestrians crossing outside the crosswalk area (up to 10 percent).
|
| General Comments None |
| Title Pedestrian Safety on Rural Highways (FHWA-SA-04-008) |
Funding Agency and Contact Address Office of Safety
Federal Highway Administration
400 Seventh Street, S.W.
Washington, DC 20590 COTR: D. Smith and T. Redmon |
| Authors Hall, J.W., Brogan, J.D., and Kondreddi, M. |
| Publication Date September 2004 |
Number of Pages 29 |
| Document Web Site https://www.fhwa.dot.gov/environment/bikeped/pedbiketrb2005.htm |
| Source Type Crash/Demographic Statistical Analysis |
| Driving Conditions Normal |
Vehicle Platforms All |
| Objective To identify the characteristics of rural pedestrian fatalities in 10 States with above-average rates of rural
pedestrian fatalities. |
| General Approach The project examined all rural pedestrian crashes in New Mexico for a 3-year period. The research
described in this paper identifies fatal pedestrian crash characteristics in a sample of rural States, evaluates all rural pedestrian crashes in one State,
and suggests potential safety engineering countermeasures. |
Methods
- The primary data source for this study of rural pedestrian collisions was the Fatality Analysis Reporting System (FARS) database administered
and maintained by NHTSA. Relevant data from the States’ own source documents, including police accident reports, State vehicle registration
files, State driver licensing files, State highway department data, vital statistics, death certificates, medical examiner reports, hospital medical
records, and emergency medical service reports, are coded on standard FARS forms.
- A second source of information used in this study was the New Mexico computerized crash record database, maintained by the University of New
Mexico’s Division of Government Research.
- Demographic and other statistical data were obtained from the Web sites maintained by the U.S. Census Bureau and others.
|
| Key Terms Crashes, FARS, New Mexico, Pedestrian, Rural Highways, Safety |
Key Results
- Overall, 90 percent of incidents occurred on tangent sections of roadway and 89 percent occurred on level roads.
- In the 10 study States, 38 percent of the rural fatal pedestrian crashes occurred on divided highways, with the remainder on undivided highways.
- Nearly 8 percent of the rural fatal pedestrian impacts took place on the shoulder, while virtually all of the rest took place on the roadway
itself (87 percent).
- More than 84 percent of all pedestrian rural fatalities did not occur at intersections.
- Nearly 90 percent of the rural fatal pedestrian crashes occurred on dry pavement. However, in Montana and Oregon, at least 15 percent occurred
on wet pavement. Snow or ice was present at more than 10 percent of the crashes in Colorado and Wyoming.
- The reported speed limits at the rural sites of pedestrian fatalities ranged from 80 to 121 km/h (50 to 75 mi/h). The speed limit range of 88
to 97 km/h (55 to 60 mi/h) accounted for 34 percent of the crash sites, and an additional 28 percent had speed limits of 104 km/h (65 mi/h) or more.
- According to the 2003 FARS data, there was no traffic control present at 85 percent of the crash sites.
- For the 10 study States, 28 percent of the crashes occurred between midnight and 6:00 a.m., 16 percent between 6:00 a.m. and noon, 10 percent
between noon and 6:00 p.m., and 46 percent between 6:00 p.m. and midnight.
- Overall, dark, unlighted conditions existed for 64 percent of the crashes; only 20 percent occurred during daylight hours (see table).
- For the rural fatal pedestrian crashes in the study States, 16 percent reportedly involved persons improperly crossing the roadway or
intersection, and another 7 percent involved failure to yield the right of way. Approximately 4 percent of the crashes were associated with a
previous crash nearby.
Table A. Light conditions at crash times.
| State |
Daylight
(percent) |
Dark
(percent) | Dark/Light
(percent) | Dawn
(percent) | Dusk
(percent) |
| AZ |
23.0 |
73.0 |
0.0 |
4.0 |
0.0 |
| CA |
19.7 |
71.8 |
5.6 |
2.9 |
0.0 |
| CO |
30.0 |
40.0 |
20.0 |
0.0 |
10.0 |
| FL | 23.3 |
54.6 |
18.0 |
0.0 |
4.4 |
| LA |
15.9 |
65.9 |
15.9 |
2.3 |
0.0 |
| MT | 20.0 |
40.0 |
20.0 |
10.0 |
10.0 |
| NM |
14.8 |
70.3 |
11.1 |
3.8 |
0.0 |
| OR |
30.0 |
40.0 |
30.0 |
10.0 |
10.0 |
| TX |
15.7 |
74.4 |
7.4 |
2.5 |
0.0 |
| WY |
25.0 |
50.0 |
0.0 |
25.0 |
0.0 |
| Total |
20.0 |
64.4 |
11.9 |
2.1 |
1.6 |
|
Conclusions, Recommendations, Best Practices, Design Implications, or Design Guidelines
- The critical period for rural pedestrians in the 10 study States was between 6 p.m. and 6 a.m., which accounted for 73 percent of the fatalities.
- More than 38 percent of the fatalities occurred on divided highways. Posted speed limits and, in turn, actual vehicle speeds are higher on
rural highways, especially when they are divided. The speed limit at 63 percent of the sites was 88 km/h (55 mi/h) or higher.
- Weather and adverse roadway surface conditions appear to play a minor role, if any.
- Improved visibility and selected application of pedestrian amenities such as walkways, crosswalks, and warning signs appear to have the best
potential for enhancing rural pedestrian safety.
- The excessive incidence of alcohol-influenced pedestrians deserves additional attention.
|
| General Comments None |
| Title PEDSAFE: Pedestrian Safety Guide and Countermeasure Selection System (FHWA-SA-04-003) |
Funding Agency and Contact Address Office of Safety
Federal Highway Administration
400 Seventh Street, S.W.
Washington, DC 20590 COTR: John Fegan |
| Authors Harkley, D.L., and Zegeer, C.V. |
| Publication Date September 2004 |
Number of Pages 336 |
| Document Web Site http://www.walkinginfo.org/pedsafe/pedsafe_downloads.cfm |
| Source Type Design Guidelines, Software Tool |
| Driving Conditions Normal |
Vehicle Platforms All |
Objective
- This report is the next generation of the Pedestrian Facilities User Guide: Providing Safety and Mobility (Zegeer, et al. 2001). It
includes an update of 47 engineering countermeasures or treatments, along with education and enforcement programs, that may be implemented to
improve pedestrian safety and mobility.
- The purpose of the PEDSAFE software system is to provide the most applicable information for identifying safety and mobility needs and
improving conditions for pedestrians within the public right of way.
|
| General Approach See Methods. |
Methods
- Forty-seven unique engineering countermeasures or treatments are provided that may be implemented to improve pedestrian safety and mobility.
Included for each of the 47 treatments are a general description, purpose or objective, considerations for implementation, and estimated costs.
- The guide also includes two matrices that relate the 47 treatments (plus 2 additional countermeasures (education and enforcement)) to specific
performance objectives and specific types of collisions.
- Included in this version of the guide are 71 case studies that illustrate these concepts applied in practice in a number of communities throughout
the United States.
- The most significant enhancement is the integration of the countermeasures and case studies into an expert system known as PEDSAFE. This system
and the content of this guide are included on the enclosed CDROM and are available online at http://safety.fhwa.dot.gov/pedsafe and at
www.walkinginfo.org/pedsafe. The system allows the user to refine their selection of treatments on the basis of site characteristics, such as
geometric features and operating conditions, and the type of safety problem or desired behavioral change.
- PEDSAFE is intended primarily for engineers, planners, safety professionals, and decisionmakers; however, it may also be used by citizens for
identifying problems and recommending solutions for their communities.
|
| Key Terms Pedestrian Safety, Pedestrian Facilities, Crash Typing, Engineering Treatments, Education, Enforcement |
Key Results
- The PEDSAFE expert system is designed to:
- Provide information on the countermeasures available to prevent pedestrian crashes and/or improve motorist and pedestrian behaviors.
- Highlight the purpose, considerations, and cost estimates associated with each countermeasure.
- Provide a decision process to select the most applicable countermeasures for a specific location.
- Provide links to case studies showing the various treatments and programs implemented in communities around the country.
- Provide easy access to resources such as statistics, implementation guidance, and reference materials.
- Forty-nine engineering, education, and enforcement countermeasures are discussed in the report.
 |
| Pedestrian safety countermeasures. |
|
| Conclusions, Recommendations, Best Practices, Design Implications, or Design Guidelines
The report is organized into seven chapters and four appendixes, which discuss the following topics:
- Chapter 1, "The Big Picture," gives an overview on how to create a safe, walkable environment. Chapter 2, "Pedestrian Crash
Statistics," describes basic pedestrian crash trends and statistics in the United States. Chapter 3, "Selecting Improvements for
Pedestrians," discusses the approaches for selecting the most appropriate countermeasures. One approach is based on the need to resolve a
known safety problem, while the other is based on the desire to change the behaviors of motorists and/or pedestrians.
- Chapter 4, "The Expert System," describes the Web/CD-ROM application, including a description of the overall content and step-by-step
instructions for use. Chapter 5, "The Countermeasures," contains the details of 49 engineering, education, and enforcement treatments for
pedestrians. These improvements are related to pedestrian facility design, roadway design, intersection design, traffic calming, traffic management,
signals and signs, and other measures. In Chapter 6, "Case Studies," are the 71 examples of implemented treatments in communities
throughout the United States.
- Further resources are provided in chapter 7, "Implementation and Resources," including sections on community involvement in developing
priorities, devising strategies for construction, and raising funds for pedestrian improvements. A list of useful Web sites, guides, handbooks, and
other references is also provided.
- There are also several appendixes with supporting materials. Appendix A includes an assessment form that can be used in the field to collect the
information needed to effectively use the expert system. Appendix B provides a detailed matrix showing the specific countermeasures that are
associated with each of the 71 case studies. The last two appendixes provide recommended guidelines for the installation of sidewalks/walkways
(appendix C) and crosswalks (appendix D).
|
| General Comments This guide is an update to the original Pedestrian Facilities User Guide: Providing Safety and
Mobility, which was authored by Zegeer, et al. (2001). |
| Title The Effects of Traffic Calming Measures on Pedestrian and Motorist Behavior (FHWA-RD-00-104) |
Funding Agency and Contact Address Federal Highway Administration
6300 Georgetown Pike?
McLean, VA 22101-2296 COTR: Carol Tan Esse |
| Authors Huang, H.F., and Cynecki, M.J. |
| Publication Date August 2001 |
Number of Pages 27 |
| Document Web Site http://www.tfhrc.gov/safety/pedbike/index.cfm |
| Source Type Field Test |
| Driving Conditions Normal |
Vehicle Platforms Not Specified |
| Objective To evaluate the effects of selected traffic-calming treatments, at both intersection and midblock locations,
on pedestrian and motorist behavior. |
| General Approach "Before" and "after" data were collected in Cambridge, MA (bulbouts and raised
intersection); Corvallis, OR (pedestrian refuge island); and Seattle, WA (bulbouts). Data were also collected at treatment and control sites in Durham,
NC (raised crosswalks); Greensboro, NC (bulbouts); Montgomery County, MD (raised crosswalks); Richmond, VA (bulbouts); and Sacramento, CA (bulbouts).
|
Methods
- Four types of traffic-calming devices were evaluated:
- Bulbouts:A before/after study approach was used to evaluate four sites (two sites in Cambridge, MA and two sites in Seattle, WA),
and a treatment/control study approach was used to evaluate four additional sites (two in Greensboro, NC, and two in Richmond, VA).
- Raised crosswalks:Three raised crosswalks, each matched with a control site, were evaluated (two in Durham, NC, and one in
Montgomery County, MD).
- Raised intersections:Before and after data were collected at one raised intersection in Cambridge, MA.
- Refuge islands:A before/after study approach was used to evaluate five refuge islands (one in Corvallis, OR, and four in
Sacramento, CA).
- Before and after data were collected using a video camera prior to and following the installation of each treatment.
- Each traffic-calming device was evaluated according to two or three of the following measures of effectiveness (MOEs): Vehicle speeds,
pedestrians for whom motorists stopped or yielded, crossing in the crosswalk, and average wait time.
|
| Key Terms Traffic Calming, Pedestrians, Motorists, Yielding, Crossing |
| Key Results Bulbouts:
- Where pedestrians cross: The results for the bulbouts in Seattle were statistically significant, but in the undesired direction
(more pedestrians crossed in the crosswalk before the bulbouts were installed).
- Average pedestrian wait time: The effect of the bulbouts in Seattle was statistically significant, but in the undesired direction
(wait times at the bulbouts were longer in the "after" period than in the "before" period).
- Vehicle speeds: The 50th percentile speeds in Greensboro were 1.8 km/h (1.1 mi/h) lower than at their corresponding
control sites. In Richmond, the 50th percentile speeds were 3.2 km/h (2.0 mi/h) higher at the treatment site than at the corresponding
control site.
Raised Crosswalks:
- Vehicle speeds: The 50th percentile speeds were calculated at all study sites. For both sites in Durham, the 50th
percentile speed was significantly lower at the treatment site than at the control site by 6.5 to 19.3 km/h (4.0 to 12.4 mi/h). In
Montgomery County, the 50th percentile speeds were 4.0 km/h (2.5 mi/h) lower at the treatment site. This difference was not statistically
significant.
- Pedestrians for whom motorists stopped:Motorists stopped for a much higher percentage of pedestrians at the raised crosswalk with an
overhead flasher in Durham than at the corresponding control site (79.2 and 31.4 percent, respectively).
- Pedestrians who crossed in the crosswalk:The raised intersection in Cambridge had statistically significant effects (11.5 percent used
the crosswalk before the treatment, 38.3 percent after).
Refuge Islands:
- Where pedestrians crossed:The refuge island in Sacramento had statistically significant effects (61.5 percent crossed in the crosswalk
before the treatment, 71.9 percent after).
See the table below for a summary of the effect of traffic-calming devices.
Table A. Summary of traffic-calming devices by site and MOE.
| Treatment and City |
Vehicle Speed |
Pedestrians for Whom Motorists Yielded |
Pedestrian Wait Time | Using Crosswalk |
| Bulbouts (two locations), Cambridge, MA |
N/A |
* | No Change |
No Change |
| Bulbouts (two locations), Seattle, WA |
N/A |
No Change | Worse |
Worse |
| Bulbouts (two locations), Greensboro, NC |
Improve |
No Change | N/A |
N/A |
| Bulbouts (two locations), Richmond, VA |
Worse |
No Change | N/A |
N/A |
| Raised Crosswalk, Durham, NC |
Improve |
* |
N/A |
N/A |
| Raised Crosswalk and Overhead Flasher, Durham,NC |
Improve |
Improve | N/A |
N/A |
| Raised Crosswalk, Montgomery County, MD |
No Change |
No Change | N/A |
N/A |
| Raised Intersection, Cambridge, MA |
N/A |
N/A | No Change |
Improve |
| Refuge Islands and Zebra Crosswalks (four locations), Sacramento, CA |
N/A |
No Change | No Change |
Improve |
| Refuge Island and Pavement Markings, Corvallis, OR |
N/A |
* |
No Change |
No Change |
N/A = Data were not collected for this MOE.
Improve = Significant improvement at 0.10 level.
Worse = Conditions significantly worse at 0.10 level.
* = Small sample size.
|
Conclusions, Recommendations, Best Practices, Design Implications, or Design Guidelines
- Overall vehicle speeds were often lower at treatment sites than at control sites.
- The combination of a raised crosswalk with an overhead flasher increased the percentage of pedestrians for whom motorists yielded. It is not
known what part of the improvement was attributable to the raised crosswalk and what part was attributable to the flasher.
- The treatments usually did not have a significant effect on average pedestrian waiting time.
- Refuge islands often served to channelize pedestrians who crossed in the crosswalk.
- It was concluded that these devices have the potential for improving the pedestrian environment. However, these devices by themselves do not
guarantee that motorists will slow down or yield to pedestrians.
|
| General Comments None |
| Title An Evaluation of Illuminated Pedestrian Push Buttons in Windsor, Ontario (FHWA-RD-00-102) |
Funding Agency and Contact Address Federal Highway Administration
6300 Georgetown Pike
McLean, VA 22101-2296 COTR: Carol Tan Esse |
| Authors Huang, H.F., and Zegeer, C.V. |
| Publication Date August 2001 |
Number of Pages 20 |
| Document Web Site http://www.tfhrc.gov/safety/pedbike/index.cfm |
| Source Type Field Test |
| Driving Conditions Normal |
Vehicle Platforms Not Specified |
| Objective To evaluate the effects of illuminated push buttons on pedestrian behavior. |
| General Approach A before/after study design was used. During the "before" period, operational and behavioral
data were collected at four intersections (seven crosswalks) where conventional pedestrian push buttons were present in the "before" period.
These intersections were later upgraded to illuminated pedestrian push buttons. In the "after" period, operational and behavioral data were
collected at the same four intersections. |
Methods
- A video camera was used to record pedestrian and motorist behavior at all locations.
- The illuminated push buttons were evaluated using four measures of effectiveness (MOEs):
- Number of pedestrians who pushed the button.
- Signal cycles during which the button was pushed.
- Pedestrian compliance.
- Normal pedestrian crossing behavior.
|
| Key Terms Pedestrians, Push Buttons, Illuminated, Walk Phase, Compliance |
Key Results
- In general, illuminated push buttons did not have a statistically significant effect on how often the pedestrian phases were activated, how many
people pushed the button, how many people complied with the Walk phase, or such pedestrian behaviors as running, aborted crossings, and hesitation
before crossing.
- Only 17 and 13 percent of pedestrians pushed the button in the "before" and "after" periods, respectively.
- In both the "before" and "after" periods, someone pushed the button in 32 percent of the signal cycles with pedestrians.
- The majority of the pedestrians (67.8 percent with and 72.3 percent without illuminated push buttons) who arrived when parallel traffic had the
red and who pushed the button complied with the Walk phase.
- See table below for a summary of the results on selected MOEs:
Table A. Effects of illuminated push buttons by site.
| Crosswalk Location |
Pedestrians Who Pushed the Button |
Cycles in Which the Button Was Pushed |
Compliance With Walk Signal |
Normal Pedestrian Behavior. |
| Tecumseh at Annie, east leg |
N |
N |
N |
Better (0.077263) |
| Tecumseh at Annie, west leg |
N |
N |
S |
N |
| Tecumseh at Howard, east leg Better |
Better (0.041034)* |
N |
N |
N |
| Tecumseh at Howard, west leg N Worse |
N |
Worse (0.053548) |
N |
Better (0.013483) |
| Wyandotte at Patricia |
N |
Better (0.093505) |
N |
N |
| Wyandotte at Sunset, east leg |
N |
N |
S |
N |
| Wyandotte at Sunset, west leg |
N |
N |
N |
N |
| Total |
Better (0.000443) |
N |
N |
N |
* Significance levels in parentheses.
N = No significant change.
S = Small sample size.
|
Conclusions, Recommendations, Best Practices, Design Implications, or Design Guidelines
- The illuminated pedestrian push buttons had a minimal effect on pedestrian behavior at the test sites.
- A major reason for the lack of effectiveness of the illuminated push button device may be that it does not address several basic reasons for
pedestrians not pushing the buttons. Another reason for the lack of effectiveness may be that the light is difficult to see.
- The potential for gaining further pedestrian compliance with the Walk signal may be limited at the study sites.
- The testing in this study was limited in duration and does not necessarily reflect long-term effects that may result after a longer acclimation
period.
- Other signal hardware is also being tested in the United States in an attempt to enhance pedestrian safety.
|
| General Comments None |
| Title The Effects of Innovative Pedestrian Signs at Unsignalized Locations: A Tale of Three Treatments (FHWA-RD-00-098) |
Funding Agency and Contact Address Federal Highway Administration
6300 Georgetown Pike
McLean, VA 22101-2296 COTR: Carol Tan Esse |
| Authors Huang, H. Zegeer, C., Nassi, R., and Fairfax, B. |
| Publication Date August 2000 |
Number of Pages 31 |
| Document Web Site http://www.tfhrc.gov/safety/pedbike/index.cfm |
| Source Type Field Test |
| Driving Conditions Normal |
Vehicle Platforms Not Specified |
| Objective To evaluate three advisory and regulatory signs used in conjunction with marked crosswalks to improve their
visibility and increase the likelihood that motorists will yield to pedestrians. |
| General Approach This paper evaluates the following three advisory and regulatory signs: (1) an overhead "Crosswalk
" sign in Seattle, WA.; (2) pedestrian safety cones (with the message, "State Law–Yield to Pedestrians in Crosswalk in Your Half of
Road") in New York State and Portland, OR; and (3) pedestrian-activated "Stop for Pedestrian in Crosswalk" overhead signs in Tucson, AZ.
The signs were used under different traffic and roadway conditions. |
Methods
- Data were collected before and after the installation of each of the following devices:
- An overhead "Crosswalk" sign in Seattle, WA.
- Pedestrian safety cones (with the message, "State Law–Yield to Pedestrians in Crosswalk in Your Half of Road") in New
York State and Portland, OR.
- Pedestrian-activated "Stop for Pedestrian in Crosswalk" overhead signs in Tucson, AZ.
- A video camera recorded the following data:
- Pedestrians in the crosswalk and in the queuing areas on either side of the road.
- Whether approaching motorists stopped or slowed down for pedestrians.
|
| Key Terms Crosswalks, Pedestrians, Motorists, Behavior, Signs |
| Key Results
Pedestrians for Whom Motorists Yielded:
- Of all the treatments evaluated, pedestrian safety cones most consistently allowed pedestrians to cross with a motorist yielding to him or her.
Combining all safety cone sites, motorists yielded to 81.2 percent of pedestrians, compared with 69.8 percent in the "before" period
(see figure).
- The overhead "Crosswalk" sign in Seattle had better results than some of the regulatory signs in Tucson and New York State. Motorists
yielded to 45.5 percent of pedestrians in the "before" period and 52.1 percent in the "after" period.
Motorists Who Yielded to Pedestrians:
- There was a significant decrease in the number of motorists that did not yield to pedestrians after the overhead sign was installed in Tucson
(16.0 percent of the motorists did not yield in the "before" period, whereas 6.0 percent did not yield in the "after" period).
Pedestrians Who Ran, Aborted, or Hesitated:
- In Seattle, significantly fewer pedestrians ran, aborted, or hesitated after the overhead crosswalk sign was installed (43.1 percent after
vs. 58.2 percent before).
- Tucson’s "Stop for Pedestrian in Crosswalk" sign significantly reduced pedestrian running/aborted crossings from 16.7 percent
before to 10.4 percent after.
- The pedestrian safety cones in New York State and Portland resulted in a slight decrease that was not significant.
Percentage of Pedestrians Who Crossed in the Crosswalk:
- There were no significant differences in the amount of pedestrians who crossed before and after any of the treatments.
|
|
Figure A. Effects of treatments on the number of pedestrians who benefited from motorists yielding to them.
|
Conclusions, Recommendations, Best Practices, Design Implications, or Design Guidelines
- The New York State cones and Seattle signs were effective in increasing the number of pedestrians who had the benefit of motorists stopping
for them.
- At one location in Tucson, the overhead sign resulted in an increase in motorists yielding to pedestrians.
- The signs in Seattle and Tucson were effective in reducing the number of pedestrians who had to run, hesitate, or abort their crossing.
- None of the treatments had a clear effect on whether people crossed in the crosswalk.
- These devices, by themselves, cannot ensure that motorists will slow down and yield to pedestrians.
- It is essential to use these devices together with education and enforcement. Traffic engineers can use other measures as well, including
designing "friendlier" pedestrian environments at the outset.
|
| General Comments None |
| Title Evaluation of Automated Pedestrian Detection at Signalized Intersections (FHWA-RD-00-097) |
Funding Agency and Contact Address Federal Highway Administration
6300 Georgetown Pike
McLean, VA 22101-2296 COTR: Carol Tan Esse |
| Authors Hughes, R., Huang, H., Zegeer, C., and Cynecki, M. |
| Publication Date August 2001 |
Number of Pages 23 |
| Document Web Site http://www.tfhrc.gov/safety/pedbike/pedbike.htm |
| Source Type Field Test |
| Driving Conditions Normal |
Vehicle Platforms Not Specified |
| Objective To evaluate whether automated pedestrian detectors, when used in conjunction with standard pedestrian push
buttons, would result in fewer overall pedestrian/vehicle conflicts and fewer inappropriate crossings. |
| General Approach "Before" and "after" video data were collected at intersection locations in Los
Angeles, CA (infrared andmicrowave); Phoenix, AZ (microwave); and Rochester, NY (microwave). |
Methods
- Data collection consisted of videotaping motorist and pedestrian behavior before and after automated detectors were installed in Los Angeles,
Rochester, and Phoenix.
- At each location, pedestrian push buttons already existed and remained operational after the automated detectors were added. In Los Angeles,
data were collected under three conditions: No automated detector in operation, infrared detector in operation, and microwave detector in operation.
- Data were collected during daylight hours, under dry conditions.
- A video camera was set up on the sidewalk, approximately 23 m (75 ft) upstream from the intersection.
|
| Key Terms Automatic Pedestrian Detection, Microwave, Infrared, Signals, Conflicts |
| Key Results Pedestrians Who Began to Cross During the Steady "Don’t Walk":
- At the Los Angeles site, both infrared and microwave detectors, when used in conjunction with the push button, resulted in a significant
reduction in the percentage of pedestrians beginning to cross during the "Don’t Walk" signal.
- In Rochester, the use of the microwave detector significantly reduced the number of pedestrians beginning to cross during the "Don’t
Walk" signal. The same results were seen at the Phoenix site.
- The addition of the extended crossing time for pedestrians significantly reduced the percentage of pedestrians who finished crossing during
a steady "Don’t Walk" display (from 16 percent to 7 percent).
Effects of Automated Detection on Pedestrian/Vehicle Conflicts:
- For the Los Angeles site, the use of automatic pedestrian detectors significantly reduced vehicle/pedestrian conflicts (see figure). There
were no significant differences based on whether the infrared or microwave detector was used.
- Similar effects were obtained with the use of microwave detection at both sites in Rochester.
|
|
Figure A. Pedestrians who experienced conflicts with motor vehicles.
|
Conclusions, Recommendations, Best Practices, Design Implications, or Design Guidelines
- The results indicated a significant reduction in vehicle/pedestrian conflicts, as well as a reduction in the number of pedestrians beginning to
cross during the "Don’t Walk" signal.
- The differences between microwave and infrared detectors were not significant.
- Detailed field testing of the microwave equipment in Phoenix revealed that fine tuning of the detection zone is still needed to reduce the
number of false calls and missed calls.
|
| General Comments None |
| Title Dutch Pedestrian Safety Research Review (FHWA-RD-99-092) |
Funding Agency and Contact Address Federal Highway Administration
6300 Georgetown Pike
McLean, VA 22101-2296 COTR: Carol Tan Esse |
| Authors Hummel, T. |
| Publication Date December 1999 |
Number of Pages 37 |
| Document Web Site http://www.walkinginfo.org/rd/international.htm |
| Source Type Literature Review |
| Driving Conditions Normal |
Vehicle Platforms All |
| Objective This report was one in a series of pedestrian safety synthesis reports prepared for FHWA to document pedestrian
safety in other countries. |
| General Approach This report is a review of recent pedestrian safety research in the Netherlands. It addresses several
topics, reports findings, and provides a comprehensive list of references. |
| Methods Topics addressed include:
- Pedestrian crossings and traffic-calming measures: Here research is reviewed on pedestrian crossings,along with other research
pertaining to infrastructure changes in the form of traffic calming.
- Children and the elderly: Measures for the increasing safety of children and elderly pedestrians are presented.
- Disabled pedestrians: Discussion is provided concerning hardware and infrastructure that perhaps could be created in order to give
better consideration to pedestrians with some kind of disability.
- Passenger car front-end structure: Discussion is presented as to the role of the passenger car’s structural properties as it
influences injury severity in a collision with a pedestrian.
|
| Key Terms Pedestrian Safety, Pedestrian Crossings, Traffic Calming, Disabled Pedestrians. |
| Key Results Pedestrian Crossings:
- Installation of unsignalized pedestrian crossings does not lead to an improvement of traffic safety (Boot, 1987). Signalized crossings in
situations with high volumes of motorized traffic and pedestrian traffic, however, proved to have a positive effect on traffic safety.
- The following innovative measures for improvement of signalized crossings were discussed in detail: Alternative Maastricht crossing, flashing
yellow at signalized pedestrian crossings, and PUSSYCATs.
Traffic-Calming Measures:
- With regard to infrastructure, the key to arriving at sustainable safety lies in the systematic and consistent application of the following
three safety principles: Functional use of the road network, homogeneous traffic streams, and predictability for road users.
- The following solutions were presented that lead to favorable road conditions for motorized traffic and pedestrians and cyclists: Reduce the
amount of motorized traffic on main roads, separate traffic modes on main roads, reduce the amount of motorized traffic in city centers, and
provide parking space on the outskirts of the city centers, replace controlled intersections with roundabouts, and provide tunnels and bridges
for cyclists and pedestrians to cross main roads.
Children and the Elderly:
- Children and elderly pedestrians prove to be the most vulnerable. Nearly 50 percent of the total number of pedestrians killed are older than
age 65. Their risk, expressed as the number of deaths per kilometer, is also found to be very high (more than 100 deaths per billion kilometers,
compared to 27, on average, for all age groups).
- Next to the elderly, children age 14 or younger are the second most vulnerable age group. The number of children killed in a traffic crash
has, however, decreased more than for other age groups.
Disabled Pedestrians:
- One report indicates that the major complaints of disabled people mainly concern problems experienced in city centers and shopping centers
(Prikken and Gerretsen, 1988). The problems were divided into the following groups: Route difficult to traverse, problems reaching certain
destinations, accessibility of destinations, and usability of provisions or destinations.
Passenger Car Front-End Structure:
- The studies described discuss two different aspects of passenger car front-impact requirements. The first study concerns a comparison of both
the costs and benefits of the implementation of passenger car frontimpact requirements in the Netherlands. The other two publications describe the
development of test methods for evaluating pedestrian protection for passenger cars (Janssen and Nieboer, 1990; Janssen, Goudswaard, Versmissen,
and Van Kampen, 1990).
|
| Conclusions, Recommendations, Best Practices, Design Implications, or Design Guidelines See Key Results above. |
| General Comments Reports are also available for: United Kingdom (FHWA-RD-99-089), Canada (FHWA-RD-99-090), Sweden
(FHWA-RD-99-091), and Australia (FHWA-RD-99-093). |
| Title Bicycle Lanes vs. Wide Curb Lanes, Final Report(FHWA-RD-99-034) |
Funding Agency and Contact Address Office of Safety and Traffic Operations
Research and Development
Federal Highway Administration
6300 Georgetown Pike
McLean, VA 22101-2296 COTR: Carol Tan Esse |
| Authors Hunter, W.W., Stewart, J.R., Stutts, J.C., Huang, H.H., and Pein, W.E. |
| Publication Date December 1999 |
Number of Pages 104 |
| Document Web Site http://www.tfhrc.gov/safety/pedbike/index.cfm |
| Source Type Field Test, Survey |
| Driving Conditions Normal |
Vehicle Platforms Not Specified |
Objective
- Provide a comparative analysis of bicycle lanes (BLs) vs. wide curb lanes (WCLs).
- Develop a guidebook of current innovative bicycling activities, with a primary focus on intersection treatments that pertained to BLs
and WCLs.
|
| General Approach The primary analysis was based on videotapes of nearly 4,600 bicyclists (2,700 riding in BLs and 1,900
in WCLs) in Santa Barbara, CA; Gainesville, FL; and Austin, TX. The videotapes were coded to evaluate operational characteristics and conflicts with
motorists, other bicyclists, or pedestrians. |
| Methods Videotaped Data:
- Bicyclists in either a BL or WCL were videotaped as they approached and proceeded through eight BL and eight WCL intersections with varying
speed and traffic conditions in three cities.
- The videotapes were coded to learn about operational characteristics (e.g., intersection approach position and subsequent maneuvers) and
conflicts with motor vehicles, other bicycles, or pedestrians.
Bicyclist Experience Data:
- An oral survey was administered.
- The following information was collected: Age, average days per week of bicycling, average miles per week of bicycling, classification of
experience riding on city streets.
|
| Key Terms Bicycle Lane, Wide Curb Lane, Bicycle Operations, Bicycle Maneuvers, Conflicts |
Key Results
- Wrong-way riding and sidewalk riding were much more prevalent at WCL sites compared with BL sites (7 percent on sidewalks at WCL sites vs. 2.3
percent at BL sites).
- Significant differences in operational behavior and conflicts were found between BLs and WCLs; however, these varied depending on the behavior
analyzed.
- Significantly more motor vehicles passing bicycles on the left encroached into the adjacent traffic lane in WCL situations (17 percent) compared
to BL situations (7 percent).
- Proportionally more bicyclists obeyed stop signs at BL sites (81 percent compared to 55 percent at WCL sites); however, when a stop sign was
disobeyed, the proportion of bicyclists with both "somewhat unsafe" and "definitely unsafe" movements was higher at BL sites.
- The vast majority of observed bicycle/motor vehicle conflicts were minor, and there were no differences in the severity by type of bicycle
facility.
- Bicyclists in WCLs experienced more bicycle/pedestrian conflicts (17 percent in WCLs and 6 percent in BLs), while bicyclists in BLs experienced
more bicycle/bicycle conflicts (15 percent in BLs and 4 percent in WCLs).
- Bicyclists surveyed at WCL sites tended to ride more days per week; however, the miles per week for bicyclists at BL vs. WCL sites were
equivalent.
|
Conclusions, Recommendations, Best Practices, Design Implications, or Design Guidelines
- The overall conclusion is that both BL and WCL facilities can and should be used to improve riding conditions for bicyclists. The identified
differences in operations and conflicts appeared to be related to the specific destination patterns of bicyclists riding through the intersection
areas studied and not to the characteristics of the bicycle facilities.
- The parent study showed several factors to be consistently related to the occurrence of bicycle/motor vehicle conflicts: (1) presence of
parked motor vehicles, (2) presence of driveways or intersecting streets, and (3) provision of additional (usually turn) lanes at intersections
that typically resulted in a narrowing of the BL or WCL.
|
| General Comments In addition to this report, there is a separate report (FHWA-RD-99-035) containing a synopsis of the key
findings of the final report and recommended countermeasures, as well as a guidebook (FHWA-RD-99-036). |
| Title Bicycle Lanes vs. Wide Curb Lanes: Operational and Safety Findings and Countermeasure Recommendations(FHWA-RD-99-035) |
Funding Agency and Contact Address Office of Safety and Traffic Operations
Research and Development
Federal Highway Administration
6300 Georgetown Pikeb
McLean, VA 22101-2296 COTR: Carol Tan Esse |
| Authors Hunter, W.W., Stewart, J.R., Stutts, J.C., Huang, H.H., and Pein, W.E. |
| Publication Date October 1999 |
Number of Pages 31 |
| Document Web Site http://www.tfhrc.gov/safety/pedbike/pedbike.htm |
| Source Type Field Test (Countermeasures and Recommendations) |
| Driving Conditions Normal |
Vehicle Platforms Not Specified |
| Objective To present operational and safety findings and countermeasure recommendations from a comparative analysis of
bicycle lanes (BL) vs. wide curb lanes (WCL). |
| General Approach
The primary analysis was based on videotapes of nearly 4,600 bicyclists in Santa Barbara, CA; Gainesville,
FL; and Austin, TX. The videotapes were coded to evaluate operational characteristics and conflicts with motorists, other bicyclists, or pedestrians.
|
| Methods Videotaped Data in the Parent Study:
- Bicyclists in either a BL or WCL were videotaped as they approached and proceeded through eight BL and eight WCL intersections with varying
speed and traffic conditions in three cities.
- The videotapes were coded to learn about operational characteristics (e.g., intersection approach position and subsequent maneuvers) and
conflicts with motor vehicles, other bicycles, or pedestrians.
Bicyclist Experience Data in the Parent Study:
- An oral survey was administered.
- The following information was collected: Age, average days per week of bicycling, average miles per week of bicycling, classification of
experience riding on city streets.
|
| Key Terms Bicycle Lane, Wide Curb Lane, Bicycle Operations, Bicycle Maneuvers, Conflicts |
Key Results
- Significant differences in operational behavior and conflicts were found between BLs and WCLs; however, these varied depending on the behavior
analyzed.
- Wrong-way riding and sidewalk riding were much more prevalent at WCL sites compared with BL sites.
- Significantly more motor vehicles passing bicycles on the left encroached into the adjacent traffic lane from WCL situations compared with BL
situations.
- Proportionally more bicyclists obeyed stop signs at BL sites; however, when a stop sign was disobeyed, the proportion of bicyclists with both
"somewhat unsafe" and "definitely unsafe" movements was higher at BL sites.
- The vast majority of observed bicycle/motor vehicle conflicts were minor, and there were no differences in the severity by type of bicycle
facility.
- Bicyclists in WCLs experienced more bicycle/pedestrian conflicts, while bicyclists in BLs experienced more bicycle/bicycle conflicts.
|
Conclusions, Recommendations, Best Practices, Design Implications, or Design Guidelines
- The overall conclusion is that both BL and WCL facilities can and should be used to improve riding conditions for bicyclists. The identified
differences in operations and conflicts appeared to be related to the specific destination patterns of bicyclists riding through the intersection
areas studied and not the characteristics of the bicycle facilities
- The parent study showed several factors to be consistently related to the occurrence of bicycle/motor vehicle conflicts: (1) presence of
parked motor vehicles, (2) presence of driveways or intersecting streets, and (3) provision of additional (usually turn) lanes at intersections
that typically resulted in a narrowing of the BL or WCL.
- It is recommended that a "No Parking in Bike Lane" sign be used and enforced to limit motor vehicles from parking in BLs.
- To minimize conflict from intersecting street traffic, clear sight lines should be provided for motorists entering the street through a
driveway or an intersecting street. In addition, a "Watch for Bicyclists" sign should be installed.
- To reduce conflicts between bicyclists and motorists turning right, an advanced stop bar or bicycle box may be added.
- Research from other countries indicates that the use of symbols, color, and other devices reduces conflicts and crashes at intersections.
|
| General Comments In addition to this implementation manual, there is a final report (FHWA-RD-99-034) containing a
complete discussion of the research method, data collection procedures, and data analysis, as well as a guidebook(FHWA-RD-99-036) about innovative bicycle
accommodations. |
| Title Pedestrian Crosswalk Case Studies: Sacramento, California; Richmond, Virginia; Buffalo, New York; Stillwater,
Minnesota(FHWA-RD-00-103) |
Funding Agency and Contact Address Office of Safety Research
and Development
Federal Highway Administration
6300 Georgetown Pike
McLean, VA 22101-2296 COTR: Carol Tan Esse |
| Authors Knoblauch, R.L., Nitzburg, M., and Seifert, R.F. |
| Publication Date August 2001 |
Number of Pages 45 |
| Document Web Site http://www.tfhrc.gov/safety/pedbike/index.cfm |
| Source Type Field Test |
| Driving Conditions Normal |
Vehicle Platforms Not Specified |
Objective
- Determine the effect of crosswalk markings on driver and pedestrian behavior at unsignalized intersections.
- Specifically, determine whether: (1) pedestrians were more likely to cross a street within a marked crosswalk; (2) drivers drove slower and/or
yielded more often to pedestrians crossing at a marked location; and (3) pedestrians use more, less, or the same amount of caution when crossing at
a marked crosswalk compared with an unmarked location.
|
| General Approach A before/after evaluation of crosswalk markings was conducted at 11 intersections. |
Methods
- Eleven intersections were selected in four cities (three sites in Sacramento, CA; Richmond, VA; and Buffalo, NY, and two sites in Stillwater, MN).
- The data collected included the following information: Detailed site drawings, tape recordings of behavioral observations, traffic volume counts, and time headways (traffic gaps).
- Four studies were conducted at each site:
- Pedestrian Entry/Magnet Study: Researchers recorded precise locations and the number of pedestrians entering the roadway to
cross.
- Right-of-Way Study: Recorded whether the driver did or did not yield to the pedestrian and if the pedestrian showed blatant
aggressive behavior toward the driver.
- Driver Speeds/Staged Pedestrian Study: Speed measurements were recorded using laser radar or Kband radar. Speed measurements
were collected under three staged pedestrian conditions (no pedestrian, a staged pedestrian standing in the crosswalk looking toward oncoming
traffic, and a staged pedestrian making a stepping motion into the crosswalk).
- Pedestrian Profile Study: Age, gender, travel path, travel speed, and looking behavior of pedestrians, as well as the
presence/absence of parked vehicles and unusual driver behavior were observed and recorded for each targeted pedestrian.
|
| Key Terms Pedestrians, Safety, Crosswalks |
| Key Results Available Gaps in Traffic:
- Overall, across all sites, there was a significant (3.3 percent) increase in the percentage of gaps that were adequate for safe crossing at a 1.07-m/s
(3.5-ft/s) walking speed.
Vehicle Speeds/Staged Pedestrian Study:
- For the No Pedestrian condition, there were no significant differences between the before and after crosswalk marking conditions.
- For the Pedestrian Looking condition, there were significant differences between the "before" and "after" periods. The
approach speeds were significantly lower in the "after" period (1.35-km/h (0.84-mi/h) speed reduction).
- In the Pedestrian Stepping condition, there was a significant effect between the "before" and "after" conditions. In
addition, there was a significant interaction by city. Sacramento and Buffalo approach speeds decreased significantly, while the approach speeds
in Richmond increased significantly between the "before" and "after" periods.
Driver and Pedestrian Behavior:
- There were no significant differences between the "before" and "after" periods in any of the behaviors observed.
Table A. Summary of research results.
| Hypothesis |
Measure of Effectiveness (MOE) | Conclusion |
| Before/after differences are a result of the installation of the crosswalk markings and not other factors. | Vehicle Volumes, Traffic Gaps,
Pedestrian Volumes |
- No meaningful before/after changes were found in either vehicle volumes or traffic gaps.
- No meaningful before/after changes were found in pedestrian volumes.
- Lack of before/after changes in overall vehicle and pedestrian activity means that changes can be more confidently attributed to the
installation of the marked crosswalks. |
| Crosswalk markings do not affect the way drivers respond to pedestrians. |
Vehicle Speed (approaching and at crosswalk) |
- Although the magnitude of the observed speed changes was small, drivers appear to respond differently (e.g., drive slower when approaching a
pedestrian in a marked crosswalk). |
| Crosswalk markings disrupt traffic flow because some drivers will stop and yield to crossing pedestrians. |
Driver Yielding Behavior |
- No changes in driver yielding were observed. Drivers are not either more or less likely to yield to a pedestrian in a marked crosswalk. |
| Pedestrians feel protected by marked crosswalks and act more aggressively when crossing. |
Aggressive Pedestrian Behavior |
- No change in blatantly aggressive pedestrian behavior indicates that pedestrians do not feel overly protected by crosswalk markings. |
| Pedestrians will not use marked crosswalks. |
Percentage of Crossing Pedestrians in the Crosswalk |
- Pedestrians walking alone tend to use marked crosswalks, especially at busier intersections.
- Pedestrians walking in groups do not tend to use marked crosswalks.
- Overall, crosswalk use increased after the installation of the crosswalk markings. |
|
Conclusions, Recommendations, Best Practices, Design Implications, or Design Guidelines
- Drivers approach a pedestrian in a crosswalk somewhat slower, and crosswalk use increases after markings are installed.
- No evidence was found indicating that pedestrians are less vigilant in a marked crosswalk.
- No changes were found in driver yielding or pedestrian assertiveness.
- Overall, it appears that marking pedestrian crosswalks at relatively low-speed, low-volume, unsignalized intersections is a desirable practice,
based on the sample of sites used in this study.
|
| General Comments None |
| Title
The Pedestrian and Bicyclist Highway Safety Problem as It Relates to the Hispanic Population in the United States |
Funding Agency and Contact Address Federal Highway Administration
6300 Georgetown Pike
McLean, VA 22101-2296 COTR: Not Specified |
| Authors Knoblauch, R.L., Seifert, R.F., and Murphy, N.B. |
| Publication Date December 2004 |
Number of Pages 59 |
| Document Web Site http://safety.fhwa.dot.gov/ped_bike/ped/index.htm |
| Source Type Crash/Demographics Statistical Analysis, Focus Group |
| Driving Conditions N/A |
Vehicle Platforms N/A |
Objective
- Determine the extent of the pedestrian and bicyclist highway safety problem as it relates to Hispanics.
- Provide FHWA and NHTSA with information for developing a marketing plan for pedestrian and bicycle safety messages for Hispanic audiences in
the United States.
|
| General Approach A crash data analysis was performed to determine possible crash risk factors. In addition, two focus
groups were conducted. |
| Methods Quantitative Data Analysis:
- A limited examination of the 2000 U.S. Census was done to identify possible crash risk factors.
- In order to see if there are any major differences in crash involvement, some of the crash data was examined in specific geographical areas
that tend to have concentrations of Hispanics from specific countries/areas. The following areas were identified to focus on four specific
Hispanic subgroups:
- Hispanics of Mexican Origin: California.
- Hispanics of Central/South American Origin: Washington, DC; Maryland; Virginia.
- Hispanics of Cuban Origin: Florida.
- Hispanics of Puerto Rican Origin: New York, New Jersey.
Focus Group:
- Two focus groups, one for pedestrians and one for bicyclists, were held in each of four cities: Washington, DC; Los Angeles, CA; Miami, FL; and
New York City, NY.
- There were 28 men and 34 women. All were of Hispanic origin.
- The focus group discussions were in Spanish.
|
| Key Terms Pedestrian Safety, Bicyclist Safety, Hispanic Populations |
| Key Results Quantitative Data, Main Findings:
- Each year, an average of 545 Hispanics are killed in pedestrian crashes. Hispanic pedestrians account for 16.3 percent of all pedestrian crashes
nationwide.
- Each year, an average of 79 Hispanics are killed in bicycle crashes. Hispanic bicyclists account for 15.6 percent of all bicyclist crashes
nationwide.
- Most of the Hispanic pedestrian crashes involve Hispanics of Mexican or Central/South American origin (77.3 percent).
- Most of the Hispanic bicycle crashes involve Hispanics of Mexican or Central/South American origin (79.7 percent).
- The Hispanic population in the United States has a higher pedestrian death rate than non-Hispanic Whites, but not as high as non-Hispanic
Blacks.
Focus Group, Main Findings:
There are significant cultural differences that affect how Hispanics behave as pedestrians and bicyclists in the United States. Participants
reported that traffic rules are enforced more stringently in the United States than in Latino countries. They also said that Hispanic neighborhoods
in the United States are more disorderly and that these neighborhoods may also be prone to more crashes. -
Many features of the U.S. traffic system appear to be somewhat unfamiliar to Hispanics. Participants reported that signs that rely heavily
on writing in English can be confusing. They also said that traffic moves faster in the United States. Crosswalks appear to be less common in Latino
countries.
-
While U.S. drivers were seen as more respectful of pedestrians and bicyclist than those in Latino countries, participants still complained
about a lack of respect from drivers.
-
Participants reported that they sometimes knowingly do things that put them at risk. For example, almost all participants in the pedestrian
group had jaywalked, and many cyclists said that they do not always stop when it is required.
Participants do take some safety precautions, such as trying to be alert, making eye contact with drivers, or wearing safety gear (e.g.,
helmets for bicyclists) or brightly colored clothing. Pedestrians and bicyclists both cite automobiles as a primary cause of crashes, and participants strongly believe that education on this
topic needs to involve drivers, as well as pedestrians and bicyclists. Crashes are likely to be underreported for Hispanic pedestrians and cyclists. Many participants cited fear of the police and illegal
immigration status as reasons Hispanics may not contact the police. Children, senior citizens, and recent immigrants were all thought to be more at risk of being involved in crashes than other groups because
of their lack of awareness, lack of mobility, and lack of acculturation, respectively. - Focus Group members thought that additional education on this topic and fines would help to address this problem
|
Conclusions, Recommendations, Best Practices, Design Implications, or Design Guidelines
- Local pedestrian and bicycle safety programs targeted at Hispanics should focus on the specific pedestrian/bicyclist problems being experienced
in each community.
- FHWA/NHTSA should consider designing and implementing campaigns for pedestrians, bicyclists, and drivers around the idea of "respect."
- Hispanics and recent immigrants, in particular, need information that is bilingual and that clearly explains common U.S. traffic laws, signs,
rules, and behaviors.
- Information campaigns specifically for Hispanics should focus on the need to obey U.S. traffic laws, such as stopping at lights and crossing
only in crosswalks.
|
| General Comments None |
| Title Characteristics of Emerging Road and Trail Users and Their Safety, TechBrief (FHWA-HRT-04-104) |
Funding Agency and Contact Address Federal Highway Administration
6300 Georgetown Pike
McLean, VA 22101-2296 COTR: Not Specified |
| Authors Landis, B.W., Petritsch, T.A., Huang, H.F., and Do, A. |
| Publication Date September 2004 |
Number of Pages 22 |
| Document Web Site http://www.tfhrc.gov/safety/pubs.html |
| Source Type Field Test |
| Driving Conditions N/A |
Vehicle Platforms N/A |
| Objective To conduct a study to better understand the physical dimensions and operational characteristics of an
increasingly diverse group of nonmotorized trail and roadway devices. These devices include: Adult tricycles, assistive power, bicycle trailers, electric
bicycles, hand cycles, inline skates, kick scooters, manual wheelchairs, power wheelchairs, recumbent bicycles, scooters, skateboards, strollers, and tandems.
|
| General Approach Field data collection activities were conducted using bicycles and emerging user devices at 21 data
collection stations at 3 shared-use paths across the United States. The individual event locations were planned and advertised as "Rides for Science
" to encourage participation. Events were held at the San Lorenzo River Trail in California, the Pinellas Trail in Florida, and the Paint Branch Trail
in Maryland. These "Ride for Science" events included 811 participants. |
| Methods
Seven data collection stations were set up at each trail. Collected data included the following:
- Physical dimensions, including length, width, height, eye height, wheelbase, wheel spacing, wheel
diameter, tire/wheel width, and tire type.
- Space required for a three-point turn.
- Lateral operating space (sweep width).
- Turning radii.
- Acceleration capabilities.
- Speed.
- Stopping sight distance and time (perception/reaction and braking distances).
Physical characteristics and three-point turn widths were measured and video cameras were set up to record participants’ movements at various
locations along the trails. Following each data collection event, the videotapes were converted to digital format and subsequently viewed to reduce the data
and determine operational characteristics for each data collection station.
|
| Key Terms Nonmotorized Devices, Shared-Use Path, Bicycle Facilities, Safety |
| Key Results
Sweep Width:
- The 85th percentile inline skater had a 1.5-m sweep width, wider than the recommended width for bicycle lanes.
- Two inline skaters passing in opposite directions have an approximate combined sweep width of 3 m.
- Hand cyclists require 5.4 m to perform a three-point turn.
Horizontal Alignment:
- Most users do not appear to reduce their speeds for radii greater than 16 m.
- The exception is recumbent bicyclists, who may have been constrained by even the 27-m radius.
Stopping Sight Distance:
- The 85th percentile bicyclist requires a stopping sight distance of only 12.4 m on dry pavement and 19.4 m on wet pavement.
- A recumbent cyclist in the 85th percentile requires a stopping sight distance of 32.7 m on wet pavement.
Vertical Alignment/Crest Vertical Curves:
- The FHWA study found that the observed stopping distance for a bicyclist yield required a length-of-crest vertical curve of only 20.4 m.
- Recumbent bicyclists required a length-of-crest vertical curve of 46.6 m.
Signal Clearance Intervals:
- A 5-s clearance interval provides insufficient time for most users to clear a five-lane, 18.3-m-wide intersection.
Table A. Design criteria and potential design users.
| Design Feature |
AASHTO Design Value
(for Bicyclists) |
Potential Design
Device/User |
Performance Value
(85th Percentile) |
| Sweep width |
3 m |
Inline skaters |
1.5 m |
| Horizontal alignment |
27 m |
Recumbent bicyclists |
26.8 m |
| Stopping sight distance(wet pavement) |
38.7 m |
Recumbent bicyclists |
32.7 m |
| Vertical alignment/crest(5 percent S grades) |
49.8 m |
Recumbent bicyclists |
46.7 m |
| Refuge islands |
2.5 m |
Bicycles with trailers |
3.0 m |
| Signal clearance intervals |
7.5 s for a distance of 24.4 m |
Kick scooters |
10.6 s for a distance of 24.4 m |
| Minimum green times |
12.3 s for a distance of 24.4 m |
Hand cyclists |
17.9 s for a distance of 24.4 m |
| Pedestrian clearance intervals |
20.0 s for a distance of 24.4 m |
Manual wheelchairs |
15.4 s for a distance of 24.4 m |
|
Conclusions, Recommendations, Best Practices, Design Implications, or Design Guidelines
- The research confirmed a great diversity in the operating characteristics of various road and trail user types.
- The research determined that it might be prudent to use an emerging user device instead of the bicycle as the design vehicle for shared-use paths
or nonmotorized roadway facilities.
- While additional research is needed to determine which devices should be used to set specific design criteria, the findings suggest that design
guidelines might need to be revised to incorporate the needs of emerging trail users.
- The results of this study can be used to help design professionals adequately design roadway and shared-use path facilities to meet the
operational and safety needs of this growing and diverse group of users.
|
| General Comments None |
| Title Pedestrian Safety in Native America (FHWA-SA-04-007) |
Funding Agency and Contact Address Office of Safety
Federal Highway Administration
400 Seventh Street, S.W.
Washington, DC 20590 COTR: D. Smith and T. Redmon |
| Authors La Valley, J., Crandall, C.S., Sklar, D.P., and Banks, L. |
| Publication Date September 2004 |
Number of Pages 41 |
| Document Web Site http://www.walkinginfo.org/pdf/FHWA/Ped_Safety_in_Native_America.pdf |
| Source Type Crash/Demographic Statistical Analysis, Focus Group |
| Driving Conditions Normal |
Vehicle Platforms All |
| Objective To determine the characteristics of American Indian pedestrian crashes in the United States. |
| General Approach Data from the NHTSA Fatality Analysis Reporting System (FARS) and the National Center for Health
Statistics Web-Based Injury Statistics Query and Reporting System (WISQARS) were analyzed to typify crashes among American Indians in the United States.
Relative rates of pedestrian injury were calculated as a measure of risk disparity between the American Indian population in each State and all other races.
|
| Methods
Demographic and Crash Data:
- Demographic data sources: U.S. Census Bureau, Bureau of Indian Affairs, Indian Health Service, and the Substance Abuse and Mental Health
Administration. [Data elements collected: Tribal registry, tribal population by age and gender, poverty rates, unemployment rates, and
self-reported rates of alcohol use and abuses.]
- Pedestrian crash data sources: NHTSA FARS, Center for Disease Control National Center for Injury Prevention and Control (WISQARS), and
vital statistics death record data that were collected from all 50 States. [Data elements collected: Crash characteristics, roadway
characteristics, and demographic information.]
- Study States: Arizona, Minnesota, Mississippi, Montana, New Mexico, Oregon, South Dakota, Utah, and Wyoming. [Data elements
collected: Crash characteristics, roadway characteristics, and demographic information.]
American Indian Community Attitudes on Pedestrian Safety:
- Focus groups were conducted in nine American Indian/Alaska Natives (AI/AN) communities across the United States.
- First focus group: This focus group series targeted individuals who worked as service professionals somewhat related to pedestrian
injury.
- Second focus group: This focus group series targeted individuals who were currently engaged in or had completed some kind of pedestrian
safety intervention (e.g., coordinated enforcement, engineering, and educational activities).
|
| Key Terms Crashes, FARS, American Indians, Pedestrian, Highways, Safety |
Key Results
- AI/AN have the highest rates of pedestrian injury among all other races in the United States.
- Common characteristics included the crash occurring at night; in an unlit area; on a two-lane undivided, level roadway; and off the reservation.
- AI/AN pedestrian crashes involved alcohol in 56.3 percent of fatal crashes, with a mean pedestrian BAC much higher than all other crashes.
- Rural crashes tended to occur on rural segments of State highway and interstate, involve alcohol, and had a higher incidence of hit-and-run
involvement. Urban crashes more frequently occurred on municipal roads, involved less alcohol on par of the driver or pedestrian, had a lower
hit-and-run frequency, and more often had a clearly marked division of traffic flow.
- The focus group participants favored educational and media-based interventions and law enforcement solutions as potential safety interventions
(see figure).
|
|
Figure A. Interventions favored by focus group participants.
|
Conclusions, Recommendations, Best Practices, Design Implications, or Design Guidelines
- Contributing factors such as alcohol involvement on the part of the pedestrian or driver, rurality, poverty, and lack of visibility and traffic
control devices were identified.
- American Indian communities require community-specific injury prevention intervention activities for community-specific pedestrian safety
problems.
- Focus groups conducted during the study period identified successful strategies for addressing pedestrian injury among American Indian
communities. Successful strategies identified included educational and media-based interventions, law enforcement interventions, child education,
and pedestrian facility improvements.
|
| General Comments None |
| Title Literature Review on Vehicle Travel Speeds and Pedestrian Injury (DOT-HS-809-012) |
Funding Agency and Contact Address National Highway Traffic Safety
Administration
400 Seventh Street, S.W.
Washington, DC 20590 COTR:
Dr. Marvin Levy and Dr. Patricia Ellison-Potter |
| Authors Leaf, W.A., and Preusser, D.F. |
| Publication Date October 1999 |
Number of Pages 67 |
| Document Web Site http://www.nhtsa.dot.gov/people/injury/research/pub/HS809012.html |
| Source Type Literature Review, Crash/Demographic Statistical Analysis |
| Driving Conditions Normal |
Vehicle Platforms Not Specified |
Objective
- Reaffirm and quantify the relationship between vehicle speeds and pedestrian crash severities through literature review and data analysis.
- Describe techniques that have been used for reducing vehicle speeds and review their effectiveness.
- Synthesize these results into recommendations for countermeasure programs to be tested in this country.
|
| General Approach American and international literature related to vehicle speeds and crash results, and speed-reduction
and control strategies was reviewed. |
Methods
- More than 600 potentially relevant references were identified.
- Articles were sought from libraries, authors, and publishers.
- Sources contacted in the United States included: TRB, Institute of Transportation Engineers (ITE), FHWA, and researchers and traffic engineering
practitioners.
- Foreign sources included individual authors and research organizations in Canada, Great Britain, France, Denmark, Austria, Finland, and South
Africa.
- Analyses were conducted of existing crash record data sets from the following: NHTSA’s General Estimates System (GES), a nationwide
probability sample of police-reported crashes for 1994 through 1996; State of Florida pedestrian crash data for the years 1993 through 1996; and
NHTSA’s Fatality Analysis Reporting System (FARS) crashes resulting in pedestrian fatalities for the years 1989 through 1997.
|
| Key Terms Pedestrian, Countermeasures, Speed, Injury Severity, Traffic Calming, Engineering, Enforcement , Speed Humps,
Roundabouts, Public Information, Crashes, Chicanes |
| Key Results
Vehicle Speed and Pedestrian Injuries
Published studies:
- Previous research has shown that in 1,000 urban crashes with pedestrians younger than 20 years old, the risk of serious injury or death was 2.1
for speeds of 20 to 29 mi/h, 7.2 for speeds of 30 to 39 mi/h, and 30.7 for speeds of 40 mi/h or greater (1 mi/h = 1.61 km/h) (Pitt, Guyer,
Chung-Cheng, and Malek, 1990).
- Several studies have shown that actual travel speeds are decreased with each speed limit reduction, and each time pedestrian injuries were
reduced in frequency and severity (Jensen, 1998).
Empirical Results: Three U.S. Databases:
- GES and FARS: From 1994 through 1996, there were 5,921 pedestrian crashes in the database that involved 6,171 pedestrians. See table below for
injury severity as a function of speed values.
Speed Control Literature
- More long-lasting speed reductions in neighborhoods where vehicles and pedestrians commonly share the roadway can be achieved through engineering
approaches generally known as traffic calming.
- Countermeasures include road humps, roundabouts, other horizontal traffic deflections, and increased use of stopping.
Table A. Pedestrian injury severity as a function of speed limit (FARS (fatals) and GES, 1994–1996, all pedestrians with known injury severity).
| Pedestrian Injury Severity |
Posted Speed Limit |
Total |
| ≤20 mi/h |
25 mi/h |
30 mi/h |
35 mi/h |
40-45 mi/h |
50+ mi/h |
| Fatal (K) injury |
1.2% |
1.8% |
5.4% |
4.1% |
8.6% |
22.2% |
5.7% |
| Incapacitating (A) |
14.6% |
18.2% |
23.4% |
23.4% |
30.8% |
26.0% |
22.8% |
| Nonincapacitating (B) |
39.9% |
34.5% |
32.4% |
33.7% |
26.5% |
19.9% |
31.7% |
| Minor (C) or none |
44.3% |
45.5% |
38.7% |
38.8% |
34.1% |
31.9% |
39.7% |
| Total frequency |
11,564 |
84,948 |
45,672 |
70,810 |
45,521 |
25,013 |
279,528 |
1 mi/h = 1.61 km/h
|
| Conclusions, Recommendations, Best Practices, Design Implications, or Design Guidelines
Programs can be developed to lower overall vehicle speeds in areas where pedestrians and vehicles commonly share the roadway. Key elements to such
programs can include regulation (speed limits), signage, public information and education, enforcement, and engineering modifications. Possible steps
that should be included in these programs are:
- Enlist the involvement of community leaders.
- Perform problem identification and evaluation, and quantify pedestrian crashes and injuries.
- With full community participation, include public information and education, enforcement, and engineering components.
- Estimate the effects of the changes, not only in terms of pedestrian safety, but also in terms of traffic distribution, traffic delays, and
changes in the affected neighborhoods.
- Develop an implementation plan.
- Implement the program.
- Evaluate the program: Impact measures can include changes in speed distributions; diversion of traffic to adjoining areas; delays to motorists;
safety effects in affected areas; general public, pedestrian, and motorist knowledge of and reactions to the project; nontraffic benefits such as
improved quality of life; and cost–benefit calculations.
|
| General Comments None |
| Title Analysis of Pedestrian Conflicts With Left-Turning Traffic
(Transportation Research Record 1538, pp. 61-67) |
Funding Agency and Contact Address Transport Safety Group
Department of Civil Engineering
University of Toronto
35 St. George Street
Toronto, Ontario M5S 1A4 Canada COTR:
Not Specified |
| Authors Lord, D. |
| Publication Date 1997 |
Number of Pages 6 |
| Document Web Site None |
| Source Type Field Test |
| Driving Conditions Normal |
Vehicle Platforms Not Specified |
Objective
- Examine the interaction of left-turning vehicles and pedestrians at two types of signalized intersections using traffic conflicts.
- Compare several traffic conflict techniques.
- Test the use of a laptop computer to record the traffic conflicts.
|
| General Approach
This study provides a comparison of the safety of left turns at two types of intersections: T-intersections and X-intersections (cross-intersections). In
preparation for the comparison, several traffic conflict definitions and their application to pedestrians were evaluated. Use of a laptop computer for data
collection was tested. Eight sites taken from intersections in Hamilton, Ontario, Canada, were selected. A conflict recording methodology was developed for
T-intersections and Xintersections that consisted of recording data at various times along the paths of pedestrians and left-turning vehicles, and
recording traffic conflicts.
|
| Methods
Study Characteristics:
- Study population:Included all fixed-cycle intersections from the Hamilton database. All approaches or sites were divided into two
categories: Left turns at T-intersections and left turns at X-intersections.
- Study sites were matched and separated into four groups:
- Group 1: High vehicle and low pedestrian flows.
- Group 2: High vehicle and moderate pedestrian flows.
- Group 3: Low vehicle and low pedestrian flows.
- Group 4: Moderate vehicle and high pedestrian flows.
Traffic Conflict Definitions:
- U.S. traffic conflict technique: Consists of examining evasive actions or sudden braking.
- Classification by severity (CS): Classifies conflicts according to the severity of the evasive actions.
- Post-encroachment time (PET): This is the only one not based on evasive maneuvers.
- Time-to-collision (TTC): This uses the speed and the distance between the two road users at the time of evasive action. The first TTC
definition (TCC1) is characterized by the use of a fixed TTC, whereas the second TTC definition (TTC2) is characterized by use of a speed-dependent
TTC.
Data Collection:
- Two computer programs were written (for the pedestrian and left-turning movements, respectively).
- The computer programs allowed for the automatic recording of traffic phases without connection to the intersection controller, as well as the
recording of the various times along the path of a pedestrian and a vehicle, and the recording of traffic conflicts.
- Equipment used: Two laptop computers, measuring tape, string, chalk, spray paint, a pen, and a notebook.
- Data collection included all elements needed for the four different conflict study methods described above.
|
| Key Terms Intersections, Left-Turn Conflicts, T-Intersections, X-Intersections, Pedestrian Safety |
Key Results
- The results indicate that the number of conflicts for sites in the X-intersection category is about half that of sites in the T-intersection
category according to the U.S. and TTC1 definitions (see table A).
- For the T-intersection category, nearly 71 percent of the conflicts happened during the first 60 percent of the green phase, and about 21 percent
of the conflicts occurred during the last 10 percent of the green phase.
- Nearly 85 percent of the conflicts for the X-intersection category occurred during the second half of the green phase.
- The results show that a higher proportion of pedestrians in the T-intersection category start crossing at the end of the red phase.
- Table B shows that two of the three traffic conflict definitions produced a strong positive correlation between conflicts and the expected number
of crashes using the weighted linear regression analysis; the U.S. definition had the highest correlation coefficient. The PET definition had no
correlation and was omitted from further study.
Table A. Selected sites by category.
| |
T-Intersection Category |
X-Intersection Category |
| Site # |
E{m} x 10-4 *
Accidents/day |
Site # |
E{m} x 10-4 *
Accidents/day |
| Group 1 |
Site 1 |
26.2 |
Site 5 |
1.6 |
| Group 2 |
Site 2 |
23.0 |
Site 6 |
4.5 |
| Group 3 |
Site 3 |
4.4 |
Site 7 |
5.2 |
| Group 4 |
Site 4 |
32.7 |
Site 8 |
16.4 |
* E{m} is the mean number of conflicts.
Table B. Traffic conflict definitions and validation study.
| |
U.S. |
TTC1 |
PET |
| Linear Regression (r2) |
0.59 |
0.44 |
– |
| Spearman ranking (rs) |
0.93 |
0.90 |
0.23 |
| F-test |
20.38 |
15.60 |
– |
| F(v1,v2)(p=0.05) |
5.14 |
6.94 |
– |
| Significant |
Yes |
Yes |
– |
From Transportation Research Record 1538, Transportation Research Board, National Research Council, Washington, DC, 1996, table 2, p. 63, and
table 6, p. 66. Reprinted with permission.
|
Conclusions, Recommendations, Best Practices, Design Implications, or Design Guidelines
- The results suggest that T-intersections have a higher traffic conflict rate than X-intersections.
- The results indicate that a positive correlation between traffic conflicts and expected number of crashes exists.
- It can be concluded that categorization of a conflict at the instant of the evasive maneuver appears to be the most appropriate method.
- The U.S. definition may be a good candidate because it does not require extensive data collection. However, support of the TTC definition
appears to be gaining more general acceptance in the research community.
- A laptop computer proved to be sufficiently accurate for recording all other information, such as the times of travel along both the path of
a pedestrian and a vehicle. The use of a laptop computer to record traffic conflicts proved to be laborious and difficult.
- Recommendations for further research include the analysis of traffic conflicts between vehicles and a validation study with the expected number
of crashes. A laptop computer could still be used to record the events; however, it should be combined with a video camera. Finally, a greater
number of intersections for the analysis of the traffic conflicts is suggested.
|
| General Comments None |
| Title An Analysis of Factors Contributing to "Walking Along Roadway" Crashes: Research Study and Guidelines
for Sidewalks and Walkways (FHWA-RD-01-101) |
Funding Agency and Contact Address Office of Safety Research
and Development
Federal Highway Administration
6300 Georgetown Pike
McLean, VA 22101-2296 COTR: Carol Tan Esse |
| Authors McMahon, P.J., Zegeer, C.V., Duncan, C., Knoblauch, R.L., Stewart, J.R., and Khattak, A.J. |
| Publication Date February 2002 |
Number of Pages 47 |
| Document Web Site http://safety.fhwa.dot.gov/fourthlevel/design_p.htm#crosswalk |
| Source Type Crash/Demographic Statistical Analysis |
| Driving Conditions Normal |
Vehicle Platforms Not Specified |
Objective
- Identify roadway design factors and neighborhood socioeconomic factors that distinguish "walking along roadway" crash sites from
other matched sites in the same neighborhood and also in faraway neighborhoods.
- Suggest measures that are likely to reduce the occurrence of such crashes.
|
| General Approach A total of 47 crash sites and 94 comparison sites were analyzed. The sampling methodology matches crash
sites where pedestrians were struck walking along a roadway to comparison sites of similar zoning, parcel size, and level of development. Such roadway
factors as vehicle volume, pedestrian volume, presence of sidewalk, shoulder width, and type of roadside are included in the analysis. Census data from the
U.S. Census block group in which each site was located was attributed to that crash site in order to analyze the impact of socioeconomic and other
neighborhood factors (e.g., unemployment level, age of housing, and number of parents in the household). |
Methods
- Wake County, NC, was selected as the study area because it contains a mix of urban, suburban, and rural conditions, and 4 years of crash data
were easily available for research purposes.
- The case sites were matched with nearby (same neighborhood) and faraway (other side of town) comparison sites.
- Data collectors visited the matched sites generally during the same hour that the crash occurred at the case site. They collected pedestrian
and vehicular volumes and made detailed measurements of cross-sectional design attributes.
- Among the data elements collected at each location, the following were the key variables used in the statistical analysis: speed limit,
sidewalk (present or absent), paved shoulder width, gutter pan width, pedestrian volume, traffic volume in the outside lanes, and unpaved
walkable space.
|
| Key Terms Pedestrian Crashes, Sidewalks, Guidelines |
Key Results
- Paved shoulders were present at 61.7 percent of the crash sites, 29.8 percent of the comparison sites, and 57.4 percent of the near comparison
sites.
- There were no sidewalks on either side of the street at 80.9 percent of the sites visited, and no sidewalks at 91.5 percent of the crash sites
and 75.5 percent of the noncrash comparison sites.
- The results showed that the speed limit is clearly the dominant variable for discriminating between crash and comparison sites. Speed limit
was highly significant, while the presence of sidewalks and traffic volume are significant at levels just below and just above the 0.05 level
(see table).
- Risk ratios for speed limit and traffic volume are also shown in the table. As expected, increases in traffic volume and speed limit are
associated with a greater likelihood of a location being a crash site.
- The average median household income in the block groups of crash sites was $31,653, while it was $41,279 at noncrash, faraway comparison sites.
- Nearly 2.7 percent of the residents around crash sites take the bus to work and 2.7 percent walk. At the noncrash, faraway comparison sites,
less than 0.25 percent take the bus and 1.1 percent walk.
- The results showed that areas with more than 85 percent of households being families were 79 percent less likely to be crash sites than areas
with less than 85 percent families.
- The analysis showed that locations with less than 1.75 percent unemployment were 75 percent less likely to be crash sites compared to
neighborhoods with a greater level of unemployment.
- The model found that an unpaved shoulder of 1.2 m (4 ft) or more makes a location 89 percent less likely to be a crash site.
Table A. Results for three variable models.
| Variable |
Coefficient (Estimate) |
Standard Error |
Χ 2 |
p-Value |
Risk Ratio |
95 Percent Confidence Intervals |
| Speed Limit |
0.1094 |
0.0381 |
8.22 |
0.0041 |
1.116 |
(1.035, 1.202) |
| Paved Sidewalk |
-2.1346 |
1.077 |
3.93 |
0.0474 |
0.118 |
(0.014, 0.976) |
| Traffic Volume |
0.0019 |
0.0010 |
3.69 |
0.0549 |
1.002 |
(1.000, 1.004) |
|
Conclusions, Recommendations, Best Practices, Design Implications, or Design Guidelines
- Physical design factors found to be associated with a significantly higher likelihood of being a crash site are higher traffic volume, higher
speed limit, the lack of wide grassy walkable areas, and the absence of sidewalks.
- When these roadway factors are controlled for, nongeometric factors associated with a significantly higher likelihood of being a crash site
are high levels of unemployment, older housing, lower proportions of families within households, and more single-parent households.
- This information suggests that some neighborhoods, as a result of an increase in specific types of exposure, may be especially appropriate
sites for pedestrian safety measures such as sidewalks, lower speed roadway designs, and the addition of wide grassy shoulders.
|
| General Comments None |
| Title Pedestrian Safety and Transit Corridors (WA-RD-556.1) |
Funding Agency and Contact Address Research Office
Washington State Department
of Transportation
Transportation Building, MS 47370
Olympia, WA 98504-7370 COTR: Doug Brodin, Project Manager |
| Authors Moudon, A.V., and Hess, P.M. |
| Publication Date January 2003 |
Number of Pages 52 |
| Document Web Site http://www.wsdot.wa.gov/ppsc/research/CompleteReports/WARD556_1Ped_Safe_Transit_Corridor.pdf |
| Source Type Crash/Demographic Statistical Analysis |
| Driving Conditions N/A |
Vehicle Platforms N/A |
| Objective To examine the relationship between pedestrian crash locations on State facilities and the presence of riders
loading into and alighting from bus transit, controlling for other factors. |
| General Approach Data were examined for collisions occurring on State facilities for the 6-year period between January
1995 and December 2000. Collision data were obtained from the Washington State Department of Transportation (WSDOT) and were compiled from police reports
collected by the Washington State Patrol. |
Methods
- The study area for the project was the urbanized area of King County, WA, because it accounts for the
largest share of pedestrian/vehicle crashes in Washington State. Because of the concentration of pedestrian
accident locations (PALs) along State Route (SR) 99, separate analyses were carried for this facility and for
State facilities in King County, excluding SR 99.
- Two levels of data were examined: (1) data on individual collisions involving pedestrians on State-owned
facilities, and (2) data on locations with high concentrations of pedestrian collisions on State-owned
facilities called PALs.
- Injuries were classified into deaths, disabling injuries, evident injuries, possible injuries, and noninjuries.
- Each was assigned a societal cost by WSDOT using Federal figures.
Independent Variables:
- Pedestrian activity (bus stop use; presence of retail uses; concentrations of dwellings; and presence of a supermarket, fast food
restaurants, or school site).
- Roadway conditions (traffic volumes, roadway width and number of lanes, traffic speed and speed limits, density of intersections
along the State facility, whether a PAL site or non-PAL sample point was located on SR 99).
Dependent Variables:
- Accident designation (PAL site, sample point).
|
| Key Terms Pedestrian Safety, Transit, Pedestrian Collisions, Multimodal Facilities |
Key Results
- Pedestrian collisions are not distributed randomly along State facilities. Instead, some roadway segments have high concentrations of collisions.
To understand this, WSDOT developed the concept of PALs. A PAL is defined as four or more collisions over a 6-year period along a 0.16-km (0.1-mi)
section of roadway.
- The following three models showed consistency in the positive relationship between bus stop use and PAL sites, and thus supported the principal
hypothesis of the study. This finding suggests that facilities with high transit usage should be targeted for pedestrian safety improvements,
with specific engineering solutions adapted to specific site conditions.
- MODEL 1: PALs and Non-PAL Sample Points on All State Facilities in King County:
Only two variables were statistically
significant: (1) number of people boarding and alighting from a bus within 76 m (250 ft) of the center of a PAL or sample points expressed
in 10’s of bus users, and (2) amount of building area in retail uses within 0.40 km (0.25 mi) of the center of a PAL or sample points
expressed in 100,000’s of square feet.
- MODEL 2: SR 99 PAL and Non-PAL Sample Points:
The SR 99 model showed bus stop use as the only statistically significant
predictor of PALs. This is explained by the lack of variation in the other variables capturing pedestrian activity and road characteristics
along the route.
In addition to fairly high bus stop use, SR 99 has substantial retail activity, large numbers of housing units, four to six travel
lanes, and high traffic volumes–all factors that are likely to contribute to the large number of collisions and PALs found along
this roadway.
- MODEL 3: Non-SR 99 PAL and Non-PAL Sample Points:
The non-SR 99 model suggested that additional factors are associated with
pedestrian risk. Both traffic volume and the number of traffic lanes were statistically significant predictors of PALs. The model also
showed that adding a traffic lane would have a potentially very large effect on the likelihood of creating a PAL location. As road
widening is a standard, commonly used approach to adding vehicular capacity, the association between PALs and road width deserves
immediate further study.
|
Conclusions, Recommendations, Best Practices, Design Implications, or Design Guidelines
- The level of bus use along State highways is associated with high rates of pedestrian/vehicle collisions. It suggests that facilities with high
numbers of bus boardings or alightings need to be designed not only for cars, but also for pedestrians, allowing people to safely walk along and
across the roadway.
- Highways with many high-volume pedestrian locations need to be designed as multimodal facilities. This suggests that the major regional
facilities within local urban and suburban communities must integrate motorized and nonmotorized travel modes, with specific attention paid to
the role of transit in shaping the demand for nonmotorized travel on the facilities.
- In identifying areas of high bus stop use as areas with high pedestrian crash rates, this research helps justify mandated interagency cooperation
to plan and fund pedestrian safety improvements. The State DOT, local jurisdictions, and transit staff must work together to identify facilities
and locations where bus riders are at risk and take the appropriate steps to ensure pedestrian safety at and beyond the bus stop.
- This research suggests that reducing societal costs would be possible by focusing on the safety of people accessing transit.
|
| General Comments None |
| Title National Survey of Pedestrian and Bicyclist Attitudes and Behaviors |
Funding Agency and Contact Address U.S. Department of Transportation
400 Seventh Street, S.W.
Washington, DC 20509 COTR: Not Specified |
| Authors National Highway Traffic Safety Administration and the Bureau of Transportation Statistics |
| Publication Date 2002 |
Number of Pages 11 |
| Document Web Site http://www.walkinginfo.org/survey2002.htm |
| Source Type Survey |
| Driving Conditions N/A |
Vehicle Platforms N/A |
Objective
- Ascertain the scope and magnitude of bicycle and pedestrian activity and the public’s behavior and attitudes regarding bicycling and
walking.
- The survey findings will serve as a foundation to improve the environment and infrastructure to support these two transportation modes.
|
General Approach
- This report presents highlights of the 2002 National Survey of Pedestrian and Bicyclists Attitudes and Behaviors
- The survey was collected by telephone during the period of June 11 to August 20, 2002. Survey respondents were asked to provide information
about their overall bicycling and walking behaviors during the past 30 days with a focus on individual trips taken on the most recent day they
bicycled or walked during that period.
|
| Methods
Survey questions were asked on the following topics:
- Frequency of bicycling and walking.
- Trip information, including origin, destination, trip time, trip distance, land use of origin/destination, trip purpose, facility use, and
topography.
- Reasons for not bicycling and or/walking.
- Perception of safety.
- Safety practices.
- Facilities availability (e.g., sidewalk or path).
- Community design.
- Safe routes to school.
- Sociodemographics.
|
| Key Terms Pedestrian, Bicyclist, Safety, Infrastructure |
| Key Results
Amount of Bicycling and Trip Information:
- Prevalence of bicycling: About 27.3 percent of the driving age public reported that they rode a bicycle at least once during summer 2002.
This equates to approximately 57 million persons age 16 or older who rode a bicycle. Males were more likely to ride a bicycle (34 percent) than
were females (21.3 percent).
- Number of reported trips: An estimated 91 million bicycling trips were made during summer 2002.
- Bicycling trip lengths: The average length of a bicycling trip taken on a typical day during the summer was 6.3 km (3.9 mi). About
38.6 percent of the trips were less than 1.6 km (1 mi), while 7.3 percent were more than 16.1 km (10 mi) in length.
- Facilities used for bicycling trips: Bicyclists took roughly 44 million trips on paved roads, not on shoulders. Other facilities used
for bicycling trips included: sidewalks (13.6 percent), bicycle paths/walking paths/trails (13.1 percent), shoulders of paved roads (12.8 percent),
bicycle lanes on roads (5.2 percent), unpaved roads (5.2 percent), and other (2.1 percent).
- Views on the design of communities for bicycling safety: One-half of all adults age 16 or older are "very" or "somewhat
" satisfied with how their communities are designed with regard to bicyclist safety (50.2 percent). Almost half of the respondents reported
the need for changes (46.9 percent).
- Reported changes included: Providing bicycle facilities (e.g., bicycle trails, paths, lanes, racks, traffic signals, lighting, or
crosswalks) (73 percent), improving existing bicycle facilities (7.8 percent), changing existing laws governing bicycles (7.3 percent),
initiating bicycle safety education (6.7 percent), making areas for bicycling safer (6.0 percent), enforcing laws governing bicycling
(3.6 percent), and other (7.2 percent).
Amount of Walking and Trip Information:
- Prevalence of walking: Eight out of 10 of the driving age public (78.7 percent) reported that they walked, ran, or jogged outdoors for
5 min or more at least once during summer 2002. This represents approximately 164 million pedestrians age 16 or older. Older adults (age 65 or
older) were much less likely to walk than persons of younger ages.
- Number of reported trips: An estimated 275 million walking trips were made during summer 2002.
- Walking trip lengths: The average length of a walking tip taken on a typical day during the summer was 1.9 km (1.2 mi). More than
one-quarter of the trips (26.9 percent) were shorter than 0.40 km (0.25 mi), while 14.8 percent of trips were more than 3.2 km (2 mi) in length.
- Facilities used for walking trips: Pedestrians took about 124 million trips on sidewalks (45.1 percent), although many also walked on
paved roads, not on shoulders (24.8 percent). Other facilities used for walking trips included: shoulders of paved roads (8.4 percent), unpaved
roads (8.0 percent), bicycle paths/walking paths/trails (5.8 percent), grass or fields (4.9 percent), and other (3.0 percent).
- Views on the design of communities for walking safety: Nearly three out of four adults age 16 or older were "very" or "
somewhat satisfied" with how their communities were designed for pedestrian safety (74.1 percent). Thirty-four percent of adults age 16 or
older recommended a variety of changes to their communities for pedestrians.
- Reported changes included: Providing pedestrian facilities (e.g., sidewalks, traffic signals, lighting, or crosswalks) (74.7 percent),
improving existing pedestrian facilities (12.5 percent), enforcing laws governing pedestrians (5.1 percent), making areas for walking
safer (4.7 percent), changing existing laws governing pedestrians (2.8 percent), and other suggestions (8.7 percent).
|
| Conclusions, Recommendations, Best Practices, Design Implications, or Design Guidelines See Key Results above. |
| General Comments None |
| Title An Evaluation of High-Visibility Crosswalk Treatments: Clearwater, Florida (FHWA-RD-00-105) |
Funding Agency and Contact Address Office of Safety Research
and Development
Federal Highway Administration
6300 Georgetown Pike
McLean, VA 22101-2296
COTR:
Carol Tan Esse |
| Authors Nitzburg, M., and Knoblauch, R.L. |
| Publication Date August 2001 |
Number of Pages 19 |
| Document Web Site http://www.tfhrc.gov/safety/pedbike/index.cfm |
| Source Type Field Test |
| Driving Conditions Normal, Degraded (Nighttime) |
Vehicle Platforms Not Specified |
Objective
- Evaluate the effect of novel, illuminated overhead crosswalk signs and high-visibility ladder-style crosswalk markings on driver and pedestrian
behavior at nonsignalized intersections in Clearwater, FL.
- Determine whether: (1) pedestrians were more likely to cross where there was an illuminated overhead crosswalk sign and ladder crosswalk
markings; (2) drivers would yield more often to pedestrians using this novel pedestrian facility; and (3) pedestrians use more, less, or the
same amount of caution, as well as whether they cross more aggressively.
|
| General Approach An experimental and control evaluation procedure was used. The two experimental sites had illuminated
overhead crosswalk signs and high-visibility ladder crosswalk markings, as well as standard crossing signs and mid-crossing refuge islands. One control
location was a midblock crossing with two standard parallel crosswalk markings and crossing signs located in advance of and at the midblock crossing. The
second control site was a four-leg nonsignalized intersection with no marked crosswalks and no advance warning signs. |
Methods
- A team of two researchers collected data during daytime and nighttime hours over a 10-day period.
- The following three procedures were conducted:
- Pedestrian Entry/Magnet Study: To determine whether pedestrians tended to cross at or near intersections with illuminated
overhead signs. The precise location and number of pedestrians entering the roadway to cross at the two experimental sites and two control
sites were recorded.
- Right-of-Way and Staged Pedestrian Studies: To determine how often drivers yield the right of way to pedestrians and to
determine how often pedestrians forced the right of way, requiring drivers to stop. The number of drivers that passed the pedestrian
attempting to cross, or did not yield once crossing had begun, were recorded. Other data items recorded included the age and number of
pedestrians in a group, travel path, and any running or rushing. During the staged pedestrian study, an experimenter took a step into
the crosswalk.
- Pedestrian Profile Study: To determine if pedestrians were more likely to cross in the experimental crosswalks than the
control and to observe the safety measures pedestrians take before and during crossings. Data were collected using an audio tape
recorder. Pedestrian origin/destination and travel path information were recorded using site diagrams.
|
| Key Terms Pedestrians, Safety, Crosswalks, High-Visibility Crosswalks |
Key Results
- There was a significant difference in drivers yielding for pedestrians during daytime conditions (see table A). Significantly more drivers
yielded for pedestrians at the experimental sites than at the control sites for both halves of crossing (43.2 percent and 40.3 percent for the
experimental sites and 2.8 percent and 20.0 percent for the control sites). There was an increase in drivers yielding at experimental sites at
night; however, the difference was not significant.
- The amount of pedestrians that used the crosswalks was significantly higher at the experimental sites than at the control sites (see table B).
- High-visibility crosswalk treatments did not have an effect on either pedestrian running frequency or on the occurrence of pedestrian/vehicle
conflicts.
Table A. Clearwater: Percentage of vehicles stopping for pedestrians—daylight.
| Site No. |
Site Type |
Percentage of First Vehicles Stopping |
| 1st Half of Crossing |
2nd Half of Crossing |
Both Halves of Crossing |
| 1 |
Experimental: High-visibility crosswalk, refuge island |
30.2 |
59.5 |
43.2 |
| 2 |
Control: No crosswalk markings, intersection |
0.0 |
11.1 |
2.8 |
| 3 |
Experimental: High-visibility crosswalk, refuge island |
39.7 |
40.8 |
40.3 |
| 4 |
Control: Standard crosswalk marking, midblock |
6.3 |
53.8 |
20.0 |
Table B. Clearwater: Percentage of pedestrians using the crosswalk for the first and second halves of the crossing.
| Site No. |
Site Type |
Percentage of Pedestrians Using Crosswalk |
| 1st Half of Crossing |
2nd Half of Crossing |
| 1 |
Experimental: High-visibility crosswalk, refuge island |
92.9 |
77.6 |
| 2 |
Control: No crosswalk markings, intersection |
56.5 |
39.1 |
| 3 |
Experimental: High-visibility crosswalk, refuge island |
91.1 |
82.3 |
| 4 |
Control: Standard crosswalk marking, midblock |
98.0 |
72.5 |
|
Conclusions, Recommendations, Best Practices, Design Implications, or Design Guidelines
- Drivers were more likely to yield when the high-visibility crosswalk markings were present.
- A large increase in crosswalk use by pedestrians (35 percent) was noted, along with no change in pedestrian overconfidence, running, or conflicts.
- It was concluded that the high-visibility crosswalk treatments had a positive effect on pedestrian and driver behavior on the relatively narrow
low-speed crossings that were studied.
|
| General Comments Additional work is needed to determine if high-visibility crosswalk treatments will also have a desirable
effect on wider, higher speed roadways. |
| Title Guidebook on Methods to Estimate Non-Motorized Travel: Overview of Methods (FHWA-RD-98-165) |
Funding Agency and Contact Address
Federal Highway Administration
6300 Georgetown Pike
McLean, VA 22101-2296
COTR:
Carol Tan Esse and Ann Do |
| Authors Schwartz, W.L., Porter, C.D., Payne, G.C., Suhrbier, J.H., Moe, P.C., and Wilkinson, W.L. |
| Publication Date July 1999 |
Number of Pages 35 |
| Document Web Site http://www.tfhrc.gov/safety/intersect.htm |
| Source Type Guidelines |
| Driving Conditions N/A |
Vehicle Platforms N/A |
| Objective To create a guidebook that provides a means for practitioners to better understand and estimate bicycle and
pedestrian travel and to address transportation planning needs. |
| General Approach This guidebook describes and compares the various methods that can be used to forecast nonmotorized
travel demand or otherwise support the prioritization and analyses of nonmotorized projects. These methods are categorized according to four major purposes:
(1) demand estimation, (2) relative demand potential, (3) supply quality analysis, and (4) supporting tools and techniques. Discrete choice models,
regional travel models, sketch plan methods, facility demand potential, bicycle compatibility measures, and geographic information systems are among the
methods and tools described. |
Methods
- This guidebook is based on an extensive international review of both published and unpublished sources
- Most of the methods were developed in the United States and Europe; however, examples are also included from Japan, Australia, and South
America.
|
| Key Terms Bicycle, Pedestrian, Travel Demand, Forecasting Methods, Estimate |
| Key Results Demand Estimation: The following is a list of demand estimation methods, along with advantages and
disadvantages.
- Aggregate behavior studies: The simplest form of demand forecasting, comparison studies compare usage levels before and after a change,
or compare travel levels across facilities with similar characteristics. The results can be used to predict the impacts on nonmotorized travel of
a similar improvement in another situation.
- Advantages: This method is simple to understand and relatively easy to apply.
- Disadvantages: Comparison studies only provide a rough estimate of demand for proposed facilities. They may not control for
other factors unrelated to the facility improvement.
- Sketch plan methods: Defined as a series of simple calculations to estimate the number of facility users. Generally, they rely on
data that already exist or can be collected with relative ease.
- Advantages: These methods tend to be relatively simple to understand and apply.
- Disadvantages: These methods can be imprecise and may not account well for specific local conditions such as the characteristics
of the facility, network, surrounding population, destinations, or competing modes of travel.
- Discrete choice models: This model predicts a decision made by an individual as a function of any number of variables, including factors
that describe a facility improvement or policy change.
- Advantages: Discrete choice models based on local survey data are the most accurate tool available for predicting travel
behavior impacts.
- Disadvantages: Development of a discrete choice model generally requires the collection of extensive survey data and requires
expertise in discrete choice modeling techniques.
- Regional travel models: These models use existing and future land-use conditions and transportation network characteristics in
conjunction with models of human behavior to predict future travel patterns.
- Advantages: Given sufficient data collection, these models serve as a powerful tool.
- Disadvantages: The current generation of these models was developed for automobiles rather than bicycle or pedestrian travel.
They may also require significant data collection.
Relative Demand Potential: The following is a list of relative demand methods, along with advantages and disadvantages.
- Market analysis: This is a model that estimates the potential number of trips based on current trip-length distributions, rules of thumb,
and the percentage of the population likely to switch to bicycling or walking.
- Advantages: These types of analyses can be helpful in identifying areas of greatest potential demand.
- Disadvantages: They are intended only to achieve rough estimates of the maximum number of trips.
- Facility demand potential: These methods prioritize facility improvements according to the areas of highest potential demand.
- Advantages: Theses methods can frequently be constructed from readily available data sources such as the census and local
land-use databases.
- Disadvantages: They only indicate relative levels of demand between areas.
Supply Quality Analysis: The following is a list of supply quality analysis methods, along with advantages and disadvantages.
- Bicycle and pedestrian compatibility measures: These measures combine factors such as motor vehicle traffic volume and speeds, lane
or sidewalk width, pavement quality, and pedestrian amenities into an index of overall suitability for travel.
- Advantages: Can serve as useful means of prioritizing facilities for improvement, as well as determining which improvements
will be most beneficial.
- Disadvantages: Existing indices primarily rate individual segments rather than describing the overall compatibility of a route.
Supporting Tools and Techniques: The following is a list of supporting tools and techniques, along with advantages and disadvantages.
- Geographic information systems (GIS): GIS relate environmental and population data in a spatial framework using location points, lines,
and polygons.
- Advantages: Can greatly increase the ease of analyzing data relevant to nonmotorized travel forecasting.
- Disadvantages: They require considerable user skill, as well as specialized software.
|
Conclusions, Recommendations, Best Practices, Design Implications, or Design Guidelines
- The following are options a bicycle or pedestrian planner has to estimate future levels of nonmotorized travel: Comparisons of proposed projects
with usage on similar existing projects, calculations based on census and other available local data and assumptions, aggregate and disaggregate
behavior models to predict travel choices, and inclusion of bicycle and pedestrian factors in existing regional travel models. Also, the planner
may choose to look at measures of the potential market rather than forecasting demand.
- The best approach for any particular situation will depend on available knowledge, data, and financial and technical resources, as well as the
specific purpose for which the demand forecasts are being developed.
- Planners should be aware of the limitations, as well as the advantages, of existing methods, and should supplement quantitative forecasts with
the judgment of local practitioners and advocates when planning projects.
- Recommended future efforts include: Development of a manual for bicycle and pedestrian sketch planning, further research on factors influencing
nonmotorized travel behavior, and integration of bicycle and pedestrian considerations into mainstream transportation models and planning.
|
| General Comments None |
| Title Guidelines and Recommendations to Accommodate Older Drivers and Pedestrians (FHWA-RD-01-051) |
Funding Agency and Contact Address Office of Safety Research
and Development
Federal Highway Administration
6300 Georgetown Pike
McLean, VA 22101-2296
COTR:
Joseph Moyer, Elizabeth Alicandri, and Kelley Pecheux |
| Authors Staplin, L., Lococo, K., Byington, S., and Harkey, D. |
| Publication Date May 2001 |
Number of Pages 86 |
| Document Web Site http://www.tfhrc.gov/safety/pedbike/index.cfm |
| Source Type Guidelines and Recommendations |
| Driving Conditions Normal |
Vehicle Platforms All |
| Objective To update, revise, and expand the scope of the Older Driver Highway Design Handbook published by FHWA
in 1998. |
| General Approach This guidelines and recommendations document incorporates new research findings, technical developments,
and extensive feedback from State, county, and municipal engineers who reviewed and applied recommendations from the 1998 publication. Guidance on how and
when to implement the recommendations is included, as well as codes that indicate, at a glance, the relationship of each recommendation to standard
design manuals. |
Methods
- Recommendations are provided for the following highway elements: Intersections (at-grade), interchanges (grade separation), roadway curvature and
passing zones, construction/work zones, highway-rail grade crossings.
- Supplemental technical notes are provided on the following topics: Aging and driver capabilities, driver license renewal requirements, and
measuring the visibility of highway treatments.
|
| Key Terms Safety, Highway Design, Highway Operations, Driver Age, Driver Performance, Human Factors, Vision, Attention,
Perception, Cognition, Memory, Physical Ability, Risk Perception, Hazard Perception. |
| Key Results Recommendations are provided and discussed in detail for the following areas:
- Recommendations for 17 different design elements in order to accommodate the needs and enhance the performance of road users with age-related
diminished capabilities as they approach and negotiate intersections:
- Intersecting angle (skew).
- Receiving lane (throat) width for turning operations.
- Channelization.
- Intersection sight distance requirements.
- Offset (single left-turn lane geometry, signage, and delineation).
- Edge treatments/delineation of curbs, medians, and obstacles.
- Curb radius.
- Traffic control for left-turn movements at signalized intersection.
- Traffic control for right-turn/right turn on red (RTOR) movements at signalized intersections.
- Street-name signage.
- One-way/wrong-way signage.
- Stop- and yield-controlled intersection signage.
- Devices for lane assignment on intersection approach.
- Traffic signals.
- Fixed-lighting installation.
- Pedestrian crossing design, operations, and control.
- Roundabouts.
- Recommendations for design elements to enhance the performance of diminished-capacity drivers at interchanges:
- Exit signage and exit ramp gore delineation.
- Acceleration/deceleration lane design features.
- Fixed-lighting installations.
- Traffic control devices for restricted or prohibited movements of freeways, expressways, and ramps.
- Recommendations to enhance the performance of diminished-capacity drivers as they negotiate roadway curvature and passing zones, focusing on
four design elements:
- Pavement marking and delineation on horizontal curves.
- Pavement width on horizontal curves.
- Crest vertical curve length and advance signage for sight-restricted locations.
- Passing zone length, passing sight distance, and passing/overtaking lanes on two-lane highways.
- Recommendations to enhance the performance of diminished-capacity drivers as they approach and travel through construction/work zones, keyed
to five specific design elements:
- Lane closure/lane transition practices.
- Portable changeable (variable) message signage practices.
- Channelization practices (path guidance).
- Delineation of crossovers/alternative travel paths.
- Temporary pavement markings.
|
| Conclusions, Recommendations, Best Practices, Design Implications, or Design Guidelines The following are age-related
changes that may affect driving ability: Reductions in acuity, contrast sensitivity, and visual field; restrictions in the area of visual attention;
increased sensitivity to glare; slower dark adaptation; decreased motion sensitivity; selective attention; divided attention; perception-reaction time
(PRT); working memory; limb strength; flexibility, sensitivity, and/or range of motion; and head/neck and trunk flexibility. |
| General Comments This document contains the updated recommendations and information on how to apply the Handbook. These
are excerpted from the full report (FHWA-RD-01-103), which also includes a detailed discussion of the rationale and supporting evidence for each
recommendation. |
| Title Injuries to Pedestrians and Bicyclists: An Analysis Based on Hospital Emergency Department Data (FHWA-RD-99-078)
|
Funding Agency and Contact Address Office of Safety Research
and Development
Federal Highway Administration
6300 Georgetown Pike
McLean, VA 22101-2296
COTR:
Carol Tan Esse |
| Authors Stutts, J.C., and Hunter W.W. |
| Publication Date 1999 |
Number of Pages 133 |
| Document Web Site http://www.tfhrc.gov/safety/pedbike/index.cfm |
| Source Type Crash/Demographic Statistical Analysis |
| Driving Conditions Normal |
Vehicle Platforms Not Specified |
| Objective To provide a more accurate description of the entire spectrum of events causing injury to pedestrians and
bicyclists as an aid to more effective countermeasure and program development. |
| General Approach This report presents a descriptive analysis of data collected prospectively at eight hospital emergency
departments over approximately a 1-year time period in three States: California, New York, and North Carolina. Information was gathered on 2,509 persons
treated for injuries incurred while bicycling or walking. The emergency department data were also examined in conjunction with statewide hospital discharge
and motor vehicle crash data in an attempt to better define the overall scope and magnitude of the pedestrian and bicyclist injury problem. |
Methods
- Three States were identified and invited to participate in the study: California, New York, and North Carolina.
- In each of the three States, two or three hospital emergency departments were identified for participation. A special survey form was developed
for use in recording information about pedestrian and bicyclist cases to be included in the study.
- The emergency department survey forms were analyzed using SAS statistical software. Project staff also obtained computer files of the hospital
discharge data.
- Motor vehicle crash data were obtained from each of the States corresponding to the available hospital data.
|
| Key Terms Bicycle Injury, Pedestrian Injury, Bicycle Fall, Pedestrian Fall, Nonroadway, Nonmotor Vehicle, Alcohol |
| Key Results Bicyclist Injury Events:
- Seventy percent of the reported bicycle injury events did not involve a motor vehicle.
- Thirty-one percent occurred in nonroadway locations.
- Fifty-five percent of bicyclist injuries that occurred on the roadway did not involve a motor vehicle.
- Eight percent of bicycle/motor vehicle collisions occurred in nonroadway locations.
- Children were more likely to be involved in bicycle-only events, while adults were more likely to be involved in bicycle/motor vehicle
collisions.
- Overall, about three times as many males were involved as females.
- White bicyclists comprised just over half of those injured in bicycle/motor vehicle collisions.
- Overall, 84 percent of the bicyclists were treated and released, and 13 percent were hospitalized. Almost one-quarter of the bicyclists injured
in collisions on the roadway were hospitalized, compared to less than 10 percent for the other event categories.
- Bicycle-only injuries sustained on driveways and off-road trails were more likely to require hospitalization.
Pedestrian Injury Events:
- Sixty-four percent of the reported pedestrian injury events did not involve a motor vehicle.
- Fifty-three percent occurred in nonroadway locations.
- Thirty percent of pedestrian injuries that occurred on the roadway did not involve a motor vehicle.
- Twelve percent of pedestrian/motor vehicle collisions occurred in nonroadway locations.
- Children under the age of 15 represent 39 percent of the pedestrians struck by motor vehicles on the roadway, and 37 percent of those struck in
a nonroadway location.
- Collisions involving motor vehicles and pedestrian-only events occurring on the roadway were more likely to involve males, while
pedestrian-only events in nonroadway locations were more likely to involve females.
- Just over half of the nonroadway pedestrian/motor vehicle events occurred in parking lots.
- Sidewalk locations were particularly common for children under age 15 and senior adults age 65+.
- Overall, 79 percent of the pedestrians were treated and released, and 19 percent were hospitalized.
- Nearly 40 percent of the pedestrians struck on the roadway were hospitalized, as well as 30 percent of those struck on a sidewalk, in a
parking lot, or at another nonroadway location.
Alcohol Use by Injured Pedestrians and Bicyclists:
- Pedestrian/Motor Vehicle Events:
- The vast majority of pedestrians who had been drinking were struck on the roadway.
- Overall, 14 percent had been drinking.
- Pedestrian-Only Events:
- About 60 percent of the pedestrians who had been drinking were injured on a sidewalk.
- Overall, 7 percent had been drinking.
- Bicycle/Motor Vehicle Events:
- Virtually all of the bicyclists who had been drinking were struck on the roadway.
- Overall, 11 percent had been drinking.
- Bicycle-Only Events:
- More than 80 percent of bicyclists who had been drinking were injured on the roadway.
- Overall, 6 percent had been drinking.
|
Conclusions, Recommendations, Best Practices, Design Implications, or Design Guidelines
- The results show that 70 percent of the reported bicycle injury events and 64 percent of the reported pedestrian injury events did not involve
a motor vehicle.
- Thirty-one percent of the bicyclists and 53 percent of the pedestrians were injured in nonroadway locations such as sidewalks, parking lots,
or off-road trails.
- Alcohol was a factor in one-quarter of the pedestrian/motor vehicle injury events and 15 percent of the bicycle/motor vehicle injury events
for those age 20 and older.
|
| General Comments None |
| Title Canadian Research on Pedestrian Safety (FHWA-RD-99-090) |
Funding Agency and Contact Address Federal Highway Administration
6300 Georgetown Pike
McLean, VA 22101-2296
COTR:
Carol Tan Esse |
| Authors Van Houten, R., and Malenfant, J.E.L. |
| Publication Date December 1999 |
Number of Pages 25 |
| Document Web Site http://www.walkinginfo.org/rd/international.htm |
| Source Type Literature Review |
| Driving Conditions Normal |
Vehicle Platforms All |
| Objective This report was one in a series of pedestrian safety synthesis reports prepared for FHWA to document pedestrian
safety in other countries. |
| General Approach This paper reviews Canadian research carried out in six areas of pedestrian safety. |
| Methods The following six areas of pedestrian safety are reviewed:
- Interventions to prompt pedestrians to watch for turning vehicles.
- Improvement of pedestrian signals for better indication of the clearance interval.
- Use of pedestrian-activated beacons at uncontrolled crossings.
- Use of advance stop lines.
- Increase in the conspicuity of crosswalks.
- Use of multiple interventions to increase the frequency of motorists yielding to pedestrians.
|
| Key Terms Pedestrians, Flashing Beacons, Crosswalks, Pedestrian Signals, Moving Eyes Display, Pedestrian Signs,
Advance Stop Lines. |
| Key Results Interventions to Prompt Pedestrians to Watch for Turning Vehicles:
- Previous research is discussed that tested the use of adding animated eyes to the pedestrian walk display (Van Houten, Van Houten, Malenfant,
and Retting, 1998):
- EYES display was used for the first 2.5 s, followed by the standard pedestrian symbol: The use of the EYES display led to a marked
increase in pedestrians’ observing behavior and a marked reduction in pedestrian/motor vehicle conflicts for pedestrians leaving
early during the WALK interval (from 2.7 conflicts per 100 crossings to 0.5 conflicts per 100 crossings). However, most pedestrians would
not begin to cross until the standard “WALK” indication appeared.
- EYES display used simultaneously with the standard walking man symbol: This presentation method produced the same benefits as the
sequential presentation method, and pedestrians did not lose any available WALK time.
- EYES display and standard walking man symbol were displayed simultaneously for 2.5 s, then the EYES display was turned off and reappeared
for 2.5 s every 9.5 s: This presentation method maintained high levels of observingbehavior and near zero levels of pedestrian/motor vehicle
conflicts that persisted for pedestrians that left the curb during the entire WALK interval.
- Pedestrian survey: The results indicated that all of the respondents identified the EYES display as eyes and they understood the purpose
was to tell them to look. Peoples’ reactions to the signal were very positive and enthusiastic, and most of the respondents indicated
that they would like to see the EYES display implemented elsewhere.
Improvement of Pedestrian Signals for Better Indication of the Clearance Interval:
- Pedestrian survey (Gourvil, Pellerin, and Hassan, 1994): The results of the pedestrian survey indicated that the tricolored pedestrian
head was better understood than the standard pedestrian head. There was no difference in pedestrian understanding between the standard pedestrian
heads and the tricolored heads for the “WALK” and “DON’T WALK” indications; however there was an increase in the
understanding of the yellow silhouetted pedestrian when compared to the flashing orange hand to prompt pedestrians not to begin to cross (79 percent
vs. 58 percent, respectively). Although pedestrians better understood the tricolored pedestrian heads, the majority of those surveyed did not
prefer them to the standard pedestrian devices.
- Observations of pedestrian behavior: The observations indicated that the tricolored pedestrian heads did not increase pedestrian
compliance at crosswalks.
Use of Pedestrian-Activated Beacons at Uncontrolled Crossings:
- The results of the research in this area indicated that: (1) adding the pedestrian symbol next to the flashing beacons or adding a sign prompting
motorists to stop when the amber beacons are flashing are both effective in increasing the percentage of drivers yielding to pedestrians, (2) the
combination of both of the above-mentioned interventions is more effective in increasing driver yielding to pedestrians than either used alone, and
(3) conflicts were only reduced by the sign prompting motorists to stop when the amber beacons are flashing (Van Houten, et al., 1998).
Use of Advance Stop Lines:
- Previous research indicates that using a “Stop Here for Pedestrians” sign placed 15.25 m before each side of a crosswalk traversing
a multilane highway can increase the distance that motorists stop behind the crosswalk and that the effects persisted over time (Van Houten and
Malenfant, 1992). This was also found with the sign plus advance stop bars. Data on vehicle/pedestrian conflicts indicated that the sign alone
reduced conflicts involving the driver or pedestrian taking evasive action by 67 percent. The addition of the advance stop line reduced this type
of conflict by 90 percent compared to baseline levels.
|
Conclusions, Recommendations, Best Practices, Design Implications, or Design Guidelines
- Prompting pedestrians to look for turning vehicles with signs, pavement markings, or adding animated eyes to the pedestrian signal have been
documented to reduce conflicts between vehicles and pedestrians, while the addition of a countdown timer for the clearance interval has not been
associated with safety benefits.
- In regard to pavement markings, the addition of advance stop lines has produced a reduction in motor vehicle/pedestrian conflicts, while
increasing the conspicuity of crosswalks has not done so.
- Although the use of pedestrian-activated beacons has made it easier for pedestrians to cross the street, the safety value of this intervention
has not been clearly demonstrated.
- Several studies have shown that the use of special signs and markings may make crosswalks with pedestrianactivated beacons safer.
- Research also indicates that multifaceted pedestrian safety programs can change community safety culture by modifying the behavior of drivers
and pedestrians.
|
| General Comments None |
| Title Selecting Roadway Design Treatments to Accommodate Bicycles (FHWA-RD-92-073) |
Funding Agency and Contact Address Office of Safety
Federal Highway Administration
400 Seventh Street, S.W.
Washington, DC 20590
COTR:
John Fegan |
| Authors Wilkinson, W.C., III, Clarke, A., Epperson, B., and Knoblauch, R. |
| Publication Date January 1994 |
Number of Pages 37 |
| Document Web Site http://www.bikewalk.org/technical_assistance/case_studies.htm |
| Source Type Literature Review, Guidelines |
| Driving Conditions Normal |
Vehicle Platforms All |
| Objective To provide comprehensive guidelines for the purpose of assisting transportation planners and engineers in
selecting roadway design treatments to accommodate bicycles. |
| General Approach The recommendations are based on assumptions regarding policy goals and the types of bicyclists to be
accommodated, the state of the practice, and professional judgment. |
| Methods This manual describes the assumptions, principles, and approaches used to develop the recommendations; provides
a model planning process for identifying a network of routes on which designated bicycle facilities should be provided to accommodate bicyclists of moderate
ability (casual adult riders and children); and recommends design treatments and specifications for roadways to serve different types of bicyclists under
various sets of traffic operations factors. |
| Key Terms Bicycles, Bicycle Facilities, Transportation Planning, Highway Design |
| Key Results Developing a Bicycle Network Plan: To accommodate group A bicyclists (advanced), planners and engineers
should refer to the AASHTO Guide during the planning process for streets and highways. However, group B/C bicyclists (basic adult and children) value
characteristics such as designated bicycle facilities and lower traffic volumes. The location of these facilities is best determined through a planning
process that seeks to determine where designated facilities are needed and the type of bicycle facilities that should be provided. The following details a
planning process:
- Establish performance criteria for the bicycle network: Performance criteria can include: Accessibility, directness, continuity,
route attractiveness, low conflict, cost, and ease of implementation.
- Inventory existing system: Both existing roadway systems and any existing bicycle facilities should be inventoried and evaluated.
The condition location and level of use should be recorded. An inventory of the roadway system could include: Annual average daily traffic
(AADT) counts, number of traffic lanes, width of the outside lane, posted speed limit, pavement condition, and certain geometric factors.
- Identify bicycle travel corridors: Travel corridors can be thought of as “desire lines” connecting neighborhoods that
generate bicycling trips with other zones that attract a significant number of trips. A good way to estimate desire lines for bicyclists is based
on the existing pattern of motor vehicle flows. The simplest way to do this is to multiply the AADT of each segment of the road by the bicycle
mode split (percentage of all trips that are made by bicycle) for the community or region.
- Evaluate and select specific route alternatives: The next step is to select specific routes within these corridors that can be
designed or adapted to accommodate group B/C bicyclists.
- Select appropriate design treatments: The principal variables affecting the applicability of a design treatment are: design bicyclist,
type of roadway project involved on the selected route, and traffic operations factors.
- Evaluate the finished network plan using the established performance criteria: Evaluate whether the proposed network meets the criteria
established at the start of the process.
Design Selection and Specifications:
- Types of facilities: The following five basic types of facilities are used: Shared lane, wide outside lane, bicycle lane, shoulder,
and separate bicycle path.
- Designating bicycle facilities: Because group B/C bicyclists prefer designated facilities for bicycle use, some designation should
be included when using bicycle lanes or shoulders. When design treatments are provided primarily to serve group A riders, designation is optional.
- Preparing to select a facility treatment: The following factors must be assessed when determining the appropriate highway design
treatment to accommodated bicyclists: Types of bicyclist the route is most likely to serve, type of roadway project that is involved (new
construction, reconstruction, or retrofit), and current and anticipated traffic operations and design characteristics of the route that will
affect the choice of a bicycle design treatment.
|
| Conclusions, Recommendations, Best Practices, Design Implications, or Design Guidelines Types of Bicycle Facilities:
- Shared lanes: Shared lanes typically feature 3.6-m (12-ft) lane widths or less, with no shoulders. In residential areas with low motor
vehicle traffic volumes and average motor vehicle speeds of less than 48.3 km/h (30 mi/h), this should present no problem for group A and normally
be adequate for group B/C bicyclists. With higher speeds and traffic volumes, shared lanes become less attractive routes.
- Special design treatments: The following four general types of bicycle facilities can improve upon shared roadways where traffic
volumes or speeds make it prudent to do so: Wide curb lanes, bicycle lanes, shoulders, and separate bicycle paths.
|
| General Comments None |
| Title
Pedestrian Facilities Users Guide: Providing Safety and Mobility (FHWA-RD-01-102)
|
Funding Agency and Contact Address
Office of Safety Research
and Development
Federal Highway Administration
6300 Georgetown Pike
McLean, VA 22101-2296
COTR: Carol Tan Esse and Ann Do |
| Authors
Zegeer, C.V., Seiderman, C., Lagerwey, P., Cynecki, M., Ronkin, M., and Schneider, R. |
| Publication Date March 2002 |
Number of Pages 162 |
| Document Web Site
http://www.tfhrc.gov/safety/pedbike/index.cfm |
| Source Type
Literature Review, Guidelines and Recommendations |
| Driving Conditions
Normal |
Vehicle Platforms All |
| Objective
To provide useful information on how to identify the safety and mobility needs of pedestrians within roadway rights of way. |
| General Approach
This guide is intended primarily for engineers, planners, safety professionals, and decisionmakers; however, it may also be used by citizens for
identifying pedestrian tools to improve the safety and mobility of those who walk. |
Methods
- Chapter 1 gives an overview of the creation of a walkable environment.
- Chapter 2 describes basic pedestrian crash trends and the examination and classification of crash types to determine appropriate countermeasures.
- Chapter 3 defines 13 pedestrian crash-type groupings and factors important in selecting the best countermeasures. These crash groupings are
then presented in terms of how to select pedestrian safety improvements to address specific crash problems.
- Chapter 4 contains the details of 47 different engineering improvements for pedestrians. These improvements relate to the walking environment,
roadway design, intersection treatments, traffic calming, traffic management, and signals and signs. Chapter 4 also provides a simplified list of
improvements to address certain broad objectives (e.g., reducing speeds on a street, reducing pedestrian exposure) without the need for pedestrian
crash data.
|
| Key Terms
Pedestrian Crashes, Traffic Calming, Pedestrian Facilities |
| Key Results
Pedestrian Crash Factors:
- This section discusses pedestrian crash statistics, pedestrians most at risk, alcohol impairment, speeding, times of occurrence, area type and
location, and crash types and countermeasures.
Selecting Pedestrian Safety Improvements:
- Methods to improve pedestrian safety: The following is a list of pedestrian safety improvements:
- Provision of pedestrian facilities such as sidewalks and crosswalks.
- Roadway and engineering measures such as traffic control devices.
- Implementation of lighting and roadway design strategies.
- Programs to enforce existing traffic laws and ordinances for motorists.
- Forgiving vehicle designs that minimize pedestrian injury.
- Wearing of reflective clothing and materials.
- Educational programs.
Tools:
- Pedestrian facility design: The following facilities are discussed in detail: Sidewalks or walkways, curb ramps, marked crosswalks and
enhancements, transit stop treatments, roadway lighting improvements, pedestrian overpasses/underpasses, and street furniture/walking environment.
- Roadway design: The following design topics are discussed in detail: Bicycle lanes, roadway narrowing, reducing the number of lanes,
driveway improvements, raised medians, one-way/two-way street conversions, curb radius reduction, and improved right-turn slip-lane design.
- Intersection design:
- Roundabout considerations: Street widths and /or available right of way need to be sufficient. Roundabouts have a mixed record
regarding pedestrian and bicyclist safety. Roundabouts are generally not appropriate for the intersections of multilane roads. They often
work best where there is a high percentage of left-turning traffic. Deflection on each leg of the intersection must be set to control
speeds to 24 to 29 km/h (15 to 18 mi/h).
- Modified T-intersection considerations: Use when vehicle volumes are low to moderate. A minitraffic circle may accomplish
the same objective and cost less. Pedestrian access must be accommodated through the island.
- Intersection median barrier considerations: Local residents need to be provided access. An analysis of traffic patterns should
be done. Design should ensure safe and convenient bicycle and pedestrian access, and should ensure that emergency access is not negatively
impacted.
- Traffic Calming: The following measures are described in detail:
- Roadway narrowing: Curb extensions, chokers, and crossing islands.
- Lateral/horizontal shifts in the roadway: Chicanes and minicircles.
- Raised devices: Speed humps, speed tables, raised intersections, and raised pedestrian crossings.
- Complementary tools: Gateways, landscaping, and specific paving treatments.
- Whole street design: Serpentine design and woonerf (a common space shared by pedestrians, bicyclists, and low-speed motor
vehicles).
|
| Conclusions, Recommendations, Best Practices, Design Implications, or Design Guidelines See Key Results above. |
| General Comments None |
| Title
Safety Effects of Marked vs. Unmarked Crosswalks at Uncontrolled Locations: Executive Summary and Recommended Guidelines (FHWA-RD-01-075) |
Funding Agency and Contact Address
Office of Safety Research
and Development
Federal Highway Administration
6300 Georgetown Pike
McLean, VA 22101-2296
COTR: Carol Tan Esse and Ann Do |
| Authors
Zegeer, C.V., Stewart, J.R., Huang, H.H., and Lagerwey, P.A. |
| Publication Date March 2001 |
Number of Pages 33 |
| Document Web Site http://safety.fhwa.dot.gov/fourthlevel/design_p.htm#crosswalk |
| Source Type Field Test, Crash/Demographic Statistical Analysis |
| Driving Conditions
Normal |
Vehicle Platforms Not Specified |
Objective
- Determine whether marked crosswalks at uncontrolled locations (locations with no traffic signal or stop sign on the approach) are safer than
unmarked crosswalks under various traffic and roadway conditions.
- Provide recommendations on how to provide safer crossings for pedestrians.
|
General Approach
- Analyze 5 years of data on pedestrian crashes at 1,000 marked crosswalks and 1,000 matched unmarked comparison sites.
- Detailed data were collected on traffic volume, pedestrian exposure, number of lanes, median type, speed limit, and other site variables.
|
| Methods
Site Data Collection:
- A total of 1,000 marked crosswalk sites and 1,000 matched unmarked crossing sites in 30 cities across the United States were selected.
- Unmarked crosswalk comparisons were typically selected at intersections on the opposite leg of the same intersection as the selected marked
crosswalk site.
- For each marked midblock crosswalk, a nearby midblock crossing location was chosen as the comparison site on the same street.
- Information collected at each site: Pedestrian crash history, daily pedestrian volume estimates, ADT volume, number of lanes, speed limit,
area type, type of median, type and condition of crosswalk marking patterns, location type (midblock vs. intersection).
- At each of the crossing locations, trained data collectors conducted onsite counts of pedestrian crossings and classified pedestrians by age
group based on observations.
Crash Data:
- Police crash reports were obtained from each of the cities, except Seattle, WA, for a 5-year period.
- Crashes were reviewed to assign a crash type and to ensure accurate matching of the correct location.
|
| Key Terms
Marked Crosswalk, Safety, Pedestrian Crashes |
Key Results
- On two-lane roads, the presence of a marked crosswalk alone at an uncontrolled location was associated with no difference in pedestrian crash
rate, compared to an unmarked crosswalk.
- On multilane roads with traffic volumes above approximately 12,000 vehicles per day, having a marked crosswalk alone (without other substantial
improvements) was associated with a higher pedestrian crash rate, compared to an unmarked crosswalk (see figure below).
- Raised medians provided significantly lower pedestrian crash rates on multilane roads, compared to roads with no raised median.
- For ADT’s greater than 10,000, the pedestrian crash rate for marked crosswalks became increasingly worse as ADT increased, while the
crash rate at unmarked crossings increased only slightly as ADT increased.
- Older pedestrians had crashes that were high relative to their crossing exposure.
- The number of pedestrian crossings differed between the marked crosswalks and unmarked comparison crossings (66.1 percent and 33.9 percent,
respectively).
- The greatest difference in pedestrian crash types involved multiple-threat crashes (a driver stopping in one lane of a multilane road, and an
oncoming vehicle in the same direction strikes the pedestrian). A total of 17.6 percent of the pedestrian crashes in marked crosswalks were
classified as multiple threat, whereas none of the pedestrian crashes in the unmarked crosswalks were multiple threat.
|
Figure A. Pedestrian crash rates by traffic volume for multilane crossings with no raised medians, marked vs.
unmarked crosswalks.
|
Conclusions, Recommendations, Best Practices, Design Implications, or Design Guidelines
- Adding marked crosswalks alone (with no engineering, enforcement, or educational enhancement) is not expected to reduce pedestrian crashes for
any of the conditions included in the study.
- Marked crosswalks alone are not recommended at uncontrolled crossing location on multilane roads where traffic volume exceeds approximately
12,000 vehicles per day (with no raised medians), or approximately 15,000 ADT (with raised medians).
- Marked crosswalks and other pedestrian facilities should be routinely monitored to determine whether improvements are needed.
- Whenever a marked crosswalk is installed on an uncontrolled multilane road, consideration of an advance stop line is recommended at a point up
to 9.1 m (30 ft) in advance of the crosswalk along with the sign “Stop Here for Crosswalk.”
- Parking should be eliminated on the approach to uncontrolled crosswalks.
- To provide safer pedestrian crossings, the following recommendations are made: Add traffic signals with pedestrian signals when warranted,
provide raised medians, reduce the effective street-crossing distance, provide adequate nighttime lighting, and incorporate speed-reduction measures.
|
| General Comments
There should be continued research, development, and testing/explanation of innovative traffic control and roadway design alternatives that could
provide improved access and safety for pedestrians. |
3.5 VISIBILITY
This subsection contains reviews for the Visibility topic.
| Title
Improving the Conspicuity of Trailblazing Signs for Incident Management
|
Funding Agency and Contact Address
Virginia Department of Transportation
1401 E. Broad Street
Richmond, VA 23219
COTR: Not Specified |
| Authors
Barker, J.A., Neale, V.L., and Dingus, T.A. |
| Publication Date March 1998 |
Number of Pages 47 |
| Document Web Site None |
| Source Type Field Study, On-Road Study, Survey |
| Driving Conditions Degraded |
Vehicle Platforms Not Specified |
| Objective To design and evaluate a new sign design for emergency route trailblazing in a two-part series. |
| General Approach Two studies were conducted. Study 1 was an off-road field experiment conducted to determine the best sign
color combination, letter stroke width, and letter size for the emergency sign. Study 2 was conducted using an instrumented vehicle and survey
questionnaire through a construction zone-related detour. |
| Methods Study 1:
- Based on the results of the first study, three color combinations were chosen for testing (black on coral, black on light blue, and yellow on
purple) against a baseline color combination of black on orange.
Study 2:
Independent Variables:
- Sign color combination (three experimental sign color combinations: (1) yellow on purple, (2) black on light blue, and (3) black on
coral, and a baseline black on orange).
- Age (younger drivers ages 18 to 34, and older drivers ages 54 to 75).
- Visibility Condition (daytime or nighttime).
Dependent Variables:
- Average vehicle velocity/velocity variance.
- Late braking reaction.
- Longitudinal acceleration/deceleration measures and braking data.
- Lateral acceleration measures.
- Steering wheel position variance.
- Number of wrong and missed turns.
- Subjective acceptance and preference measures.
|
| Key Terms Incident Management, Conspicuity, Signage, MUTCD, Reserved Sign Colors, Older Drivers |
| Key Results Analysis of wrong and missed turns:
- There was a significant difference between sign colors. A series of pair wise chi-square tests revealed that the black on light blue sign was the
only sign color combination to result in significantly fewer turn errors. This indicates that the light blue and black sign resulted in
significantly fewer incorrect turns, and that the black on light blue sign is more conspicuous than the other sign colors.
Assessment for visibility conditions:
- The results indicated that there was a significant difference between daytime and nighttime drivers. A paired comparison of the four sign color
combinations for daytime drivers revealed significant differences between the light blue sign and the traditional orange sign. Since the light blue
sign resulted in proportionately more correct turns and fewer incorrect turns, this result indicates that the orange and black color combination
is inappropriate for daytime drivers when it is overlapped with existing detour signs.
|
| Conclusions, Recommendations, Best Practices, Design Implications, or Design Guidelines
The findings of this study indicated that use of a color combination other than the traditional orange background with a black legend will improve
driver performance and safety when used for trailblazing during critical incidents.
The following conclusions were drawn:
- A yellow on purple sign or black on light blue sign will likely result in fewer late braking maneuvers if the road geometry has many tight curves.
- A black on light blue sign will likely result in the fewest number of turn errors in both rural and urban settings.
- A black on orange sign will likely result in more turn errors, especially during the day and particularly when it is overlapped with existing
detour/construction zone signs.
- A black on coral sign is least preferred by older and younger drivers when compared to the other sign colors tested in this study.
- Younger drivers tend to have a preference for a yellow on purple sign and older drivers tend to have a preference for a black on light blue sign.
The following recommendations were made:
- Do not use a black on orange sign for trailblazing around a critical incident if an existing detour/construction zone is in place.
- Do not use a black on coral sign for trailblazing around a critical incident.
- A light blue on black sign is recommended due to its generally favorable subjective ratings and for the minimization of the number of turn errors
made by drivers in an overlapping detour.
- Despite the prior recommendation, it is important to note that the black on light blue sign fades to take on the appearance of a regulatory sign
when headlights reflect onto it.
- If the black on light blue sign is deemed inappropriate, consider using the yellow on purple color combination. In this study, the yellow on
purple sign color combination resulted in fewer turn errors than black on orange and it was generally rated favorably by drivers.
|
| General Comments None. |
| Title
Retroreflective Material Specifications and On-Road Sign Performance
(Transportation Research Record 1801, pp. 61-72)
|
Funding Agency and Contact Address
Traffic Control Materials Division
3M Company
3M Center 235-3B-55
St. Paul, MN 55144-1000
COTR: Not Specified |
| Authors
Bible, R.C., and Johnson, N. |
| Publication Date 2002 |
Number of Pages 12 |
| Document Web Site None |
| Source Type Field Test |
| Driving Conditions
Normal |
Vehicle Platforms Various Types |
| Objective
To examine the on-road performance of three new types of prismatic material for traffic control devices. |
| General Approach
The on-road performance of these new material types was examined through the use of computer simulation of sign luminance. Inputs to the computer model
included vehicle dimensions, headlamp illumination data, material retroreflectivity data, sign placement, and roadway geometry. A variety of sign positions
and roadway types were included to illustrate the similarities and differences among the three new types of material. |
| Methods General Method and Parameter Selection:
- A series of computer modeling experiments were conducted to illustrate retroreflective sign performance in everyday roadway situations.
- Headlamp data were obtained for a variety of lamp designs from late-model vehicles.
- Representative vehicles were chosen, and two or three signs were chosen as examples of typical signs used on each roadway type.
- Retroreflective materials used: Three typical pieces of microprismatic material that conform to the new American Society for Testing and
Materials (ASTM) types.
Computer Modeling of Luminance:
- Computer models rely on two data sets: The first is a data file containing the coefficient of retroreflection values for a material as measured
in the laboratory across a wide range of the four photometric angles. The second data file contains light output data derived from laboratory
measurements of a headlamp at a range of horizontal and vertical deflection points.
- The computer program takes as its input information about the location in space of the vehicle, the sign, the driver’s eye within the
vehicle, and the positioning of the headlamps on the vehicle.
- The program then calculates, for a specified viewing distance, the values of the four photometric angles at which the sign appears for the
given roadway geometry.
- The program then looks up the amount of light falling on the sign (illuminance) in the headlamp data file and looks up the material’s
performance produced by each headlamp at that particular geometry in the material data file. By multiplying these two values, a luminance value
expressed in candelas per square meter (cd/m2) is obtained for each headlamp separately. The two luminance values are summed to produce
the total sign luminance at that distance.
|
| Key Terms
On-Road Performance, Traffic Control Devices, Sign Luminance, Retroreflectivity |
Key Results
- Vehicle size and headlamp performance all contribute heavily to sign luminance. The results of a simple roadway scenario comparing different
vehicles used in the experiments show that sign luminance can double and triple just because of the changes in the vehicle. The luminance of a
right-shoulder sign made of ASTM type III material at a distance of 120 m was shown for the four vehicles used. In addition, the same scenario was
run using 2 composite headlamps derived from the median light output from the 20 bestselling vehicles in 1997 and 2000.
- The luminances for the different prismatic materials rank differently, depending on viewing distance and roadway scenario. Types VII and VIII
are similar at long distances and for signs mounted perpendicular to the road.
- Type VII separates itself from type VIII in those situations in which entrance angles are larger, such as a yield sign.
- Type IX material produces higher luminance at closer viewing distances for all scenarios. For text signs, these closer distances would
correspond to the legibility range for most standard-size signs.
|
Conclusions, Recommendations, Best Practices, Design Implications, or Design Guidelines
- The ranking of the three materials in terms of sign-luminance performance depends on the roadway configuration and viewing distance.
- Engineers and specifiers are encouraged to evaluate on-road sign performance at night before making material choices.
- Material selection should be based on sign performance. Material specifications should be based on measurable properties.
- Agencies have two options in selecting sign sheeting: The first is to select a general-purpose material that provides good sign brightness
across all situations and vehicles. The second option is to set standards for the material based on the intended application.
|
| General Comments None |
| Title Traffic Signal Luminance and Visual Discomfort at Night
(Transportation Research Record 1754, pp. 42-47) |
Funding Agency and Contact Address
Lighting Research Center
School of Architecture
Renesselaer Polytechnic Institute
21 Union Street
Troy, NY 12180
COTR:
Not Specified
|
| Authors Bullough, J.D., Boyce, P.R., Bierman, A., Hunter, C.M., Conway, K.M., Nakata, A., and Figuerio, M.G. |
| Publication Date 2001 |
Number of Pages 6 |
| Document Web Site http://199.79.179.82/sundev/detail.cfm?ANNUMBER=00816453 |
| Source Type Laboratory Study |
| Driving Conditions Degraded |
Vehicle Platforms All |
| Objective
To determine the relationship between traffic signal luminance and visual discomfort during nighttime driving. |
| General Approach
Thirty male and female observers between the ages 22 and 49 viewed a simulated nighttime scene while a sphere was illuminated with red, green, and
yellow lights. |
| Methods
Independent Variables:
- Signal color (red, yellow, and green).
- Distance from signal light (100 m and 20 m).
- Luminance (see table below):
Table A. Signal colors and luminance in both experiments.
| Color |
Levels of Luminance* |
| Red |
6,600 |
15,000 |
26,000 |
33,000 |
48,000 |
NA |
| Yellow |
6,300 |
13,000 |
26,000 |
NA |
46,000 |
130,000 |
| Green |
6,500 |
13,000 |
26,000 |
NA |
46,000 |
NA |
*cd/m2
Dependent Variables:
Experiment 1:
- Whether an afterimage was visible following the signal light:If yes, then color of the afterimage.
- Color of the signal light.
- Brightness of the signal light: Rated from 1 (not at all bright) to 7 (very bright).
- Visual discomfort of the signal light: Rated from 1 (not at all uncomfortable) to 7 (very uncomfortable).
Experiment 2:
- Whether the signal light was visually uncomfortable or not.
|
| Key Terms
Traffic Signal Luminance, Visual Discomfort |
| Key Results Experiment 1: Afterimages:
- The
 test on the percentage of subjects seeing afterimages for the four luminances common to all signal
colors (approximately 6500, 13,000, 26,000, and 46,000 cd/m2) revealed no significant differences among the signal colors or between
the two viewing distances. test on the percentage of subjects seeing afterimages for the four luminances common to all signal
colors (approximately 6500, 13,000, 26,000, and 46,000 cd/m2) revealed no significant differences among the signal colors or between
the two viewing distances.
- The presence of afterimages was positively related to the brightness of the signal light, independent of color.
- Afterimage colors varied across observers, either similar to the viewed color or white/purple.
Color Identification:
- Of the 840 responses collected in the experiment by all 30 subjects, only once was a signal color misidentified (one yellow signal at 46,000
cd/m2 was identified as green from the far viewing distance).
- Color identification was very easy.
Brightness and Discomfort Ratings:
- Mean brightness ratings and mean discomfort ratings showed highly linear relationships to the logarithm of the signal luminance.
- Brightness ratings, signal luminance, viewing distance, and color all had statistically significant effects (p < 0.001) according to a
three-way ANOVA, with higher luminances and shorter viewing distances giving higher brightness ratings.
- Ratings of discomfort were similar to brightness ratings in that luminance, viewing distance, and color again had statistically significant
effects (p < 0.001) according to a three-way ANOVA.
- Yellow signals were rated as less bright and less uncomfortable than green and red at the same luminance.
- There were no significant interactions among any of the independent variables (luminance, viewing distance, and color) for either the
brightness or discomfort ratings.
Experiment 2:
- The percentage of observers who found the signal light to be uncomfortable (L = signal luminance) were fitted to logarithmic functions as
described in table B.
Table B. Logarithmic functions representing the percentages of observers who found the signals to be uncomfortable.
| Color |
Near Viewing Distance |
Far Viewing Distance |
| Red |
46.82 ln L – 408.0 |
34.67 ln – 303.9 |
| Yellow |
36.48 ln L – 324.7 |
29.26 ln – 262.5 |
| Green |
40.34 ln L – 335.7 |
39.66 ln – 344.9 |
|
Conclusions, Recommendations, Best Practices, Design Implications, or Design Guidelines
- Red signals meeting ITE specifications are unlikely to cause discomfort; however, this is not the case for yellow and green signals.
- Dimming yellow and green traffic lights without altering their color could decrease the discomfort and also lower energy requirements and
decrease light output degradation.
|
| General Comments
Subjects used in the study were relatively young and had normal color vision. The results would probably be different with older subjects. The viewing
conditions did not include additional sources of light, which is often found under normal traffic conditions at night. The use of scale modeling, resulting
in viewing distances much shorter than those experienced under realistic driving conditions, might have increased the subjects’ visual discomfort.
|
| Title
Minimum Retroreflectivity Levels for Overhead Guide Signs and Street-Name Signs (FHWA-RD-03-082) |
Funding Agency and Contact Address
Office of Safety Research
and Development
Federal Highway Administration
6300 Georgetown Pike
McLean, VA 22101-2296
COTR: Ken Opiela |
| Authors Carlson, P.J., and Hawkins, G., Jr. |
| Publication Date December 2003 |
Number of Pages 118 |
| Document Web Site http://www.tfhrc.gov/safety/pubs.htm |
| Source Type Literature Review, Field Test |
| Driving Conditions Normal, Degraded(Nighttime) |
Vehicle Platforms All |
| Objective To develop scientifically based minimum levels of retroreflectivity (MR) for overhead guide signs and
street-name signs. |
| General Approach The research included a literature review of the pertinent studies and available photometric models.
This review initiated the development of an analytical model to develop the MR for overhead guide signs and street-name signs. |
Methods
- The research team reviewed a significant amount of previous research to assess the state of the art in sign legibility and to identify
experimental procedures that might have application to the research.
- One of the initial efforts of the project was a review of traffic engineering manuals and a survey of State and local practices regarding
overhead guide signs and street-name signs.
- Using the findings from the literature review and a state-of-the-practice survey, an initial set of MR levels was developed.
- After an analysis of the initial recommendations, a field investigation was initiated to determine the minimum luminance needed to read
overhead guide signs and street-name signs. Special emphasis was devoted to accommodating older drivers.
- Once the minimum luminance values were determined, the analytical model was used to develop a set of recommendations. The sensitivity of key
factors was studied to determine the most appropriate conditions under which to establish MR levels. Once these analyses were completed and the
values of the key factors were established, the MR model was executed for the final runs.
- Follow-up research was performed to address concerns that were focused on the investigation and sensitivity of updated factors, such as the
driver’s age, headlamps, vehicle type, and an inventory of available retroreflective sheeting materials and their performance levels.
|
| Key Terms
Traffic Control Devices, Overhead Signs, Street-Name Signs, Retroreflectivity, Visibility, Luminance
|
Key Results
Table A. Initial MR levels for overhead guide signs (50 percent accommodation).
| Sign Lateral Position |
Distance (ft) |
MR (cd/lx/m2) for Specific ASTM Retroreflective Signing Material |
| I |
II |
III |
VII |
VIII |
IX |
| Above inside lane |
300 |
15 |
15 |
16 |
19 |
13 |
9 |
| 470 |
37 |
37 |
38 |
42 |
37 |
28 |
| 640 |
N/A |
N/A |
119 |
129 |
98 |
85 |
| Above center lane |
300 |
12 |
12 |
13 |
16 |
11 |
7 |
| 470 |
31 |
32 |
32 |
35 |
32 |
24 |
| 640 |
N/A |
100 |
100 |
100 |
81 |
72 |
| Above shoulder lane |
300 |
11 |
10 |
11 |
14 |
10 |
6 |
| 470 |
29 |
29 |
30 |
32 |
29 |
22 |
| 640 |
N/A |
89 |
89 |
96 |
73 |
65 |
- Sign centroid 2.9 m (9.5 ft) above roadway.
- Based on modeling performed with CARTS50 headlamps (right and left).
- Straight and level roadway.
- Passenger car in center lane.
|
1 ft = 0.305 m |
|
Table B. Initial MR levels for post-mounted street-name signs (50 percent accommodation).
| Roadway |
Sign Lateral Position |
Distance (ft) |
MR (cd/lx/m2) for Specific ASTM Retroreflective Signing Material |
| I |
II |
III |
VII |
VIII |
IX |
| Two-lane |
Right side (12 ft from center of travel lane) |
120 |
7 |
10 |
19 |
31 |
27 |
6 |
| 180 |
13 |
15 |
20 |
31 |
27 |
8 |
| 240 |
40 |
49 |
55 |
69 |
52 |
26 |
| Left side (24 ft from center of travel lane) |
120 |
27 |
30 |
43 |
100 |
52 |
11 |
| 180 |
31 |
31 |
36 |
43 |
45 |
17 |
| 240 |
N/A |
98 |
108 |
130 |
96 |
66 |
| Four-lane |
Right side (24 ft from center of travel lane) |
120 |
21 |
15 |
29 |
118 |
60 |
11 |
| 180 |
24 |
24 |
33 |
51 |
42 |
11 |
| 240 |
64 |
70 |
79 |
106 |
77 |
35 |
| Left side (36 ft from center of travel lane) |
120 |
36 |
47 |
65 |
195 |
111 |
19 |
| 180 |
68 |
46 |
55 |
69 |
67 |
27 |
| 240 |
N/A |
N/A |
150 |
178 |
133 |
93 |
- Sign centroid 2.9 m (9.5 ft) above roadway.
- Based on modeling performed with CARTS50 headlamps (right and left).
- Straight and level roadway.
|
1 ft = 0.305 m |
|
|
Conclusions, Recommendations, Best Practices, Design Implications, or Design Guidelines
Table C. Research recommendations for updated MR levels.
| Sign Color |
Position |
Sheeting Type (ASTM D4956-01a) |
| I |
II |
III |
VII |
VIII |
IX |
| White-on-green guide signs or street-name signs |
Overhead |
* // 7 |
* // 15 |
* // 25 |
250 // 25 |
| Shoulder |
* // 7 |
120 // 15 |
*Sheeting type should not be used.
Notes: The levels in the cells represent legend retroreflectivity // background retroreflectivity (for positive-contrast signs). Units are
candelas per lux per square meter (cd/lx/m2) measured at an observation angle of 0.2 degrees and an entrance angle of -4.0 degrees.
|
|
| General Comments
An update to this report is found in FHWA-RD-03-081 (Carlson and Hawkins, July 2003) and is reviewed separately. |
| Title
Updated Minimum Retroreflectivity Levels for Traffic Signs (FHWA-RD-03-082)
|
Funding Agency and Contact Address
Office of Safety Research
and Development
Federal Highway Administration
6300 Georgetown Pike
McLean, VA 22101-2296
COTR: Kenneth S. Opiela |
| Authors Carlson, P.J., and Hawkins, G.H., Jr. |
| Publication Date July 2003 |
Number of Pages 107 |
| Document Web Site http://www.tfhrc.gov/safety/pubs/03081/ |
| Source Type Literature Review |
| Driving Conditions Degraded |
Vehicle Platforms All |
| Objective To provide an updated set of recommended minimum retroreflectivity (MR) levels for traffic signs. |
General Approach
- A literature review was conducted that covered retroreflectivity-related research articles from the mid-1980s to 2002.
- This report includes an updated set of MR levels for traffic signs based on recent developments in vehicle headlamps, vehicle types/sizes,
drivers’ nighttime needs, and newer sheeting materials. The updated MR levels are also based on more robust computer modeling of
retroreflective sheeting performance. The MR levels presented in the table below represent the result of these updates and the results of various
decisions made regarding AASHTO’s policy resolution on MR levels. The MR levels presented in the table also represent the input from the
participants of the four national MR workshops (Hawkins, Carlson, Schertz, and Opiela, 2003).
|
| Methods Chapter 3: Updated Factors:
- Factors (headlamps, vehicle type/size, retroreflective sheeting performance, driver accommodation level).
Chapter 4: Updated MR Levels:
- Sign type (large guide signs, small guide signs, street-name signs, warning signs, regulatory signs).
Chapter 5: Assumptions and Limitations:
- Assumptions with regard to demand and supply luminance.
- Standards and specifications.
- Measuring retroreflectivity: Measurement error and variability, standardization, rotational sensitivity, and uniform degradation.
|
| Key Terms Retroreflectivity, Traffic Control Devices, Traffic Signs |
| Key Results
The MR levels for each sign type were consolidated into a straightforward format to be easy to manage and
implement. The results of the consolidation efforts are presented in the table below.
|
Conclusions, Recommendations, Best Practices, Design Implications, or Design Guidelines
Table A. Research recommendations for updated MR levels.
| Sign Color |
Criteria |
Sheeting Type (ASTM D4956-01a) |
| I |
II |
III |
VII |
VIII |
IX |
| White on Red |
See note 1 |
35 // 7 |
| Black on Orange or Yellow |
See note 2 |
* |
50 |
| See note 3 |
* |
75 |
| Black on White |
|
50 |
| White on Green |
Overhead |
*// 7 |
*// 15 |
*// 25 |
250 // 25 |
| Shoulder |
* // 7 |
120 // 15 |
| Notes: |
Levels in cells represent legend retroreflectivity // background retroreflectivity (for positive-contrast signs). Units are
cd/lx/m2 measured at an observation angle of 0.2 degrees and an entrance angle of -4.0 degrees. |
| |
- Minimum Contrast Ratio ≥ 3:1 (white retroreflectivity/red retroreflectivity).
- For all bold symbol signs and text signs measuring 121.9 cm (48 inches) or more.
- For all fine symbol signs and text signs measuring less than 121.9 cm (48 inches).
*Sheeting type should not be used. |
|
 |
- W1-1: Turn
- W1-2: Curve
- W1-3: Reverse Turn
- W1-5: Winding Road
- W1-6: Large Arrow (one direction)
- W1-7: Large Arrow (two directions)
- W1-8: Chevron
- W1-9: Turn and Advisory Speed
- W1-10: Horizontal Alignment and Intersection
- W2-1: Cross Road
- W2-2, W2-3: Side Road
- W2-4: T-Intersection
- W2-5: Y-Intersection
- W2-6: Circular Intersection
- W3-1a: Stop Ahead
|
- W3-2a: Yield Ahead
- W3-3: Signal Ahead
- W4-3: Added Lane
- W6-1: Divided Highway Begins
- W6-2: Divided Highway Ends
- W6-3: Two-Way Traffic
- W10-1, -2, -3, -4: Highway-Railroad Intersection Advance Warning
- W11-2: Pedestrian Crossing
- W11-3: Deer Crossing
- W11-4: Cattle Crossing
- W11-5: Farm Equipment
- W11-5p, -6p, -7p: Pointing Arrow Plaques
- W11-8: Fire Station
- W11-10: Truck Crossing
- W12-1: Double Arrow
|
|
| All symbol signs not listed in the bold category are considered fine symbol signs. |
 |
- W3-1a: Stop Ahead
- Red retroreflectivity ≥ 7, White retroreflectivity = 35
- W3-2a: Yield Ahead
- Red retroreflectivity ≥ 7, White retroreflectivity = 35
- W14-3: No Passing Zone, W4-4p: Cross Traffic Does Not Stop, or
- W13-2, -3, -1, -5: Ramp and Curve Speed Advisory Plaques
- Use largest dimension.
|
|
|
| General Comments None |
| Title
Nighttime Legibility of Ground-Mounted Traffic Signs as a Function of Font, Color, and Retroreflective Sheeting Type (FHWA/TX-03/1796-2)
|
Funding Agency and Contact Address
Research and Technology
Implementation Office
Texas Department of Transportation
P.O. Box 5080
Austin, TX 78763-5080
COTR:
Not Specified |
| Authors Chrysler, S.T., Carlson, P.J., and Hawkins, H.G. |
| Publication Date September 2002 |
Number of Pages 76 |
| Document Web Site http://tti.tamu.edu/documents/1796-2.pdf |
| Source Type Closed-Track Study |
| Driving Conditions Degraded |
Vehicle Platforms Light Vehicles |
| Objective
To determine the relative effects of font, color, and retroreflective sheeting materials on sign legibility.
|
| General Approach
Twenty-four participants ages 55 to 75 drove a passenger sedan around a closed course at 48.3 km/h (30 mi/h) while attempting to read ground-mounted
signs on the right shoulder. |
| Methods Independent Variables:
- Age (55 to 64 or 65 to 75 years).
- Background color (green, white, yellow, and orange).
- Sheeting type (ASTM Type III, ASTM Type VIII, and ASTM Type IX).
- Font (Highway Series D, D-Modified, and Clearview™ Condensed Road).
Dependent Variables:
- Legibility distance in feet of four-letter words printed on signs.
|
| Key Terms
Traffic Signs, Legibility, Retroreflective Sheeting, Human Factors, Visibility, Font, Typeface, Color |
Key Results
- No age differences were found for legibility.
- Color: On average, yellow and white backgrounds performed equivalently (57.9 and 57.3 m (190 and 188 ft), respectively), green performed slightly
worse (54.6 m (179 ft)), and orange was significantly worse than all other colors (50.0 m (164 ft)).
- Sheeting: Types VIII and IX were significantly better than type III, but were equivalent to each other.
- Font: Highway Series D performed better for green and orange backgrounds with types VIII and IX sheeting, whereas D-Modified font was better with
white or yellow background colors. The Clearview Condensed Road font surprisingly performed worse than either of the other two.
|
Conclusions, Recommendations, Best Practices, Design Implications, or Design Guidelines
- The difference between the green background signs and the yellow and white signs was only about 5.2 m (17 ft), which could have been within the
range of error for the relatively crude distance measuring system.
- It is not practical to identify one combination of font, sheeting, and color that optimizes sign performance under all conditions.
- For small signs with white, yellow, or green backgrounds in unlighted areas, microprismatic retroreflective sheeting is not consistently better
than encapsulated lens high intensity.
- For work zone signs with an orange background, microprismatic materials did provide a greater legibility distance than high intensity.
- The D-Modified font with a thicker stroke width did not improve legibility compared to Highway Series D for white, yellow, and orange signs. The
Clearview Condensed Road font (with a thinner stroke) in all uppercase letters did not improve legibility when compared to Highway Series D for
ground-mounted signs with uppercase legends.
- The legibility index used for design and sign placement should be 12.2 m (40 ft) of sign legibility per 25.4 mm (1 inch) of letter height at a
maximum. A more conservative value, supported by the current project, is 3.9 m/cm (33 ft/inch).
|
| General Comments None |
| Title
Fluorescent Strong Yellow-Green Signs for Pedestrian/School/Bicycle Crossings: Results of a New York State Study (FHWA/NY/SR-95/121)
|
Funding Agency and Contact Address
Transportation Research and
Development Bureau
New York State Dept of Transportation
State Campus
Albany, NY 12232-0869
COTR:
Not Specified |
| Authors Dhar, S., and Woodin, D.C. |
| Publication Date June 1995 |
Number of Pages 26 |
| Document Web Site http://www.nysl.nysed.gov/scandoclinks/ocm34574385.htm |
| Source Type Field Test |
| Driving Conditions Normal |
Vehicle Platforms Not Specified |
| Objective To compare the effectiveness of fluorescent strong yellow-green colored signage vs. standard yellow signage at
pedestrian, school, and bicycle crossings on driver behavior and traffic patterns. |
General Approach
- Before/after study observing driver behavior for a period of 30 days for each type of signage.
- Incidences were tabulated according to drivers who slowed, stopped, and swerved or braked suddenly.
- Vehicle speed was also recorded in each test area for comparison.
|
| Methods Independent Variables:
- Sign type (standard yellow, fluorescent strong yellow-green).
- Installation site (business pedestrian, two different school pedestrian areas).
Dependent Variables:
- Traffic volume (vehicles, pedestrians, and bicyclists per hour).
- Driver behavior (percentage of vehicles that slowed, stopped, and swerved or braked suddenly).
- Vehicle speed (average and 85th percentile speeds, percentage exceeding speed limit by 0, 8, 16, or 24 km/h (0, 5, 10, or 15
mi/h)).
|
| Key Terms
Signage, Visibility, Pedestrians |
Key Results
- There was a significant increase in the proportion of motorists slowing for pedestrians/bicycles in the yellow-green testing period over the
standard color signs.
- There was no significant increase in the proportion of motorists stopping for pedestrians/bicycles.
- There was a significant reduction in the proportion of the conflicts with pedestrians/bicycles with the yellow-green signs in one of the two
test sites.
- No differences were found with regard to vehicle speed in the test areas.
Table A. Behavioral data before and after change of signage.
| Motorist Data |
Site I Signs |
Site II Signs |
| Std |
Y-G |
Std |
Y-G |
| Number with pedestrians/bicycles present |
169.0 |
114.0 |
181.0 |
136.0 |
| Number slowing for pedestrians/bicycles |
29.0 |
37.0 |
44.0 |
52.0 |
| Percent slowing for pedestrians/bicycles |
17.2 |
32.5 |
24.3 |
38.2 |
| Number stopping for pedestrians/bicycles |
22.0 |
23.0 |
26.0 |
33.0 |
| Percent stopping for pedestrians/bicycles |
13.0 |
20.2 |
14.4 |
24.3 |
| Number swerving/braking suddenly |
7.0 |
3.0 |
56.0 |
6.0 |
| Percent swerving/braking suddenly |
4.1 |
2.6 |
30.9 |
4.4 |
|
Figure A. Motorist behavior before (dark) and after (light) change of signage.
|
Conclusions, Recommendations, Best Practices, Design Implications, or Design Guidelines
- Yellow-green signage performed better than standard yellow signage in driver behavior analyses.
- Yellow-green signage did not affect vehicle speed in the test area.
|
| General Comments Authors recommend longer term, more widespread study, as well as a control condition for stronger
recommendations. |
| Title
Sign Placement Marking Visibility From the Perspective of Commercial Vehicle Drivers
|
Funding Agency and Contact Address
Research and Technology
Implementation Office
Texas Department of Transportation
P.O. Box 5080
Austin, TX 78763-5080
COTR:
Not Specified |
| Authors Finley, M.D., Carlson, P.J., Trout, P.D., and Jasek, D.L. |
| Publication Date September 2002 |
Number of Pages 124 |
| Document Web Site http://tti.tamu.edu/documents/4269-1.pdf |
| Source Type Field Study |
| Driving Conditions Degraded |
Vehicle Platforms Light Vehicles, Commercial Vehicles |
| Objective To determine the relationship between vehicle type (passenger car or commercial vehicle) and sign/pavement
retroreflective material in terms of the legibility distance of signs and end detection distance of pavement markings. |
General Approach
- Twenty-eight truck drivers viewed 33 sign treatments and six pavement treatments in a passenger vehicle and in a commercial vehicle.
- The research team measured the illuminance of 10 commercial vehicles’ headlamps at 4 typical sign locations.
|
| Methods Nighttime Sign/Pavement Treatments:
Independent Variables:
- Age group (younger: < age 35, middle-age: ages 35 to 50, older: > age 50).
- Vehicle type (passenger vehicle, commercial vehicle).
- Sign/surface type (Guide: White on green, Destination: White on green, Daytime speed limit: Black on white, Nighttime speed limit:
White on black, Pavement marking: 10.1-cm (4-inch) white edgeline).
- Sign/surface sheeting material (ASTM Type III: Low retroreflectivity, Type VIII: High retroreflectivity, and Type IX: Medium
retroreflectivity).
Dependent Variables:
- Distance of sign/surface legibility.
|
| Key Terms
Traffic Control Devices, Signing, Pavement Markings, Visibility, Legibility, Retroreflectivity, Illuminance, Luminance, Commercial Vehicles
|
| Key Results
Nighttime Sign/Pavement Treatments:
- Average legibility distance was significantly different across age groups, including 254 m (835 ft) for younger drivers, 227 m (745 ft) for
middle-age drivers, and 186 m (609 ft) for older drivers.
- Average legibility distance for the CV was 12 percent greater, at 237 m (777 ft), than that for the PV (212 m (694 ft)).
- No differences were found across material types for guide or destination signs.
- Type IX retroreflective sheeting performed 3 percent and 6 percent better than types III and VIII, respectively, on the daytime speed limit signs.
Type VIII sheeting was 5 percent less legible than the other two sheeting materials on the nighttime signs.
- Vehicle type affected the differences in benefit from higher reflectivity for both daytime and nighttime speed limit signs as legibility increases
were greater for higher retroreflectivity in commercial vehicles compared to passenger vehicles (see figures A and B below).
- Pavement marking legibility did not increase linearly with retroreflectivity (see figure C below).
|
Figure A. Legibility distance for sheeting materials by vehicle type for daytime speed limit signs.
 |
Figure B. Legibility distances for sheeting materials by vehicle type for nighttime speed limit signs.
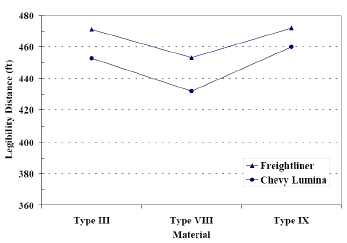 |
Figure C. End detection distance of pavement markings by retroreflectivity.
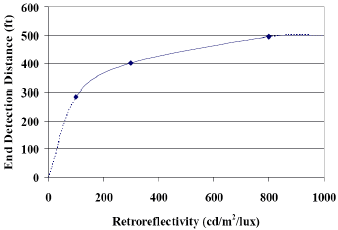 |
| 1 ft = 0.305 m |
|
Conclusions, Recommendations, Best Practices, Design Implications, or Design Guidelines
- The practical differences found between sign sheeting and pavement marking materials by vehicle type were small, so recommendations can be made
without regard to vehicle type.
- Pavement markings should be made with the highest feasible retroreflectivity material.
|
| General Comments
Stronger recommendations could be made after further research:
- Additional legibility studies using a commercial vehicle that illuminates signs similar to the identified typical commercial vehicle.
- Pavement marking end detection studies under wet weather conditions.
- Studies to assess the design of sign placement with respect to commercial vehicles.
|
| Title
Visibility Performance Requirements for Vehicular Traffic Signals, Interim Report (NCHRP Project No. 5-15)
|
Funding Agency and Contact Address
National Cooperative Highway
Research Program
Transportation Research Board
500 Fifth Street, N.W.
Washington, DC 20001
COTR:
Not Specified |
| Authors Freedman, M., Flicker, L., Janoff, M.S., Schwab, R.N., and Staplin, L.K. |
| Publication Date August 2001 |
Number of Pages 190 |
| Document Web Site None |
| Source Type Literature Review, Laboratory Study, Field Test |
| Driving Conditions Normal |
Vehicle Platforms Not Specified |
Objective
- Develop a comprehensive set of visibility performance requirements for round and arrow traffic signal displays to ensure that signals are
reliably detected and recognized when encountered by drivers under the range of conditions presented on U.S. roads.
- Develop techniques for manufacturers, signal shops, and independent testing laboratories to verify that signals comply with the optical
performance specifications.
|
| General Approach
This project was organized into three research stages:
Stage 1: Perform a comprehensive review of the literature to prepare the foundation for the empirical research to follow and determine the recommended
chromaticity limits for traffic signals.
Stage 2: Conduct a series of laboratory experiments and controlled field experiments to determine the intensity/luminance requirements for signals.
Stage 3: Develop shop testing procedures. |
| Methods
Laboratory studies: Four laboratory studies were conducted to determine whether varying age or vision deficiency of the driver population, signal
color, eccentricity, or background luminance would influence driver performance. Subjects sat behind a steering wheel and were instructed to steer to follow
the illumination of a computer-controlled bank of bulbs. If the subjects detected the signal, they logged a response by pressing buttons on the face of the
steering wheel. Data included detection response times and rates, as well as recognition rates for the various levels of age-vision group, intensity, shape
or color, and horizontal or vertical eccentricity from the central gaze direction. For the fourth study, subjects provided subjective ratings on a number
of measures related to the implications of changes in uniformity masking applied to a standard signal head.
Controlled field studies: Two controlled field studies evaluated the effects of a driver’s age and color vision class, signal luminance,
and viewing distance on signal effectiveness in an outdoor setting with full-scale signals. Detection success, recognition success, and reaction times were
used to assess the role each of these factors play in signal performance. Subjects were instructed to release a button to indicate that they saw a signal
and then indicate the color or shape of that signal. Each study placed the subjects’ position at decreasing distances from a maximum starting distance
and then randomly presented all the luminance and color (or luminance and shape) variants for them to detect before moving them to the next position.
|
| Key Terms
Traffic Signals, Color Vision Deficiency, Traffic Signal Luminance, Traffic Signal Chromaticity, Arrow Signals |
Key Results
Detection performance followed the expected pattern of requiring increasing luminance for increasing horizontal and vertical eccentricity
angles. Recognition performance was not as systematic in this regard and may have been influenced by factors other than signal luminance and
eccentricity, such as subject search strategy and random guessing or visual deficit. Luminance requirements for successful recognition tended to be greater by a factor between 1 and 2 than the luminance requirements for
detection success in experiments 1, 2, and 3. Generally, the results from the present experiments follow the findings and recommendations of Fisher (1971). That is, Fisher’s basic
values for signal luminous intensity (I) correspond to setting the criterion background luminance at 10,000 cd/m2, viewing distance at
100 m, offset angle of 3 degrees, and viewing a 20-cm (8-inch) red signal in easy to moderately difficult driving situations, resulting in the peak
I100 = 200 cd. The driving tasks used in the present experiments were representative of more demanding driving situations, such as urban arterials with
multiple lanes, pedestrians, turning traffic, etc. As such, the results from the present experiments have a peak of approximately I100 =
400 cd. Recognition performance within these experiments generally indicates that yellow and green require about twice the luminous intensity required
for red. A ratio of 2:1 provides luminous intensity differentiation that should assist color vision deficient (CVD) drivers in detecting and
recognizing a signal change from the green status based only on color or relative location on the signal head. The literature suggests that using a backplate reduces the required luminous intensity by approximately 25 percent (Cole and Brown, 1966).
Thus, if practitioners are concerned with being able to meet luminous intensity requirements, the use of a backplate may well provide the necessary
boost in visibility. Subjects judged the 2:1 uniformity display the best in terms of recognizability as a signal and overall acceptability. Overall, it appears that
a uniformity ratio of no higher than 2:1 is desirable and should not exceed 5:1. The use of 300-mm (12-inch) instead of 200-mm (8-inch) signal surface areas is an issue of consideration. Although there is some question about
the value of 300-mm signals, they do provide added performance both at longer and shorter viewing distances. At distances in which both 200 mm and
300 mm are viewed as point sources, the luminous intensity (and thus the illuminant energy at the eye of the observer) is higher for the larger
surface area of the 300-mm signal based on Allard’s Law. Moreover, as the observer approaches the signals, an increased target area results
in greater contrast with a given background luminance (Blackwell, 1946).
|
Conclusions, Recommendations, Best Practices, Design Implications, or Design Guidelines
The International Commission on Illumination (abbreviated as CIE from its French title Commission Internationale de l'Eclairage) standard for
red, yellow, and green should be adopted for use in the United States. This will have little or no impact on current U.S. signal lenses, and the
addition of blue in the range of permissible color (in the green light) may result in signals that are more likely to be recognized by drivers
with CVDs. An exception to the CIE standard permitting LED signals to have deeper red chromaticity may be acceptable if the signal provides sufficient
luminous intensity for a protanopic observer to achieve the same performance as with a conventional red signal with y ≥0.29 (a dominant
wavelength of 627 nanometers (nm)). CVD drivers should be used as the design drivers. They have the greatest need for signal luminance because of their reduced sensitivity to
light in wavelengths associated with their color vision deficiency. Our recommended base luminous intensity is 688 cd for a 2.5-degree offset or 478 cd for a 3-degree offset. - For arrow signals, the luminance of the arrow display should be equivalent to an equivalent portion of a round display.
|
| General Comments None |
| Title
Changeable Message Sign Visibility (FHWA-RD-94-077)
|
Funding Agency and Contact Address
Office of Safety and Traffic Operations
Research and Development
Federal Highway Administration
6300 Georgetown Pike
McLean, VA, 22101-2296
COTR:
Carole Simmons |
| Authors
Garvey, P.M., and Mace, D.J. |
| Publication Date April 1996 |
Number of Pages 137 |
| Document Web Site None |
| Source Type Field Study, Laboratory Study |
| Driving Conditions
Various |
Vehicle Platforms Not Specified |
| Objective
To identify problems with the visibility of changeable message signs (CMS) and to develop design guidelines and recommendations to ensure adequate
conspicuity and legibility of in-service CMS’s.
The research was designed to optimize CMS components, including:
- Character variables (font, width-to-height ratio, color, contrast).
- Message variables (interletter, interword, and interline spacing).
|
| General Approach
Field Test:
- Descriptive data and personal reports were gathered from signs in seven locations across the United States, representing various geographic
and climatic conditions.
Laboratory Tests:
- Seventy subjects viewed a computer simulation containing 14 different CMS signs with varying matrix size and density, font style, color,
interword and interletter spacing, and word length.
Controlled Dynamic Field Test:
- Eighty-nine subjects viewed a vehicle-mounted CMS at varying distances in both daytime and nighttime conditions, varying letter size and viewing
distance.
|
| Methods Field Test:
- Descriptive characteristics for the seven CMS’s were gathered via staff and manufacturer interviews.
- Subjective legibility and conspicuity, and photometric measurements were taken for each CMS sign.
Laboratory Tests:
- Matrix density and size, font, color.
- Word length, interletter and interword spacing.
Field-Based Studies:
- Sign distance, letter height.
- Nighttime lighting of disc-matrix CMS’s.
- Element type (e.g., flip disc, LED).
|
| Key Terms
Changeable Message Signs, CMS, Visibility, Legibility, Conspicuity
|
Key Results and Conclusions/Recommendations
Table A. Recommended minimum luminance values (cd/m2) for CMS visibility (for the 85th percentile driver accommodated
at 198 m (650 ft)).
| |
Sun Behind Sign |
Sun on Sign |
Sun Overhead |
Overcast/Rain |
Nighttime |
| Young (16-40) |
1,000 |
1,000 |
850 |
350 |
30 |
| Old (65+) |
1,000* |
1,000* |
1,000 |
6,000 |
30 |
*Will accommodate less than 50 percent of the drivers at 198 m at any luminance level with extreme sun angles.
Table B. Summary of recommended character/message variables for CMS visibility.
| Design Feature |
Optimal |
Acceptable |
| Color |
Matching MUTCD color-coding specifications |
Red, Amber/Yellow, White, Orange |
| Contrast |
Lt – Lb / Lb > 5 to 50 |
Lt –S Lb / Lb = 5 |
| Contrast Orientation |
Light letters on a darker background |
Light on black, light on colored |
| Font and Matrix Form |
Alphanumerics that most closely approximate the standard highway font |
Any reasonable nonserif font using at least a 5x7 matrix or equivalent |
| Letter Height |
46 cm |
30.5 cm if legibility < 122 m is acceptable |
| Width-to-Height Ratio |
W:H = 0.8 |
W:H = 0.6 to 1.0 |
| Stroke Width-to-Height Ratio |
SW:H = 0.13 |
SW:H = 0.1 to 0.18 |
| Interletter Spacing |
Three times Standard Alphabet Series E or one-half the letter height |
3/7 the letter height |
| Interword Spacing |
Equal to letter height |
Equal to 5/7 the letter height |
| Interline Spacing |
70 percent of letter height |
20 percent of letter height with two-line CMS |
Figure A. Recommended CMS font. 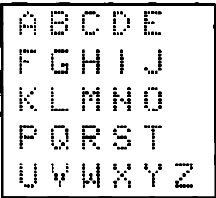 |
Figure B. CMS font NOT recommended. 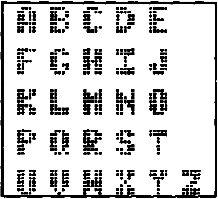 |
Element Type
- Reflective disc good for direct sunlight, poor for backlit conditions (i.e., sun behind sign).
- Light-emitting (fiber-optic, lamp-matrix, LED) signs are better in backlit conditions, poor for direct sunlight.
- Light-emitting and hybrid signs recommended over reflective signs for nighttime performance.
- Light-emitting signs have superior performance at night because of more control over contrast.
|
| General Comments None |
| Title
Traffic Operational Impacts of Higher Conspicuity Sign Materials (FHWA/TX-04/4271-1)
|
Funding Agency and Contact Address
Research and Technology
Implementation Office
Texas Department of Transportation
P.O. Box 5080
Austin, TX 78763-5080
COTR:
Not Specified |
| Authors Gates, T.J., Hawkins, H.G., Chrysler, S.T., Carlson, P.J., Holick, A.J., and Spiegelman, C.H. |
| Publication Date October 2003 |
Number of Pages 160 |
| Document Web Site http://tti.tamu.edu/documents/4271-1.pdf |
| Source Type Field Test |
| Driving Conditions Normal |
Vehicle Platforms Light Vehicles |
| Objective To determine specific field applications where the use of microprismatic and fluorescent sign sheeting materials
and flashing LEDs embedded in the corners of stop signs induce changes in driver performance that are related to improved highway safety. |
| General Approach
The basic approach was to collect and analyze traffic operations data at selected field sites before and after the specified sign treatments were put in
place. At each site, traffic operations data for the existing standard color sign were typically collected first, followed by replacement of the existing
sign with the higher conspicuity sign, followed many days later by collection of traffic operations data in the same manner as before. |
| Methods Independent Variables:
- Sign treatment (existing sign, higher conspicuity sign, second alternative treatment (where appropriate)).
- Ambient lighting condition (daytime, twilight, nighttime).
- Speed at upstream control point.
- Other (day of week, sky condition, vehicle type, presence of opposing vehicle).
Dependent Variables:
- Curve (speed approaching curve, speed at point of curvature, percent of vehicles initiating deceleration prior to passing the curve
sign (curve sign evaluations only), speed variance, centerline/edgeline encroachments at midpoint of curve (chevron evaluations only)).
- Stop-controlled intersection (speed approaching intersection, decelerations approaching intersection, speed variance, stopping
compliance (stop sign treatments only)).
- Rural speed zone (speeds in proximity of the treatment sign, percent exceeding speed limit in proximity of the treatment sign, speed
variance in proximity of the treatment sign).
|
| Key Terms
Warning Signs, Stop Signs, Sheeting, Fluorescent, Microprismatic, Curves, Intersections |
Key Results
- Overall, the higher conspicuity applications produced mostly small changes in traffic operations, although many statistically significant
beneficial results occurred. No negative driver behavior impacts were found to be associated with any of the higher conspicuity sign materials.
|
Conclusions, Recommendations, Best Practices, Design Implications, or Design Guidelines
Table C. Sign treatments and recommended implantations.
| Sign Treatment |
Implementation Recommendation |
Sign Treatment |
Implementation Recommendation |
| Statewide |
As Special Treatment |
As Special Treatment |
As Experimental Device1 |
| Fluorescent Yellow Chevron |
 |
Yes |
--- |
Fluorescent Yellow Stop Ahead |
 |
Yes, on an as-needed basis. |
--- |
| Fluorescent Yellow Chevron Pole |
 |
--- |
Yes, on an as needed basis |
Flashing LED Stop |
 |
--- |
Yes, on an as-needed basis |
| Fluorescent Yellow Curve Warning |
 |
--- |
Yes, on an as needed basis |
Fluorescent Red Stop |
 |
--- |
Yes, however, the product is not available commercially. Microprismatic sheeting should be considered
for stop signs. |
| Fluorescent Yellow Curve Warning With Advisory Speed Plaque |
 |
--- |
Yes, on an as needed basis |
Microprismatic Stop Sign |
|
Yes, based on nighttime results for fluorescent red stop sign. |
--- |
| Fluorescent Yellow Large Arrow |
 |
--- |
Yes, on an as needed basis |
Red Border |
 |
--- |
Yes, where the speed limit is reduced with no apparent change in roadway conditions. |
| Fluorescent Yellow Exit Ramp Advisory |
 |
--- |
Yes, on an as needed basis |
|
|
| General Comments
Research performed in cooperation with Texas DOT and U.S. DOT, Federal Highway Administration. Research
Project Title: Applications for Advanced Sign Sheeting Materials. |
| Title
Determination of a Minimum Highway Pavement Marking Retroreflectivity Value for Older Drivers (FHWA/NC/94-008)
|
Funding Agency and Contact Address
North Carolina Department of
Transportation
P.O. Box 25201
Raleigh, NC 27611-5201
COTR:
Not Specified
|
| Authors
Graham, J.R., King, L.E., and Harrold, J. |
| Publication Date
June 1994
|
Number of Pages
100 |
| Document Web Site
None |
| Source Type
Field Test |
| Driving Conditions
Nighttime |
Vehicle Platforms Not Specified |
| Objective
To investigate the perceived adequacy of roadway markings at night by older drivers. |
| General Approach
Subjects viewed roadway markings with a wide range of retroreflectivity values at night from an automobile. From their subjective ratings of marking
adequacy, an unadjusted minimum required retroreflectivity value was determined. Roadway marking brightness reduction as a result of less than clean
headlight and windshield conditions was also investigated. |
Methods
- The observation route included 24 observation locations spaced over a distance of approximately 35 km. The drive took approximately 30 min when
driving near the posted speed limits.
- There were 85 observers. The average age of the observers was 62.2, while the maximum and minimum ages were 82 and 18, respectively.
- Nighttime subjective evaluations of the pavement markings at each observation were achieved.
- The test vehicle was a 1980, four-door Plymouth Volare.
- For each observation location, the subjects could respond by circling either: (1) less than adequate, (2) adequate, or (3) more than adequate.
|
| Key Terms
Pavement Markings, Visibility, Driver Perception, Reflectivity, Retroreflectivity, Retroreflectometer |
Key Results
- For the field test, more than 83 percent of all subjects rated a marking retroreflectivity of 100 mcd/m2/lx or greater as adequate or
more than adequate.
- For the field test, more than 85 percent of the subjects age 60 or older rated a marking retroreflectivity of 100 mcd/m2/lx or greater
as adequate or more than adequate.
- For the windshield and headlight experiments, it was found that up to 21 percent of additional light would be required to compensate for light
loss as a result of the dirty windshields and headlights of reasonably maintained vehicles.
- Applying the adjustment factor to the minimum adequate retroreflectivity value determined in this study results in an adjusted value of 121
mcd/m2/lx.
- The adjusted minimum adequate retroreflectivity value of 121 mcd/m2/lx as determined herein does not take into account the variation
in luminance as a result of the differences in vehicle headlights. The minimum adequate retroreflectivity value of 121 mcd/m2/lx may be
too low for many of the vehicles being driven on our roadways.
|
Conclusions, Recommendations, Best Practices, Design Implications, or Design Guidelines
- Based on the results of this study, roadway markings with retroreflectivity values less than 121 mcd/m2/lx are considered inadequate
for the majority of older drivers. This value includes an adjustment factor to compensate for reduced light transmission as a result of dirty
headlights and windshields.
- Because of the differences in vehicle lighting systems, including different types and ages of headlights and different light distributions,
the reflected light from roadway markings available to the driver’s eyes vary from vehicle to vehicle.
- In order to complete the search for a minimum adequate roadway marking retroreflectivity value, it is recommended that additional research be
focused on the effect of differing vehicle headlight systems on the minimum adequate retroreflectivity value for roadway markings.
|
| General Comments None |
| Title
Guidelines for the Use of Raised Pavement Markers
|
Funding Agency and Contact Address
Office of Safety and Traffic Operations
Research and Development
Federal Highway Administration
6300 Georgetown Pike
McLean, VA 22101-2296
COTR:
Joseph Moyer
|
| Authors Grant, A.R., and Bloomfield, J.R. |
| Publication Date September 1998
|
Number of Pages 58 |
| Document Web Site https://www.fhwa.dot.gov/tfhrc/safety/pubs/97152/body_index.html |
| Source Type Literature Review |
| Driving Conditions Not Specified |
Vehicle Platforms Not Specified |
| Objective To provide traffic engineers with design guidelines for raised pavement markers (RPMs) that are more specific
and usable than those in the Manual on Uniform Traffic Control Devices (MUTCD). |
| General Approach Recommendations for the design of RPMs are made on the basis of information provided by the MUTCD and
the Roadway Delineation Practices Handbook (RDPH), along with information accumulated from a variety of other sources. |
| Methods The review of the MUTCD and RDPH standards and relevant literature covered the following areas:
- Driving performance issues.
- General delineation requirements.
- Location.
- Color.
- Placement.
- Spacing in traffic zones.
- Spacing in construction zones.
- Type.
- Application and maintenance.
- Reflectivity.
|
| Key Terms Human Performance, Raised Pavement Markers, Human Factors |
| Key Results See Conclusions below |
| Conclusions, Recommendations, Best Practices, Design Implications, or Design Guidelines The following conclusions and
guidelines are presented:
Driving Performance Issues:
- Studies of driver behavior and crash data show that RPMs improve driver performance by improved lane delineation. Drivers are less likely to
encroach upon the shoulder or adjacent lanes through curves.
General Delineation Requirements:
- This section provides general guidelines for where both edgelines and centerlines should be used, line width and spacing, and where the lines
should be supplemented by RPMs.
Location:
- This section augments the RDPH with regard to supplementation of edgelines and centerlines with RPMs on certain roadway types and areas, as well
as the installation of snowplowable RPMs.
Placement:
- This section describes the placement of RPMs with regard to their proximity to edgelines and centerlines on different types of roadways,
orientation according to roadway geometry, and spacing when multiple RPMs are used.
Color:
- RDPH guidelines that describe the color of RPMs are reiterated: White markers for white lines, yellow markers for yellow lines, and red markers
to indicate wrong way.
Spacing in Traffic Zones:
- This section includes both RDPH and research-recommended guidelines for minimum and maximum RPM-supplemented edgelines and centerlines in
different traffic roadway layouts, including single and multilane roads, curve patterns, exit lanes and gores, narrow bridges, turn lanes, and
intersections.
Spacing in Construction Zones:
- This section provides RDPH guidelines for use of RPMs in constructions zones, specifically for tangents and horizontal curves, bridges with
grooved decks, relocated exit ramps, and pavement drop-offs.
Type:
- Guidelines are presented for the design and use of nonreflective, retroreflective, snowplowable, and construction zone RPMs. Recommendations
include RPM materials, surface adhesion, retroreflector type, size, protrusion area, and protrusion geometry.
Application and Maintenance:
- This section presents research-based issues for RPM installation, surface adhesion, maintenance, and replacement that should be used to supplement
literature provided by the RPM manufacturer.
Reflectivity:
- This section presents research-based recommendations for RPM reflectivity. This includes a description of facts about the human visual system with
regard to age and contrast levels, and the results of RPM performance testing on driving visibility requirements.
|
| General Comments A list of future research topics is included in each section of the RPM guidelines, as well as at the end
of the report, describing areas that would be of particular interest for future recommendations. |
| Title
Workshops on Nighttime Visibility of Traffic Signs: Summary of Workshop Findings (FHWA-SA-03-002)
|
Funding Agency and Contact Address
Office of Safety
Federal Highway Administration
400 Seventh Street, S.W.
Washington, DC 20590
COTR:
Peter J. Hatzi |
| Authors Hawkins, H.G., Carlson, P.J., Schertz, G.F., and Opiela, K.S. |
| Publication Date February 2003 |
Number of Pages 108 |
| Document Web Site http://safety.fhwa.dot.gov/roadway_dept/retro/sa03002/techdoc.htm |
| Source Type Workshop |
| Driving Conditions Normal |
Vehicle Platforms Not Specified |
| Objective To present the most recent research findings on minimum levels of retroreflectivity and to solicit input from
public agency officials prior to developing a proposed rule on minimum levels of retroreflectivity. |
| General Approach Ninety-nine individuals participated in the four invitation-only workshops. Each workshop consisted of 2
halfdays of presentation, with a nighttime sign visibility demonstration on the evening between the 2 days. |
Methods
- The first half-day of the workshop was devoted primarily to presenting information on retroreflectivity concepts, recent updates to the minimum
retroreflectivity levels, and a description of potential options for implementing minimum retroreflectivity levels.
- In the nighttime sign demonstration, the participants rated several signs with a range of retroreflectivity values.
- The second day of the workshop was primarily devoted to a discussion of the various issues and the development of recommended language for the
MUTCD relative to minimum levels of sign retroreflectivity or visibility.
|
| Key Terms Traffic Signs, Retroreflectivity |
| Key Results Major Findings:
- Participants recognized that governmental agencies have a responsibility to provide signs that have a reasonable level of daytime and nighttime
visibility.
- Participants agreed that there are already general retroreflectivity and sign inspection requirements in the MUTCD that agencies should be
following.
- The participants would like to see FHWA develop information that provides a stronger link between improving nighttime sign visibility and reducing
nighttime crashes. They felt that this type of safety data should be included as part of the rulemaking effort if agencies will be required to devote
greater resources to improving nighttime sign visibility.
- The timeframe for implementing the MUTCD guidelines should be based on the expected retroreflective life of the signs.
Unanswered Questions:
- What is the impact of ambient lighting on the visibility of signs?
- Should minimum levels represent best case, typical case, or worst case scenarios?
- What driver characteristics are of greatest concern? How does driver age relate to the types of vehicles driven? How many older drivers actually
drive at night?
- How can agencies stop the trend of headlamps directing less illumination toward signs?
|
Conclusions, Recommendations, Best Practices, Design Implications, or Design Guidelines
- Federal funding should be provided to agencies for the additional costs associated with improving the nighttime visibility of signs, such as
improved evaluation methods, sign management processes, and sign replacement efforts.
- Among the key findings of the workshops are that the public agency participants want the MUTCD to provide several methods that can be used to meet
the minimum retroreflectivity guidelines and that numeric retroreflectivity values should not be included in the MUTCD.
|
| General Comments None |
| Title
Legibility Comparison of Three Freeway Guide Sign Alphabets (FHWA/TX-99/1276-1F)
|
Funding Agency and Contact Address
Research and Technology
Implementation Office
Texas Department of Transportation
P.O. Box 5080
Austin, TX 78763-5080
COTR: Not Specified |
| Authors Hawkins, H.G., Jr., Wooldridge, M.D., Kelly, A.B., Picha, D.L., and Greene, F.K. |
| Publication Date May 1999 |
Number of Pages 120 |
| Document Web Site None |
| Source Type Field Test |
| Driving Conditions Normal, Nighttime |
Vehicle Platforms Light Vehicles |
| Objective
To determine if the legibility of freeway guide signs could be increased by optimizing the performance of specific sign design parameters. |
| General Approach
Fifty-four subjects participated in both daytime and nighttime trials. Overhead and ground-mounted sign positions were both evaluated. The three alphabets
evaluated were: Series E(modified), Clearview, and British Transport Medium. |
| Methods Independent Variables:
- Alphabets (Series E(Modified), Clearview, British Transport Medium).
- Sign Position (overhead, ground-mounted).
- Lighting Condition (daytime, nighttime with no sign illumination).
Dependent Variables:
- Legibility distance.
- Recognition distance.
Experimental Procedure:
- Test subjects started in the test vehicle at a distance where the signs were not legible.
- There were three words on the sign panel, with all three words in the same alphabet.
- The experimenter would indicate one word that test subjects would identify the position of on the sign (recognition task).
- They were to then read the other two words (legibility task) and identify their position on the sign.
|
| Key Terms Traffic Control Devices, Signing, Legibility, Older Drivers, Sign Alphabets |
Key Results
- There was significant variability in the results of the various experimental conditions.
- In general, the results indicated that Clearview was slightly more legible than Series E(Modified) in the overhead position under both daytime and
nighttime conditions. The extent of improvement was generally in the range of 2 to 8 percent over Series E(Modified). The greatest improvement was
achieved for older drivers.
- Clearview ground-mounted signs were less legible than Series E(Modified) under daytime conditions.
- Under nighttime conditions, the ground-mounted Clearview did not demonstrate a consistently better performance than Series E(Modified).
- A greater degree of improvement was realized in the recognition of Clearview in the overhead position for both daytime and nighttime conditions.
- British Transport Medium was generally less legible than Series E(Modified).
- The results of the legibility evaluations found that, for older drivers, the legibility index for Series E(Modified) is significantly lower than
the 0.66 m/mm (55 ft/inch) value traditionally used for sign design.
- The 85th percentile daytime legibility index for young-old drivers was about 0.48 m/mm (40 ft/inch) and, for oldold drivers, it was
about 0.36 m/mm (30 ft/inch).
- At night, the 85th percentile legibility indices for the older driver groups were about 60 to 70 percent of the daytime legibility.
Even the mean legibility indices of the older driver groups were lower than the traditional values.
Table A. Summary of statistical analysis.
| Driver Group |
Day |
Night |
| Legibility |
Recognition |
Legibility |
Recognition |
| Ground |
Overhead |
Ground |
Overhead |
Ground |
Overhead |
Ground |
Overhead |
| All Drivers |
E > C
E > B |
E > B
C > B |
|
C > B
C > B |
|
E > B
C > B |
|
C > B |
| Age |
Young |
|
|
|
|
|
|
|
|
| Young-old |
E > C |
E > B
C > B |
|
|
|
C > B |
|
|
| Old-old |
E > C |
C > B |
|
C > B |
|
C > B |
|
|
| Acuity |
Good |
E > C |
C > B |
|
|
|
C > B
E > B |
|
C > B |
| Normal |
|
|
|
|
|
C > B |
|
|
| Marginal |
|
C > B |
|
|
|
|
|
|
| Contrast Sensitivity |
Normal |
E > C |
C > B |
|
C > E
C > B |
|
C > B
E > B |
|
C > B |
| Marginal |
|
|
|
|
|
C > B |
|
|
| Reaction Time |
< 0.75 |
E > C |
C > B |
|
C > B |
|
C > B |
|
|
| 0.75-0.99 |
E > C |
C > B |
|
|
|
C > B |
|
|
| ≥1.00 |
|
|
|
|
|
|
|
|
| Notes: |
All comparisons reflect the results of Duncan’s procedure. |
| Notation: |
E = Series E(Modified), C = Clearview, B = British Transport Medium, Blank cell = No difference. |
| |
E > C means Series E(Modified) is statistically better than Clearview. |
| |
Shading indicates alternative alphabet better than Series E(Modified). |
|
Conclusions, Recommendations, Best Practices, Design Implications, or Design Guidelines
- The research results indicate the Clearview should not be implemented on a widespread basis. However, the presence of a small, but consistent,
improvement for overhead signs indicates that there may be some value in conducting limited field experiments of Clearview for overhead signs.
- If the experimentation is successful and future research indicates a benefit to using Clearview, then it may be implemented on a statewide basis
on overhead guide signs.
- Clearview should be an alternative to Series E(Modified), but should not replace it.
- All signs on a single overhead sign structure should use the same alphabet.
- Ground-mounted signs should continue to use only the Series E(Modified) alphabet.
- There are many aspects of Clearview that have not yet been evaluated. Additional research should be conducted on these issues before it is widely
implemented.
|
| General Comments None |
| Title
Detectability of Pavement Markings Under Stationary and Dynamic Conditions as a Function of Retroreflective Brightness
(Transportation Research Record, 1495, pp. 68-76)
|
Funding Agency and Contact Address 3M Traffic Control Materials Division
3M Company
553-1A-01 3M Center
St. Paul, MN 55144-1000
COTR: Not Specified |
| Authors Jacobs, G.F., Hedblom, T.P., Bradshaw, T.I., Hodson, N.A., and Austin, R.L. |
| Publication Date 1995 |
Number of Pages 9 |
| Document Web Site None |
| Source Type Field Test |
| Driving Conditions Normal |
Vehicle Platforms Not Specified |
| Objective
This work studied the minimum reflective brightness needed for a pavement marking to be visible to a driver as a function of the distance of the marking
from a vehicle. |
| General Approach
Six pavement marking products having a wide range of retroreflective brightness performance were viewed as isolated center skip lines from stationary
vehicles at distances from 30 to 250 m in a dark rural setting. Product detectability for each viewer/marking combination was determined. Also, seven pavement
marking products were viewed from moving vehicles with a driver approach speed of 24 km/h. Detection distances for each driver/marking combination were
determined. |
| Methods Stationary Experiment:
- Twenty-three drivers participated in the study.
- Pavement marking samples 0.1 m wide by 3.0 m long were prepared for viewing. The samples were viewed on top of a viewing table that stood 3.8 cm
above the road surface.
- Viewing distances: 30, 50, 80, 120, 160, 200, and 250 m from the front of the vehicle.
- Pavement marking products: Six distinctly different white preformed pavement marking products (A, B, C, D, E, and F) were tested representing a
wide range of retroreflective characteristics.
- After viewing the test area for 2 s, each subject was asked to write down whether a sample was visible or not visible.
Dynamic Experiment:
- Nineteen observers participated in this study.
- Pavement markings were prepared and displayed on top of the viewing table (the same as the stationary experiment).
- Pavement markings were viewed one at a time as isolated center skip lines by subjects driving along a straight section of test road. Samples were
placed at centerline locations randomly within a 70-m section of the test roadway.
- Seven different pavement marking samples were viewed in the dynamic experiment.
- When drivers decided that they had detected the pavement marking, a passenger in the vehicle was informed and a reflectorized beanbag was dropped
for the vehicle.
- Nighttime viewings were held on two consecutive nights in summer 1993. A test roadway with black asphalt pavement in a dark rural setting was
used. Samples were illuminated with standard low-beam headlamps. The vehicle type used in the viewings was a 1993 Ford Taurus four-door sedan.
- The reflective brightness of the materials at each detection distance was calculated from the photometric data.
|
| Key Terms
Retroreflectivity, Roadway Markings |
Key Results
- Age, gender, and use of corrective lenses by the observers had no distinguishably consistent effect within the sample of observers used in this
study.
Stationary Experiment:
- The results show that, in some cases, retroreflected luminance actually increased with viewing distance; the detectability of a given marking
material diminished at greater distances.
- The results showed that as the brightness of a marking is increased, its detectability improves. For a marking of a given luminance,
detectability improves at shorter distances.
Dynamic Experiment:
- The results indicate that the detectability contours for the dynamic experiment are shifted to shorter visibility distances than for the
stationary experiment. Also, this shift is not linear. The shift for the less-bright samples appears to be about 20 m for the moving vehicle
experiment relative to the stationary experiment.
- There was a stronger increase in detection distance with increased brightness for the stationary experiment than for the dynamic experiment. From
this limited data set, there appears to be a decrease in visibility distance on the order of 40 percent, changing from a stationary vehicle to one
moving at about 24 km/h.
|
Conclusions, Recommendations, Best Practices, Design Implications, or Design Guidelines
- As expected, brighter markings were detectable at greater distances from observer to marking in both stationary and dynamic viewing experiments.
- Detectability of pavement markings depends on the viewing conditions.
- A correlation could be seen between detectability of pavement markings and product brightness and viewing distance.
- The nature of this correlation was different when the experiment was changed from a stationary viewing to none with a moving vehicle with shorter
detectability distances for the same marking in a moving vehicle.
- A speed of as little as 24 km/h was sufficient to significantly shift marking detectability to shorter distances.
- Many factors, including vehicle speed, background surround and contrast, and the consequences of not being able to detect a road surface marking
need to be considered when defining such limits for a particular driving scenario.
- More effort will be required to fully understand these effects on marking detectability to define meaningful minimum brightness levels.
|
| General Comments None |
| Title
Factors Affecting Sign Retroreflectivity (OR-RD-01-09)
|
Funding Agency and Contact Address
Research Group
Oregon Department of Transportation
200 Hawthorne Avenue, S.E.
Suite B-240
Salem, OR 97301
COTR:
Not Specified |
| Authors Kirk, A.R., Hunt, E.A., and Brooks, E.W. |
| Publication Date January 2001 |
Number of Pages 275 |
| Document Web Site http://www.odot.state.or.us/taddresearch/retroreflectivity.pdf |
| Source Type Field Test |
| Driving Conditions Normal |
Vehicle Platforms Not Specified |
Objective
- Determine a baseline for sign retroreflectivity over time (i.e., establish the relationship between sign age and retroreflectivity).
- Examine the relationship between the physical orientation of signs and retroreflectivity. As the orientation of signs vary, so does the amount of
exposure to solar radiation and windblown dust.
|
| General Approach Retroreflectivity readings were collected on 80 high-intensity road signs located in the mid Willamette
Valley. |
Methods
- Recordings were taken on 80 signs: 20 red, 20 yellow, 20 green, and 20 white.
- Ten readings per sign were recorded. The retroreflectometer was calibrated before the readings were taken on each sign.
- The sign was washed and dried prior to any readings being taken in order to detect the optimum retroreflectivity of the sign. Measurements were
taken on the sign background only, not on the legend. The physical condition of the signs ranged from poor to new.
- Information was also recorded on the age and predominant physical orientation of each sign.
- Following the initial data collection, it was found that insufficient sign data had been collected. Thus, data for an additional 57 signs were
collected to provide a more complete data set.
|
| Key Terms
Reflectivity, Retroreflectivity, Retroreflective Sheeting, Traffic Signs, Sign Maintenance |
Key Results
- The findings showed that virtually all of the signs in the sample exceeded the minimum Oregon Department of Transportation (ODOT) standards for an
in-service period of 10 years.
- The red signs yielded the lowest average value, exceeding the ODOT standard by only about 3 percent. The average values for signs of other colors
exceeded the ODOT standard by 31 to 56 percent (see table).
- Lower retroreflectivity for west-facing signs was recorded for three of the four sign colors (white, yellow, and green). Among the red signs,
retroreflectivity values tended to be lowest among south-facing signs.
Table A. Comparison of sample readings with minimum ODOT values.
| Sign Color |
Minimum ODOT Values (SIA) |
Average Value From Sampled Signs (SIA) |
Comparison With Minimum Values |
| White |
200 |
261 |
+31 percent |
| Yellow |
136 |
198 |
+46 percent |
| Green |
36 |
56 |
+56 percent |
| Red |
36 |
37 |
+3 percent |
|
Conclusions, Recommendations, Best Practices, Design Implications, or Design Guidelines
- The findings showed that over a 12-year age span, most sign retroreflectivity readings were above the minimum ODOT standard.
- Retroreflectivity did not vary predictably with age.
- There was some evidence that retroreflectivity may be affected by sign orientation (direction facing) because of the weathering effects of
windblown dust and precipitation.
|
| General Comments None |
| Title
Roadway Lighting: An Investigation and Evaluation of Three Different Light Sources
|
Funding Agency and Contact Address
Arizona Department of Transportation
206 S. Seventeenth Avenue
Phoenix, AZ 85007
COTR: Not Specified |
| Authors Lewin, I., Box, P., and Stark, R.E. |
| Publication Date May 2003 |
Number of Pages 137 |
| Document Web Site http://www.dot.state.az.us/ABOUT/atrc/Publications/SPR/AZ522.pdf |
| Source Type Literature Review, Crash/Demographics Statistical Analysis |
| Driving Conditions Degraded |
Vehicle Platforms All |
Objective
- Determine whether new research on the potential impact on motorist driving performance of different light source spectral distribution and roadway
lighting levels would be justified, practical, and timely.
- Develop detailed scopes of work for more expansive future research efforts that could resolve the issues being defined in the project.
|
| General Approach
The project was organized to include two phases of work on each of the two topics: (1) a literature review to accomplish objective 1, and (2) a literature
review with analysis to accomplish objective 2. Three types of lamps were compared: (1) high-pressure sodium (HPS), (2) low-pressure sodium (LPS), and (3)
metal halide (MH). |
Methods
- In phase 1, a review was done of the literature on the effect of light source spectral distribution and color rendition on visibility and roadway
lighting levels. A formal recommendation was made with respect to the department’s goals and objectives to meet safety needs in a cost-efficient
manner, in relation to current Arizona Department of Transportation (ADOT) lighting practices. This included a technical memorandum describing the
relative benefits, timeliness, and efficacy of a possible decision by the department to initiate research in this area at this time.
- In phase 2, a detailed literature search and state-of-the-practice review of the subject of roadway lighting sources was conducted. This review
included contacting all of the State departments of transportation, as well as relevant local municipal agencies. The review included a selection o
f European, Australian, and other international agency sources.
- From the available literature, agency contacts, existing lighting system data, and other sources, information was collected with regard to present
light source usage, and requests were made for any related crash experience.
- This analysis has developed tabular summaries and textual reports of a typical roadway segment with each light source design. These provide
side-by-side comparisons of the three lighting system designs.
|
| Key Terms
Lighting, Visibility, Safety, Lamps, Illumination, Spectral |
| Key Results
Topic 1:
- Certain experiments indicated that driver response may be considerably improved when the lamp spectrum is attuned to stimulation of the rods i.e.,
when white light is used). However, other experiments indicated no difference in visual performance between the light source types.
- In general, experiments where peripheral vision is a significant visual input show benefits of MH sources.Where vision is achieved primarily by
the fovea, or the direct line of sight, the lamp types are equal.
- Investigations on the related subject of lighting level vs. visibility and safety have also been inconclusive. While national and international
standards exist, these are found to be based on consensus rather than controlled research. There is much evidence that lighting level influences
visibility. The nature of the relationship, however, is not fully understood.
Topic 2:
- The topic 2 work effort was unsuccessful in discovering any documentation relating light source type to crash experience.
- A side-by-side comparison was developed for the three sources for the lighting of a major roadway. Each design was optimized for maximum pole
spacing. The results were:
| Lamp Type |
Pole Spacing |
| 400W HPS |
84.2 m (276 ft) |
| 180W LPS |
53.7 m (176 ft) |
| 400W MH |
75.0 m (246 ft) |
- Primarily as a result of these pole spacings, HPS provides the lowest initial system cost. MH has a 7 percent higher initial cost than HPS, while
LPS is 41 percent more expensive than HPS.
- Power costs for HPS and MH are essentially identical, but are 24 percent lower for LPS. Considering overall operating costs, including
maintenance, MH is 7 percent more expensive than HPS, while LPS is 12 percent less expensive. These values are based on a cost of 8 cents per
kilowatt hour and will vary with this rate.
- Life-cycle costs, based on a 30-year life, are 7 percent higher for MH vs. HPS, and are 17 percent higher for LPS vs. HPS.
|
Conclusions, Recommendations, Best Practices, Design Implications, or Design Guidelines
- The extent to which MH can improve vision, or to which LPS can reduce visibility reduction (vs. HPS), is dependent upon the relative importance of
peripheral and foveal vision for the driver. While it is generally recognized that both foveal and peripheral vision are important, the literature
search and analysis have indicated that we do not have a good understanding of the nature of the driver visual tasks that are related to crash causes
and prevention.
- The interrelationship between lamp spectrum, visibility, and safety requires field evaluation under conditions representative of normal driving.
Lack of such information has led the consultants to recommend further research.
- The proposed field experimentation involving lamp type and visibility should be extended to include lighting level as a further variable. These
three factors are intertwined, and further research is needed to understand their nature and influence upon driving safety.
- Since no agency reported useful crash data, the consultants recommend a research program to collect the needed information. This should consist of
a study involving three nearly identical roadway sections, each lighted by one of the candidate light sources. These would be in-use roadways rather
than a closed facility.
- No recommendations are made to ADOT regarding lamp type. The issue is complex, with numerous interrelated safety and cost factors.
|
| General Comments None |
| Title
Relative Visibility of Increased Legend Size vs. Brighter Materials for Traffic Signs (FHWA-RD-94-035)
| Funding Agency and Contact Address Office of Safety and Traffic Operations
Research and Development
Federal Highway Administration
6300 Georgetown Pike
McLean, VA 22101-2296
COTR: Richard Schwab and Carole Simmons |
| Authors Mace, D.J., Garvey, P.M., and Heckard, R.F. |
| Publication Date December 1994 |
Number of Pages 49 |
| Document Web Site None |
| Source Type Field Test |
| Driving Conditions Degraded |
Vehicle Platforms Not Specified |
Objective
- Determine minimum size, retroreflectivity, and other requirements to accommodate, as much as possible, the needs of elderly drivers.
- Evaluate the tradeoffs in size and retroreflectivity in order to establish the optimum or most cost-effective method to maximize legibility
distance and/or conspicuity.
|
| General Approach
This research examined the relative conspicuity and legibility of signs with different retroreflective materials, containing legends using different stroke
widths and other stylistic variations. Both younger and older subjects evaluated the test signs. Four studies were conducted (two static in-vehicle studies,
a dynamic field study, and a static walking daytime study). |
| Methods
The research was conducted through the four field studies listed below, plus an economic analysis of tradeoffs in size and sheeting reflectance.
- Two static in-vehicle studies (studies 1 and 4) measured legibility from within a vehicle so that the variability of sign luminance was simulated
as a function of retroreflective properties of materials and headlamp beam patterns.
- A dynamic field study (study 2) measured legibility and conspicuity from a moving vehicle as the vehicle was driven through complex visual
surroundings.
- A static walking daytime study (study 3) was implemented where nighttime measurements and head lighting were not of interest.
|
| Key Terms
Traffic Signs, Legibility, Conspicuity, Retroreflectivity, Sign Size, Legend Size |
Key Results
- Driver age had the greatest effect on both legibility and conspicuity. Daytime legibility for older drivers was almost as poor as nighttime
legibility.
- Level of retroreflectivity, letter series, and letter height all had a significant effect on legibility.
- Increases in letter height resulted in proportionate increases in legibility up to about 183 m (600 ft).
- In most cases, stroke width, letter spacing, and font were not significant; however, with fully retroreflective signs, a narrow stroke width
significantly increased the legibility of high-contrast signs.
- Using spacing narrower than the standard spacing did significantly reduce legibility.
- With regard to conspicuity, 0.91-m (36-inch) signs with type I sheeting were found to have detection distances equivalent to 0.61-m (24-inch)
signs with type VII sheeting.
- Black-on-white signs were found to have much shorter detection distances than black-on-orange or white-on-green signs.
|
|
Figure A. Average nighttime threshold detection distance of signs.
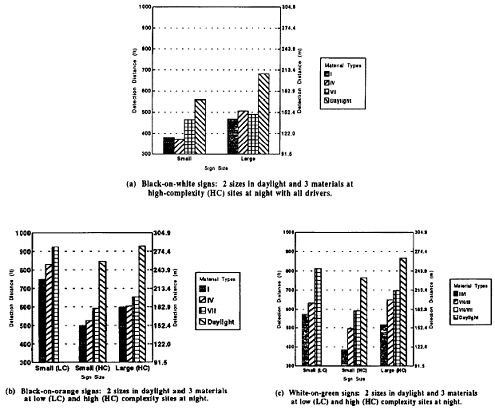
|
Conclusions, Recommendations, Best Practices, Design Implications, or Design Guidelines
- An additional study is needed to cross-validate the results of this research with regard to the effects of retroreflective materials on nighttime
legibility.
- Additional studies of letter spacing should be done using multiple and longer words.
- A study is also needed to determine how much the legibility curve flattens with increases in letter size beyond the 0.41-m (16-inch) letters
tested in this study.
- With regard to conspicuity, there is also a need to study signs in larger sizes.
|
| General Comments None |
| Title
An Implementation Guide for Minimum Retroreflectivity Requirements for Traffic Signs (FHWA-RD-97-052)
|
Funding Agency and Contact Address Office of Safety and Traffic Operations
Research and Development
Federal Highway Administration
6300 Georgetown Pike
McLean, VA 22101-2296
COTR:
Not Specified
|
| Authors McGee, H.W., and Paniati, J.A. |
| Publication Date April 1998 |
Number of Pages 57 |
| Document Web Site None |
| Source Type Guidelines and Recommendations |
| Driving Conditions Normal |
Vehicle Platforms Not Specified |
| Objective To provide specific guidelines for required retroreflectivity levels for traffic signs. |
| General Approach FHWA embarked on a comprehensive research program that resulted in recommended guidelines for minimum
retroreflectivity values for four types of signs: Yellow or orange warning signs, white-on-red regulatory signs, white regulatory signs, and white-on-green
guide signs. |
Methods
- Initially, the report describes the principles of retroreflectivity, the types of retroreflective materials, and the proposed minimum
retroreflectivity guidelines.
- The report then presents the concept of a sign management system and provides guidance for developing a sign inventory, conducting sign
inspections, and maintaining signs.
- The report concludes with a discussion of options that State and local agencies can follow for replacing their ineffective signs and offers a
minimum desirable program.
|
| Key Terms Traffic Signs, Retroreflectivity, Inventory |
| Key Results Types of Retroreflective Sheeting Materials:
- Type I: Medium-intensity retroreflective sheeting referred to as “engineering grade,” which is typically enclosed lens
glass-bead sheeting.
- Type II: Medium-intensity retroreflective sheeting sometimes referred to as “super-engineering grade,” which is typically
enclosed lens glass-bead sheeting.
- Type III: High-intensity retroreflective sheeting, which is typically encapsulated glass-bead retroreflective material.
- Type IV: High-intensity retroreflective sheeting, which is typically a nonmetallized, microprismatic retroreflective element material.
Sign Management System:
A sign management system is defined as a coordinated program of policies and procedures that ensures that the highway agency provides a sign system that
meets the needs of the user most cost-effectively within available budgets and constraints.
- Sign inventory: A comprehensive inventory can serve the following purposes: Target signs for replacement, identify problems, minimize
tort liability, plan and budget for sign replacement, and maximize productivity. The following is a seven-step process for the planning and
development of an effective sign inventory: Involve key personnel, select a location reference system, choose data elements, select inventory
software, prepare for data collection, perform initial data collection, and maintain inventory.
- Sign inspection: Signs can be deficient in any number of ways. The following is a list of items that should be checked: Condition of sign
face, discoloration, streaking or fading, visibility of the sign, dirt, vandalism, orientation and structural stability, usefulness or
appropriateness, and poor retroreflectivity level.
- Sign maintenance: The following are sign maintenance activities: Cleaning the sign face, removal of spray paint, maintaining adequate
visibility by cutting back or removing foliage, reorientation, and replacement of the sign post.
Minimum Retroreflectivity Implementation Guidelines:
- Minimum program: The minimum program consists of the following elements: Computerized inventory, inspection, and replacement.
- Desirable program: The most desirable program is to implement an integrated computerized sign management system. Under such a program,
nearly all activities related to signage would be integrated through a system of computer modules.
|
| Conclusions, Recommendations, Best Practices, Design Implications, or Design Guidelines
The key to the successful implementation of any level of sign management system will lie with the commitment and dedication of the staff. This starts with
management who provide the tools, direction, and supervision. It continues when there is a person responsible for the continuous operation of the program.
And finally, it requires a conscientious sign crew of inspectors and maintenance personnel who understand the merits of the program and ensure that the
information they provide is accurate and timely.
|
| General Comments None |
| Title Field Surveys of Pavement Marking Retroreflectivity
(Transportation Research Record 1657, pp. 71-78) |
Funding Agency and Contact Address Federal Highway Administration
6300 Georgetown Pike
McLean, VA 22101-2296
COTR:
Michael Griffith |
| Authors Migletz, J., Graham, J.L., Bauer, K.M., and Harwood, D.W. |
| Publication Date 1999 |
Number of Pages 8 |
| Document Web Site None |
| Source Type Field Test |
| Driving Conditions N/A |
Vehicle Platforms N/A |
| Objective To determine how the retroreflectivity of pavement markings changes over a winter season. |
| General Approach
Field surveys of pavement marking retroreflectivity were conducted throughout the United States. Thirty–two State and local highway agencies
participated in the study by identifying pavement marking sites for measurement. The retroreflectivity of both white and yellow pavement marking lines of six
different marking materials was measured in the field. |
| Methods Site Selection:
- Sites at which the retroreflectivity of pavement markings was measured were selected by 32 State and local highway agencies.
Field Data Collection:
- Six different marking materials were measured (conventional paint, waterborne paint, epoxy, polyester,thermoplastic, and tape).
- Six roadway types were considered (rural freeways, rural multilane highways, rural two-lane highways,
urban freeways, urban multilane highways, and urban two-lane highways).
- Field data were collected in fall 1994 for all of the sites selected by all 32 participating highway agencies.Selected sites for six of the
participating highway agencies were remeasured in spring 1995.
- All field measurements were made with a Retrolux Model 1500 retroreflectometer.
- Measures of Effectiveness:
- Retroreflected luminance (RL mcd/m2/lux), obtained directly in the field from retroreflectometer readings, was the
primary measure of effectiveness.
- Luminance contrast ratio (CR).
|
| Key Terms Pavement Markings, Retroreflectivity Levels, Pavement Types |
| Key Results
Results Fall 1994 Survey:
RL by color and type of line:
- The mean RL value for yellow lines was 133.3 mcd/m2/lux, while that for white lines was 203.1 mcd/m2/lux,
based on 18,115 measurements for yellow lines and 20,641 measurements for white lines.
- The mean RL value for white edgelines was 200.7 mcd/m2/lux, while that for white lane lines was 208.0 mcd/m2
/lux,with comparable standard deviations (137.2 and 140.3 mcd/m2/lux, respectively).
RL by pavement marking material and color of line:
- The mean RL values for white lines ranged from 158.0 mcd/m2/lux for conventional paint markings to 329.7
mcd/m2/lux for tape markings. For yellow lines, the mean RL values range from 116.6 mcd/m2/lux for waterborne paint
markings to 326.7 mcd/m2/lux for tape markings.
Contrast ratio by color and type of line:
- The mean contrast ratio for white lines is 14.3, while that for yellow lines is 9.2, showing that white lines tend to have higher contrast ratios
than yellow lines.
Comparison of Results Fall 1994 and Spring 1995 Surveys:
RL by color and type of line:
- Yellow lines have lower RL values than white lines (see table). The effect of the winter season on pavement marking retroreflectivity
is about the same for yellow and white pavement markings, both of which decreased by 24 percent in mean RL between the fall 1994 and
spring 1995 surveys.
- The results show that the material type most affected by the passage of the winter season was waterborne paint, for which there was a 34 percent
decrease in mean RL for white markings and a 21 percent decrease for yellow markings.
Contrast ratio by color of line and pavement type:
- Contrast ratios for white lines decreased from 13.2 to 7.3 (45 percent) over the winter season. Similarly, the contrast ratios for yellow lines
decreased from 7.0 to 3.0 (57 percent) over the winter season.
- Pavement type has a potentially important effect on the pavement marking contrast ratio because asphaltic cement (AC) and portland cement concrete
(PCC) pavement surfaces generally have different colors and retroreflectivities.
- On AC pavements, the contrast ratios of white lines decreased from 14.0 to 8.2 (41 percent), while the contrast ratios of yellow lines decreased
from 6.5 to 3.1 (52 percent).
- On PCC pavements, the contrast ratios of white lines decreased from 11.9 to 5.8 (51 percent), while the contrast ratios of yellow lines decreased
from 9.4 to 2.6 (72 percent).
Table A. Comparison of mean retroreflectivity levels between fall 1994 and spring 1995 seasons for selected sites in Iowa and Minnesota.
| |
Pavement Marking Materia |
| Tape |
Epoxy |
Conventional Paint |
Waterborne Paint |
All |
| White Markings |
| Spring 1995: Mean RL (mcd/m2/lux) |
134.2 |
142.3 |
120.5 |
116.0 |
125.3 |
| Fall 1994: Mean RL (mcd/m2/lux) |
201.5 |
170.8 |
157.2 |
175.9 |
165.8 |
| Difference in Mean RL (mcd/m2/lux) |
-67.3 |
-28.8 |
-36.7 |
-59.9 |
-40.5 |
| Percent change in mean RL (percent) |
-33.4 |
-16.9 |
-23.4 |
-34.1 |
-24.4 |
| Yellow Markings |
| Spring 1995: Mean RL (mcd/m2/lux) |
–a |
97.4 |
77.0 |
90.3 |
79.0 |
| Fall 1994: Mean RL (mcd/m2/lux) |
–a |
114.9 |
101.9 |
114.4 |
103.4 |
| Difference in Mean RL (mcd/m2/lux) |
–a |
-17.5 |
-24.9 |
-24.1 |
-24.4 |
| Percent change in mean RL (percent) |
–a |
-15.2 |
-24.4 |
-21.1 |
-23.6 |
| a Data unavailable |
From Transportation Research Record 1657, Transportation Research Board, National Research Council, Washington, DC, 1999, table 2,p. 75. Reprinted
with permission. |
Conclusions, Recommendations, Best Practices, Design Implications, or Design Guidelines
- The coefficient of retroreflected luminance and luminance contrast ratio of pavement markings in actual service are strongly influenced by the
color of the marking and the marking material.
- The mean retroreflectivity of pavement markings in the spring season was 15 to 34 percent lower than that of the same markings in the previous
fall. The decrease in pavement marking retroreflectivity with the passage of a winter season varies with the color of the pavement marking and marking
material.
|
| General Comments None |
| Title
Relative Luminance of Retroreflective Raised Pavement Markers and Pavement Marking Stripes on Simulated Rural Two–Lane Roads
(Transportation Research Record 1844, pp. 45-51) |
Funding Agency and Contact Address
Federal Highway Administration
6300 Georgetown Pike
McLean, VA 22101-2296
COTR: Not Specified
|
| Authors Molino, J.A., Opiela, K.S., Anderson, C.K., and Moyer, M.J. |
| Publication Date 2003 |
Number of Pages 7 |
| Document Web Site None |
| Source Type Simulator Study |
| Driving Conditions Normal |
Vehicle Platforms Light Vehicles |
| Objective To determine the relative luminance of retroreflective raised pavement markers (RRPMs) and pavement markings
(PMs) needed to produce adequate guidance on rural two-lane roadways at night. |
| General Approach
A driving simulator was used to test 36 research participants as they drove simulated roadways containing various combinations of retroreflective RRPMs and
PMs. The luminance of the simulated roadway delineation ranged from 0.07 to 4.1 cd/m2. The primary driver performance measure was curve
recognition
distance. |
| Methods Research Participants:
- The 36 research participants were divided into 3 age groups of 12 participants each: Younger drivers (ages 18 to 30),middle-aged drivers (ages 31
to 64), and older drivers (age 65 and older).
Driving Simulator:
- The experiment was conducted in the FHWA fully interactive High-Fidelity Highway Simulator located at the Turner–Fairbank Highway Research
Center.
Roadway Scenarios:
- The visual scenarios consisted of straight segments of simulated roadways containing different delineation treatments.These roadway scenes usually
led to curves.
- The research participants drove these scenarios at either 56 or 88 km/h (35 or 55 mi/h).
- The RRPMs were vertically oriented yellow polygons about 10 cm (4 inches) wide and 5 cm (2 inches) high in scale.They were spaced 24 m (80 ft)
apart in the tangent segments and 12 m (40 ft) apart in the curves.
- The PMs were flat shaded polygons about 10 cm (4 inches) wide in scale. Both the RRPMs and the PMs were saturated colors, either yellow or white,
as appropriate.
Procedure:
- The participant drove the simulator vehicle along the simulated straight roadway until they detected a curve and could recognize whether it turned
to the right or to the left. At that point, the research participant pressed one of two response buttons (one that corresponded to each perceived
direction of curve) on the steering wheel in the passenger car cab.
Independent Variables:
- Luminance level (none, low, medium, high).
- Pavement markings (double yellow centerline and a single white edgeline, only a double yellow centerline).
- Environmental lighting (night scene, black background).
- Driving speed (56 and 88 km/h (35 and 55 mi/h)).
Dependent Variables:
- Curve recognition distance, vehicle speed, and vehicle lane position.
|
| Key Terms Relative Luminance, Retroreflectivity, Raised Pavement Markers, Pavement Marking, Visibility |
Key Results
- The overall results of the experiment are shown in the table below.
- An ANOVA on all the curve recognition data revealed statistically significant main effects for PM luminance (F(3, 6) = 52.37, p <0.001
), RRPM luminance (F(3, 6) = 32.61, p < 0.001), and for the age group (young, middle–aged, or old) of the research participant (
F(2, 9) = 17.65, p <0.001).
- For both RRPM and PM luminance, higher luminance levels were associated with longer curve recognition distances. Examination of the None
conditions reveals that the PM luminance had a somewhat stronger effect on recognition distance than the RRPM luminance.
- The shortest mean curve recognition distance was 19 m (62 ft) for the None-None condition, with which there were no RRPMs or PMs to guide the
driver.
- The longest mean distance was 68.4 m (224 ft) for the High-High condition, with which both RRPMs and the PMs were at their highest luminance.
- The RRPM and PM luminances produced strong and significant effects for all three age groups. The younger age group had the longest mean curve
recognition distances, ranging from 23.69 to 80.20 m; the older age group had the next longest mean distances, ranging from 17.93 to 64.40 m; and the
middle-aged group had the shortest mean distances, ranging from 15.38 to 60.36 m.
- With lateral lane position as the dependent variable, the presence or absence of edgelines had the strongest effect (F (1, 9,200) = 195.2, p
< 0.001). Without edgelines, the mean lane position was 1.93 m, substantially to the right of the center of the lane. With edgelines, it was
1.77 m, slightly to the left of the center of the lane.
Table A. Mean curve recognition distance (m) and standard errors of the mean.
| |
RRPM Luminance |
| None |
Low |
Medium |
High |
| PM Luminance |
High |
56.46
(1.49) |
55.65
(1.26) |
60.68
(1.24) |
68.35
(1.54) |
| Medium |
33.62
(1.22) |
38.86
(1.47) |
45.79
(1.68) |
51.97
(1.30) |
| Low |
27.08
(1.26) |
31.60
(1.33) |
36.91
(1.21) |
49.18
(1.59) |
| None |
19.00
(1.67) |
29.81
(2.33) |
34.15
(2.10) |
48.81
(1.72) |
From Transportation Research Record 1844, Transportation Research Board, National Research Council, Washington, DC, 2003, table 2, p. 48. Reprinted
with permission.
|
Conclusions, Recommendations, Best Practices, Design Implications, or Design Guidelines
- For the various RRPM and PM luminance conditions, mean curve recognition distances ranged from 19.0 m (62.3 ft) to 68.4 m (224 ft), with a grand
mean of 43.0 m (141 ft).
- Trading ratios were computed for PM luminance with and without RRPMs present on the road. A conservative estimate of 0.52 was computed for such a
trading ratio based on the data. This value compared favorably with independent estimates of 0.54 and 0.55 based on an earlier analytical approach.
- The current experiment confirmed, with empirical data, earlier estimates that it might be possible to reduce the luminance of PMs on rural two-lane
roads by about 45 percent when appropriate RRPMs are installed.
|
| General Comments None |
| Title
Improvement of Conspicuity of Trailblazing Signs, Phase III:Evaluation of Fluorescent Colors (FHWA/VTRC-01-CR4)
|
Funding Agency and Contact Address Federal Highway Administration
P.O. Box 10249
Richmond, VA 23240
COTR: Not Specified |
| Authors Neale, V.L., Anders, R.L., Schreiner, C.S., and Brich, S.C. |
| Publication Date February 2001 |
Number of Pages 60 |
| Document Web Site None |
| Source Type Field Test |
| Driving Conditions Normal |
Vehicle Platforms Light Vehicles |
| Objective
To determine if there is improved conspicuity with fluorescent signing materials when compared to the nonfluorescent yellow–on–purple sign
that was used in the phase II study. |
| General Approach
Ninety–one drivers were exposed to four sign combinations. The colors evaluated were fluorescent coral,fluorescent purple, fluorescent yellow-green,
and nonfluorescent purple. |
| Methods Independent Variables:
- Sign color (yellow on nonfluorescent purple, black on fluorescent yellow-green, black on fluorescent coral,fluorescent yellow on
fluorescent purple).
- Age (younger drivers (ages 18 to 34), older drivers (age 55 and older)).
- Visibility condition (daytime, nighttime): Between subjects
Dependent Variables:
- Late braking reaction.
- Number of wrong and missed turns.
- Subjective acceptance and preference measures.
|
| Key Terms Incident Management, Conspicuity, Signage, MUTCD, Reserved Sign Colors, Older Drivers, Fluorescent |
| Key Results
Driving Performance:
- There were no significant differences in driving performance with regard to the four experimental sign color combinations.
Subjective Preference Questionnaires:
- Significant questionnaire results, along with trend information, suggest that black on fluorescent yellow-green was the most preferred by younger
and older drivers under both daytime and nighttime visibility conditions (see table A). However, this sign color has been assigned by FHWA for
pedestrian, school, and bicycle crossings, which eliminates the use of this sign color for trailblazing in incident management situations.
- Preference for nonfluorescent yellow on purple consistently increased at night when the sign became more luminant;however, the overall preference
for this sign color combination was lower than for the other sign combinations tested in this study.
- With the elimination of these two signs, the remaining contenders for a unique sign color combination were black on fluorescent coral and
fluorescent yellow on fluorescent purple.
- Black on fluorescent coral was ranked significantly higher than fluorescent yellow on fluorescent purple for visibility and for overall
preference (see table B).
- Questionnaire trend information suggests that black on fluorescent coral was preferred more than fluorescent yellow on fluorescent purple under
daytime viewing conditions and preferred less than fluorescent yellow on fluorescent purple under nighttime viewing conditions.
Table A. Question 1 mean rating for assessment by age.
| Sign Color Combination |
Younger Mean*/STD (number) |
Older Mean/STD (number) |
Significance Level for Age Condition |
| Yellow on Purple (nonfluorescent) |
3.67/0.62
(N = 12) |
3.64/0.64
(N = 11) |
F (1,75) = 0.79,
P= 0.3779 |
| Black on Fluorescent Yellow–Green |
4.50/0.48
(N = 11) |
4.33/0.47
(N = 9) |
| Black on Fluorescent Coral |
4.33/0.94
(N = 12) |
4.17/0.37
(N = 12) |
| Fluorescent Yellow on Fluorescent Purple |
4.00/0.82
(N = 12) |
3.92/0.28
(N = 12) |
* 1 = Not visible, 5 = Extremely visible. N = Sample size. p = Level of significance.
Table B. Question 4 rank sum values for assessment by sign color.
| Sign Color Combination |
Rank Sum* |
Analysis by Sign Color |
| Yellow on Purple (nonfluorescent) |
344 |
Results are significant
(p <0.001) |
| Black on Fluorescent Yellow-Green |
108 |
| Black on Fluorescent Coral |
191 |
| Fluorescent Yellow on Fluorescent Purple |
267 |
*Low number means higher ranking. |
| Conclusions, Recommendations, Best Practices, Design Implications, or Design Guidelines
Based on such driver comments, research conclusions, and Federal regulations enacted since the outset of this series of experiments, the following
recommendations are made:
- Black on fluorescent coral should be used as a unique incident management sign color.
- The directional arrow on the sign should be larger.
|
| General Comments None |
| Title Visibility and Comprehension of Pedestrian Traffic Signals (FHWA–RD–96–187) |
Funding Agency and Contact Address
Office of Safety and Traffic Operations
Research and Development
Federal Highway Administration
6300 Georgetown Pike
McLean, VA 22101–2296
COTR:
Carole Simmons
|
| Authors Pennak, S., Mace, D.J., and Finkle, M. |
| Publication Date May 1997 |
Number of Pages 66 |
| Document Web Site None |
| Source Type Literature Review, Laboratory Study |
| Driving Conditions Normal |
Vehicle Platforms Not Specified |
| Objective To determine performance criteria for acceptable pedestrian signal visibility and study the comprehension of
innovative and standard pedestrian signals. |
| General Approach
Two field studies and a video questionnaire were designed and implemented. The video questionnaire was developed to study the comprehension of innovative
and standard pedestrian crosswalk devices. |
| Methods
Literature Review:
- A review of previous research, pedestrian signal standards, and current practices was undertaken.
Visibility Study:
- Forty–eight seniors, age 62 and older, participated in this study.
- Test stimuli included several types of commercially available pedestrian signals (incandescent, fiber optic,and LED), including 22.9–cm and
30.5 –cm rectangular signal housings and two round 29–cm red–ambergreen (RAG) signals with symbol masks.
- Each subject was asked to identify the signal’s location in the test stimuli array, to name the signal’s display configuration ("
Walk, " "Don’t Walk," walking man, or hand), and to assess the signal’s brightness on a 5–point scale.
Video Questionnaire Study and the Comprehension of Pedestrian Signals:
- The same 48 elderly subjects who participated in the visibility study also viewed the video questionnaire. In addition, the video questionnaire
study included 43 school–age subjects ranging in age from 11 to 15 years.
- The 45 flashing and steady test stimuli were shown in curb and midcrossing contexts.
- Subjects were instructed to provide the meaning of the test stimuli by choosing one of four multiple-choice items on a paper-and-pencil answer
sheet.
|
| Key Terms Visibility, Comprehension, Pedestrian, Innovative Traffic Control Devices |
| Key Results Literature Review:
- The review of literature found that many factors can affect pedestrian crosswalk behavior. The ability of pedestrians to recognize crosswalk
signals can be a function of equipment characteristics such as signal size; signal luminance levels; viewing distance; and environmental conditions,
including sun position and surrounding complexity.
- Very little work has been done to delineate the intensity of luminance requirements necessary for adequate pedestrian signal visibility.
- Currently, incandescent lamps are the most common illumination source for traffic signals. However, this technology is widely believed to be
inefficient when compared to other light sources and has higher maintenance and energy costs. Alternatives are neon, fiber–optic (FO), and light
–emitting diode (LED) technologies.
Visibility Study:
- In general, the analysis of recognition, uncertainty, and overbright responses by voltage level suggests that 90 volts (V) is a reasonable voltage
to operate all of the signals tested. Ninety volts appeared to provide a signal intensity that minimized the frequency of both overbright and
uncertain responses, regardless of size, technology, or whether the message was symbol or text among the test signals.
- All of the incandescent signals, except the orange "Don’t Walk," produced some uncertainty with the signal intensities available at
60V. As the intensity increases, uncertainty decreases.
- All of the signals with intensities of 26 cd or greater resulted in zero level of uncertainty at 29.3 cm, except for the nonstandard white hand at
66 cd and the white "Walk" at 37 cd, which resulted in all correct responses and uncertainty for only one subject.
- None of the FO signals was incorrectly identified during the blank trials, indicating the absence of phantom effects for this technology. These
results suggest that if FO signals had been tested alone, the minimum intensity requirement would have been set much lower than 25 cd.
Video Questionnaire Study and the Comprehension of Pedestrian Signals:
- Curb–viewed signals:
- At least 90 percent of the subjects have the most correct answer of "it’s okay to cross" for the six green-and-white
curb-viewed signals shown in the steady mode, with 100 percent comprehension for the white "Walk," green "Walk,"and green
walking man symbol.
- There was significant viewer difficulty in the yellow curb signal comprehension, with only 65.9 percent correct responses.
- The four red "Wait on the Curb" signals shown only in a steady mode performed with at least 95 percent of the subjects providing
the correct response and 100 percent of the young subjects correctly understanding the red hand and red RAG.
- The innovative standing man was the least successful of the symbols and may contribute to pedestrian confusion.
- The innovative "Don’t Start" was ranked the highest in comprehension of the orange wait signals.
- Mid-crossing signals:
- Only the green-to-yellow signal transition had at least 90 percent correct responses for stimuli indicating "it’s OK to keep
crossing."
- At least 10 percent of the subjects thought the white-to-orange transitions meant "turn around and go back".
|
Conclusions, Recommendations, Best Practices, Design Implications, or Design Guidelines
- The results indicated that green and red are interchangeable in meaning with white and orange,respectively.
- A red slash man appears to be a strong alternative to a symbolic orange hand.
- The study on the visibility of actual pedestrian signals determined that a minimum signal intensity of 25 cd is adequate for any pedestrian signal
regardless of technology, distance, signal size, text, or symbol.
- It was recommended that a three-phase pedestrian signal be considered that would incorporate the strengths of green, yellow, and red with
innovative symbols.
|
| General Comments None |
| Title Pavement Markings and Delineation for Older Drivers,Volume I: Final Report (FHWA–RD–94–145) |
Funding Agency and Contact Address
Office of Safety and Traffic Operations
Research and Development
Federal Highway Administration
6300 Georgetown Pike
McLean, VA 22101-2296
COTR: Elizabeth Alicandri |
| Authors Pietrucha, M.T., Hostetter, R.S., Staplin, L., and Obermeyer, M. |
| Publication Date June 1996 |
Number of Pages 148 |
| Document Web Site None |
| Source Type Laboratory Study, Field Test |
| Driving Conditions Normal |
Vehicle Platforms Not Specified |
Objective
- Identify the needs of older drivers and evaluate the situations in which older driver performance might be improved through enhanced pavement
markings and delineation.
- Identify the range of potentially useful enhanced treatments.
- Determine the effectiveness of those treatments judged to be most useful for the older driver.
- Assess the costs and benefits of the treatment shown to be most effective.
|
| General Approach
Following a literature review to identify older driver deficiencies, 25 delineation/pavement marking treatments (including several control treatments) were
identified for testing. A laboratory simulator study was used as a means to determine the most effective among the group. The treatments shown to produce
better recognition distance, along with several control treatments, were then subjected to field testing. Following the field test performance assessment, the
treatments were subjected to a cost-benefit analysis and recommendations were made regarding the treatments that could benefit older drivers.
|
| Methods Laboratory Test:
Independent Variables:
- Delineation treatment: Twenty-five distinct treatments were used
- Driver age (young-middle aged (ages 18 to 45), young-old (ages 65 to 74), and old-old (age 75 and older)): Between subjects).
- Headlight illumination (low-beam headlight illumination, high-beam illumination).
Dependent Variables:
- Downstream roadway feature recognition.
- Subjective scaling of relative treatment effectiveness for each treatment.
Field Test:
- The field tests were conducted on a closed test track facility, and recognition distances and visual occlusion times were used as dependent
measures.
- Of the 66 subjects who participated in the field study, half were older than age 65 and half were age 45 or younger.
Independent Variables:
- Pavement marking treatments: Twelve treatments were selected based on the laboratory test results.
Dependent Variables:
- Recognition distance, visual occlusion, and subjective ratings.
|
| Key Terms Older Drivers, Delineation, Pavement Markings, Night Visibility |
| Key Results Laboratory Testing:
See table below for a list of treatments selected for field testing, based mostly on the results of laboratory testing.
Field Testing:
- Recognition distance:
- The recognition distance values obtained from the total sample ranged from a low of 19.5 m (64 ft) for the baseline treatment
(treatment 1) to a high of 279.5 m (917 ft) for the best treatment (treatment 12).
- However, there were six treatments that produced relatively long recognition distances and it was found that these were not significantly
different from one another.
- Among the six best treatments (treatments 5, 11, 6, 9, 10, and 12), the recognition distance values ranged from 253.3 m (831 ft) for
treatment 5 to 279.5 m (917 ft) for treatment 12.
- Treatments 7 and 8 resulted in longer recognition distances for left curves, whereas treatment 9 produced the longest distance for right
curves.
- With regard to the subjective data for the recognition distance trials, the treatment effect was highly significant; however, age group
was not. The results showed that the seven most highly rated treatments (treatments 5, 6, 8, 9,10, 11, and 12) were not significantly
different from one another.
- Visual occlusion, objective results:
- The authors felt that the measure of time in the visual occlusion data may be confounded by personality variables. On the basis of the
data, along with concerns about the influence of personality variables on performance, it is assumed that the occlusion time measure, as
implemented in the study, gives little basis for choosing the most adequate treatments for older drivers.
- Visual occlusion, subjective results:
- Only the treatment and subject factors produced statistically significant results. Neither age, curve direction, nor any interactions
achieved an acceptable (P = 0.05) level of significance.
- There were no significant differences between the seven most highly rated treatments.
Table A. Treatments selected for field testing.
| Simulator Treatment Number |
Field Treatment Number |
Treatment Description |
| 1 |
1 |
101.6-mm (4-inch) yellow centerline (baseline) |
| 6 |
2 |
101.6-mm (4-inch) yellow centerline and a 101.6-mm (structured) white edgeline,brightness at level 3 |
| 8 |
3 |
101.6-mm (4-inch) yellow centerline with yellow RPM and a wide spacing |
| 10 |
4 |
101.6-mm (4-inch) yellow centerline with yellow RPM and a wide spacing, and white edgeline RPM and wide spacing |
| 14 |
5 |
101.6-mm (4-inch) yellow centerline and normally mounted chevrons with highintensity retroreflective sheeting and standard spacing |
| 7 |
6 |
101.6-mm (4-inch) yellow centerline, 101.6-mm white edgeline, and normally mounted chevrons with high-intensity sheeting and standard spacing |
| 18 |
7 |
101.6-mm (4-inch) yellow centerline, a standard flat post and standard spacing |
| 19 |
8 |
101.6-mm (4-inch) yellow centerline and a standard post delineator + edgeline |
| 20 |
9 |
101.6-mm (4-inch) yellow centerline and a fully retroreflectorized standard flat post and standard spacing |
| 21 |
10 |
101.6-mm (4-inch) yellow centerline and high-intensity T-post delineators and standard spacing |
| 23 |
11 |
101.6-mm (4-inch) yellow centerline with yellow RPM and standard spacing and highintensity T-post delineators and standard spacing |
| 25 |
12 |
101.6-mm (4-inch) yellow centerline, a 101.6-mm white edgeline, and engineering grade T-post delineators lineators and standard spacing |
|
| Conclusions, Recommendations, Best Practices, Design Implications, or Design Guidelines
For the field testing, the treatments that produced good performances across objective and subjective measures and did well for the older driver group were
considered prime candidates for recommended use to improve the safety of older drivers. Use of these multiple criteria led to the choice of treatments 5, 10,
11, and 12. It was determined that treatments 12 and 10 provide the best overall performance. However, each of the four previously mentioned treatments can be
expected to improve the performance of older drivers.
|
| General Comments None |
| Title Visibility of New Dashed Yellow and White Center Stripes as a Function of Material Retroreflectivity
(Transportation Research Record 1553, pp. 73-80) |
Funding Agency and Contact Address
Human Factors and Ergonomics
Laboratory
Department of Industrial and
Manufacturing Systems Engineering
Ohio University
Athens, OH 45701
COTR:
Not Specified |
| Authors Zwahlen, H.T., and Schnell, T. |
| Publication Date 1996 |
Number of Pages 8 |
| Document Web Site None |
| Source Type Field Test |
| Driving Conditions Normal |
Vehicle Platforms Not Specified |
| Objective To determine the end detection distance of new centerlines made up by 0.1-m-wide pavement marking tape at night
under automobile low-beam illumination as a function of color (white and yellow) and of retroreflectivity RL . |
| General Approach Ten subjects were used in a field experiment (rural, automobile low-beam conditions) to obtain the end
detection distances of finite-length center stripes of 0.1-m width. |
| Methods Experimental Site:
- The Ohio University airport runway was used under dry and clear weather conditions. The runway is about 23 m wide and 500 m long.
- The vehicle was driven at 8 to 16 km/h in the lane assigned by the experimental design protocol such that the current center stripe treatment was
always located about 1.8 m to the left of the longitudinal passenger car axis.
- All center stripes were 3M pavement marking tape. The yellow and white low-retroreflectivity materials were specially manufactured for this
experiment.
Subjects:
- Five young, healthy female college students with an average age of 21.6 years and five young, healthy male college students with an average age of
22.4 years participated in the experiment.
Pavement Marking Materials:
- Low yellow: RL = 70 to 100 mcd/m2/lx
- Low yellow: RL = 200 to 450 mcd/m2/lx
- Low yellow: RL = 110 to 155 mcd/m2/lx
- Low yellow: RL = 250 to 390 mcd/m2/lx
- Low yellow: RL = 300 to 550 mcd/m2/lx
Independent Variables:
- Pavement marking retroreflectivity (low, medium, and high).
- Pavement marking color (white and yellow).
- Approach direction (east or west).
- Center stripe types (low–retroreflectivity white, medium-retroreflectivity white, high–retroreflectivity white,
low-retroreflectivity yellow, high-retroreflectivity yellow)
Dependent Variables:
- Detection distance to the end of the center stripe treatments.
|
| Key Terms Pavement Markings, Retroreflectivity, Visibility |
Key Results
- Factor line type (color and retroreflectivity) F(4, 36) = 27.98, p = 0.0001 was statistically highly significant. It was seen
that the high–retroreflectivity white material tends to provide the longest end detection distances, especially for higher percentiles (see
figure below).
- The high-retroreflectivity yellow and medium–retroreflectivity white materials perform almost equally well.
- Both the white and yellow low-retroreflectivity materials provide end detection distances that are considerably shorter than the end detection
distances obtained from all other materials.
- Overall, there appears to be no strong color effect. However, it appears that retroreflectivity has a strong influence on the end detection
distance.
Figure A. Psychometric curves showing cumulative frequenc y (percent) for end detection distance, eastbound, new yellow and white dashed center
stripes, low–, medium–, and high–reflectivity material on concrete road surface under low-beam illumination conditions at night.
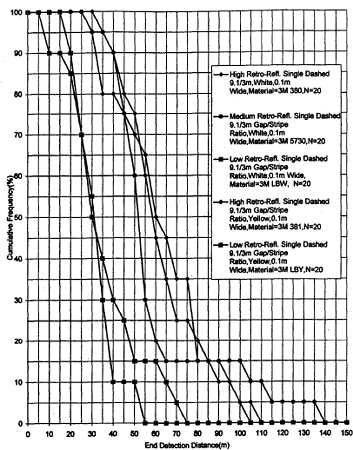
From Transportation Research Record 1553, Transportation Research Board, National Research Council, Washington, DC, 1996, figure 4, p. 78.
Reprinted with permission.
|
Conclusions, Recommendations, Best Practices, Design Implications, or Design Guidelines
The data show that the end detection distances of new yellow dashed center stripes and new white dashed center stripes are about the same.
The average end detection distance was 30 to 35 m for the low-retroreflectivity material and about 62 m for the high-retroreflectivity material
(a fourfold to fivefold retroreflectivity increase). It is tentatively concluded that the use of white center stripes most likely will not result in a significant increase in the end detection
distance when compared with the use of similar yellow center stripes. It is also tentatively concluded that an increase in the retroreflectivity of the pavement marking materials will result in a significant and
desirable increase in the visibility distance; however, to provide a minimum preview time of 3.6 s (at a vehicle speed of 90 km/h), even higher
retroreflectivity materials than the ones used in this study will be required.
|
| General Comments None |
| Title
Effects of Lateral Separation Between Double Center Stripe Pavement Markings on Visibility Under Nighttime Driving Conditions
(Transportation Research Record 1495, pp. 87-98)
|
Funding Agency and Contact Address
Human Factors and Ergonomics
Laboratory
Department of Industrial and Systems
Engineering
Ohio University
Athens, OH 45701-2979
COTR:
Not Specified
|
| Authors Zwahlen, H.T., Schnell, T., and Hagiwara, T. |
| Publication Date 1995 | Number of Pages 12 |
| Document Web Site None |
| Source Type Field Test |
| Driving Conditions Nighttime |
Vehicle Platforms Light Vehicles |
Objective
- Determine the visibility distances under automobile low-beam illumination at night for new yellow double solid center stripes as a function of the
lateral separation between the double stripes (0.05, 0.1, 0.15, and 0.2 m).
- Investigate the effect of retroreflective material area on beginning and ending detection distances.
|
| General Approach
A field test was conducted with 48 subjects to investigate the effects of various lateral separation conditions and center stripe types. |
| Methods Experimental Site:
- The Ohio University airport runway was used under dry and clear weather conditions. The runway is about 23 m wide and 500 m long.
- The vehicle was driven at 8 to 16 km/h in the lane assigned by the experimental design protocol such that the current center stripe treatment was
always located about 1.8 m to the left of the longitudinal passenger car axis.
Subjects:
- Ten young, healthy female college students with an average age of 26.77 years and 38 young, healthy male college students with an average age of
23.1 years participated in the experiment.
- The subjects were distributed into four groups.
Experimental Vehicles:
- Groups 1 through 3 used a 1981 Volkswagen Rabbit with H6054 headlamps with a line-of-sight windshield transmission of 0.77.
- Group 4 used a 1994 Ford Probe with a line-of-sight windshield transmission of about 0.7.
Independent Variables:
- Lateral separation between the double center stripes (0.05, 0.1, 0.15, 0.2 m).
- Approach direction (east or west).
- Center stripe types (double solid line that is 0.1 m wide, double solid line that is 0.05 m wide, double dashed line that is 0.05 m wide
and has a gap/stripe ratio of 9.15/3.05 m, double dashed line that is 0.05 m wide and has a gap/stripe ratio of 10.98/1.22 m).
Dependent Variables:
- Average detection distances of the beginning and the end of the center stripe treatments.
|
| Key Terms Visibility, Retroreflectivity, Pavement Markings |
Key Results
The results for group 1 show that the end detection distances are somewhat longer than the beginning detection distances. Within the beginning
detection distances, there is an obvious lack of an effect caused by lateral center stripe separations. Within the end detection distance, one can observe
from the group 1 data a slight tendency for the larger lateral separations to provide slightly longer detection distances (see figure below). Group 2 data shows that the end detection distances are considerably longer than the beginning detection distances. The ANOVA that was conducted
confirmed a highly significant difference between the beginning and ending detection distances. In regard to the effect of available retroreflective area on the 85th percentile detection distance for center stripe types 1 through 4,
there appear to be several limitations in terms of increasing the detection distances by increasing the amount of retroreflective material used. The
positive effect of using more retroreflective material may be gradually outdone by the increased cost for the additional material. Furthermore, the gain in the 85th percentile end detection distance as a function of retroreflective material area seems to
asymptotically approach a maximum of about 85 m.
Figure A. Group 1 psychometric curves showing cumulative frequency (percent) for beginning and ending detection distances of new yellow 0.05-m-wide
solid center stripes with lateral separations of 0.05, 0.1, 0.15, and 0.2 m on a concrete road surface under low-beam illumination at night as a function of
detection distance (in meters). (Beginning detection distance values may be too short because of the limited available approach distance.)
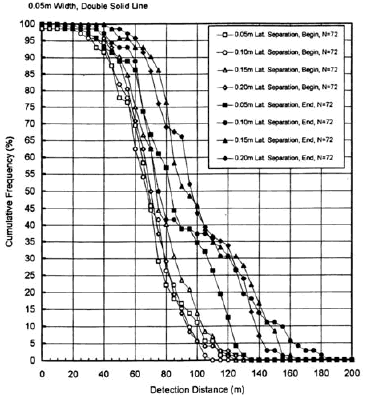
From Transportation Research Record 1495, Transportation Research Board, National Research Council, Washington, DC, 1995, figure 3,p. 93. Reprinted
with permission. |
Conclusions, Recommendations, Best Practices, Design Implications, or Design Guidelines
An ANOVA and Scheffe post hoc test failed to find any significant systematic effect caused by lateral separation between the centerlines.
On the basis of the findings, it is possible to tentatively conclude that an increase in the lateral separation (from 0.05 to 0.2 m) between the
double center stripes does not appear to be a useful method to increase driver visibility. The amount of retroreflective material has a fairly small effect on the 85th percentile end detection distances, thus indicating a
relatively small marginal gain in visibility with a substantially increased retroreflective area. Calculations indicate that an increase in area from 0.122 to 2.44 m2 for each 12.2–m–long centerline segment (twentyfold
increase) is required to increase the average end detection distance from 82 to 128 m, which is only an increase of 56 percent.
|
| General Comments None |
FHWA-HRT-06-034
|