Evaluation of Shared Lane Markings
CHAPTER 5. CHAPEL HILL, NC, EXPERIMENT
INTRODUCTION
In Chapel Hill, NC, sharrows were placed on Martin Luther King Jr. (MLK) Boulevard, which is a four-lane undivided route with a center, two-way left-turn lane. The route has no parking, 27,000 vehicles per day, and a speed limit of 35 mi/h. The street serves as a major corridor to the University of North Carolina (UNC) and has approximately 40–70 bicyclists per day. In previous counts, about one-third of the bicyclists were riding on the adjacent sidewalk. There is a 3 to 4 percent grade at the location where data were collected, allowing an examination of whether the effects of sharrows differ for downgrade and upgrade (see figure 11).
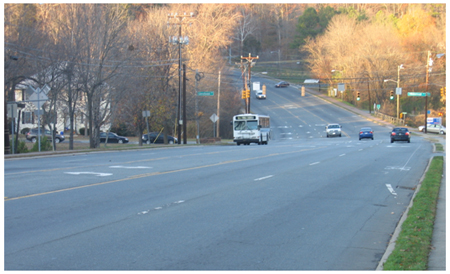
Figure 11. Photo. Outbound view of MLK Boulevard.
The MLK corridor serves several bus routes to campus and back. The outside lanes are nominally 15 ft wide, including a 2-ft gutter that was paved over when the street was resurfaced. Sunken 24-inch-wide drainage grates remain along the route, and there is some reemergence of a seam between the gutter pan area and the original travel lane (see figure 11). Each drainage grate is highlighted with a transverse marking; otherwise, there were no prior markings in the wide outside lane. These transverse markings were present throughout the study period. There are also sporadic "Share the Lane" signs along the corridor but none in the immediate area where data were collected.
Sharrows were placed 43.5 inches from the curb with approximate 200-ft spacing on both sides of a 1.25-mi corridor. Videotape data were collected at the midpoint of the corridor. Sketches of the cross section before and after installation are provided in figure 12.
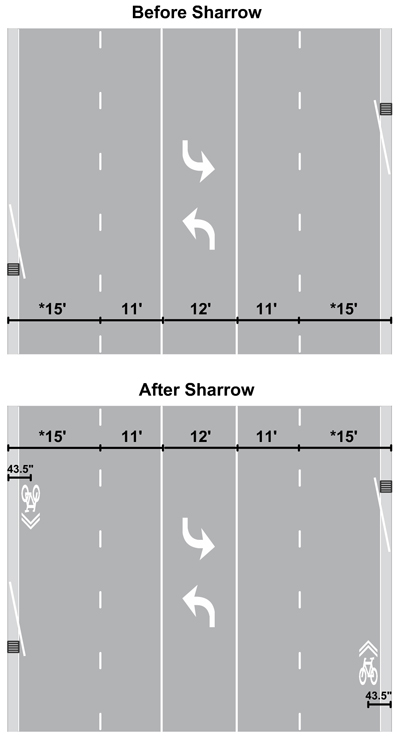
* Indicates that a 2-ft gutter pan was included.
Figure 12. Illustration. Cross section view of MLK Boulevard before and after sharrow installation.
A variety of hypotheses were examined in this experiment. The sharrow placement served to identify a lane position for bicyclists that would place them outside of the drainage grate/gutter pan area and highlight that the lane was meant to be shared with motor vehicles. If bicyclists tracked over the middle of the sharrow, their placement would be 19–20 inches away from the drain grates. In addition to avoiding the unsafe drain grates, tracking further away from the curb could enhance bicyclists' visibility at junctions along the corridor and potentially provide greater space to maneuver when being overtaken by motorists. The sharrows might provide a cue for more consistent positioning or tracking, particularly if weaving around the drainage grates is present. The sharrows might also affect anticipation and interactions with overtaking motorists by promoting more consistent motor vehicle tracking, fewer sudden changes in speed or direction, and fewer unexpected encroachments into the adjacent lane that may result in conflicts with other motorists. However, tracking further from the curb could potentially place bicyclists closer to overtaking motorists if the motorists do not allow sufficient lateral spacing when passing.
In addition, sharrows could improve safety along this corridor by inducing more bicyclists to ride on the street with the flow of traffic compared to on the adjacent sidewalk or in the wrong direction. Frequent crashes occur between bicyclists riding on the sidewalk and motorists turning in and out of driveways and at intersections in this segment.
DATA COLLECTION AND REDUCTION
Local data collectors videotaped bicyclists riding along MLK Boulevard before and after placement of the sharrows along the street. Before data were collected from October 2007 through June 2008, and after data were collected from August 2008 through June 2009. Inbound (uphill) and outbound (downhill) traffic was videotaped at a midblock location south of Hillsborough Street. Videotaping was performed on weekdays when it was not raining. After videotaping was complete, SigmaScan® was used to examine images from the videotapes to determine the spacing measures.(13) Approximately 150–200 images were obtained for both the uphill and downhill directions for each condition. The categories of images included: (1) bicycle to curb without being affected by a following motor vehicle, (2) bicycle to passing motor vehicle, and (3) motor vehicle to curb with no bicycles present. The videotapes were also used to code other variables pertaining to the interactions of bicycles and motor vehicles.
Data for two other elements were also collected during the before and after periods. Free-flowing speeds of motor vehicle traffic were obtained with laser radar. In addition, counts of bicyclists according to riding position (in a travel lane or on the sidewalk) and by direction (in the direction of traffic or facing the flow of traffic) were obtained.
RESULTS
The results pertain to a number of variables and were derived from the spacing images extracted from the videotapes as well as from the coding of the bicycle and motor vehicle interactions. Because the bicycle counts were low, researchers extracted as many images as possible for the bicycle-to-curb category and obtained 155 in the before period and 191 in the after period. For the bicycle-to-passing motor vehicle category, researchers obtained 200 images in the before period and 195 in the after period as independent multiple motor vehicles sometimes passed the bicyclist. For the motor vehicle-to-curb category, researchers obtained 200 images for each period. When coding the interactions between bicycles and motor vehicles, researchers obtained 519 observations in the before period and 420 in the after period. Totals in the subsequent tables deviating from these numbers represent missing values. Chi-square tests were used to compare the distributions. The following sections pertain to the coded videotape data.
Direction of Travel
The number of bicyclists on the observed route was relatively low. For the coded videotape data pertaining to the interactions of bicycles and motor vehicles, the direction of travel was unbalanced (see table 14). In the before period, 48 percent of the interactions were uphill and 52 percent were downhill. In the after period, 59 percent of the interactions were uphill and 41 percent were downhill. These differences were statistically significant (p = 0.0009). The table reflects bicycle/motor vehicle interactions, and many bicyclists had multiple interactions with following or passing motor vehicles. Some of the differences could be a result of bicyclists needing more time to travel uphill for the inbound direction. Given more exposure, these bicyclists tend to be passed by more motor vehicles. The uphill versus downhill factor will be examined and described in subsequent tables where there were differences in the distributions.
Table 14. Direction of travel, Chapel Hill, NC.
Direction |
Before Period |
After Period |
Total |
Uphill |
249
(48.2)1 |
248
(59.1) |
497
(53.0) |
Downhill |
268
(51.8) |
172
(41.0) |
440
(47.0) |
Total |
517
(55.2)2 |
420
(44.8) |
937
(100.0) |
Bicyclist Data
Males accounted for 86 percent of the bicyclists, and females accounted for 14 percent. Table 15 shows that there were differences in gender in the before period versus the after period (p = 0.0371). It is not known why the percentage of males increased in the after period, but it is believed that these differences were not related to the experiment. A total of 85 percent of bicyclists wore a helmet and 15 percent did not, and there was no difference in the before period versus the after period.
Table 15. Gender of bicyclists, Chapel Hill, NC.
Gender |
Before Period |
After Period |
Total |
Male |
435
(83.8)1 |
372
(88.6) |
807
(85.9) |
Female |
84
(16.2) |
48
(11.4) |
132
(14.1) |
Total |
519
(55.3)2 |
420
(44.7) |
939
(100.0) |
The percentage of female bicyclists decreased from 15 to 6 percent in the downhill direction, and the percentage of male bicyclists increased from 85 to 94 percent in the downhill direction from the before period to the after period (p = 0.0085).
Motor Vehicle Data
Table 16 shows the proximity of motor vehicles to bicycles by period. In the before period, 8 percent of motor vehicles followed bicycles (i.e., did not pass), and 92 percent passed. In the after period, 9 percent of motor vehicles followed bicycles, and 91 percent passed. The differences were not statistically significant (p < 0.7092). About 98 percent of the bicycles traveling uphill were passed.
Table 16. Motor vehicle proximity to bicycles, Chapel Hill, NC.
Motor Vehicle Proximity |
Before Period |
After Period |
Total |
Following |
41
(7.9)1 |
36
(8.6) |
77
(8.2) |
Passing |
478
(92.1) |
384
(91.4) |
862
(91.8) |
Total |
519
(55.3)2 |
420
(55.2) |
939
(100.0) |
Table 17 shows whether motor vehicles changed lanes when overtaking bicycles. In the before period, 18 percent of motor vehicles completely changed lanes, 58 percent moved partway into the next lane, and 24 percent stayed in the lane behind the bicycle ("No movement"). In the after period, 17 percent of motor vehicles completely changed lanes, 52 percent moved partway into the next lane, and 32 percent stayed in the lane behind the bicycle. The differences were statistically significant (p = 0.0409).
Table 17. Motor vehicles that changed lanes, Chapel Hill, NC.
Method |
Before Period |
After Period |
Total |
Changed lanes |
93
(17.9)1 |
70
(16.7) |
163
(17.4) |
Moved partway |
300
(57.8) |
217
(51.7) |
517
(55.1) |
No movement |
126
(24.3) |
133
(31.7) |
259
(27.6) |
Total |
519
(55.3)2 |
420
(44.7) |
939
(100.0) |
For the downhill direction from the before to the after period, there were significant differences (p = 0.0451) as follows:
- The percentage of motor vehicles changing lanes increased from 17 to 21 percent.
- The percentage of motor vehicles staying in the lane behind the bicyclist increased from 26 to 34 percent.
- The percentage of motor vehicles moving partway into the next lane decreased from 57 to 45 percent.
The following uphill direction differences from the before period to the after period were not significant:
- The percentage of motor vehicles changing lanes decreased from 19 to 14 percent.
- The percentage of motor vehicles staying in the lane behind the bicyclist increased from 23 to 30 percent.
- The percentage of motor vehicles moving partway into the next lane decreased slightly from 58 to 56 percent.
Figure 13 shows a motor vehicle passing a bicycle when there is traffic in the adjacent lane after the sharrow was introduced.
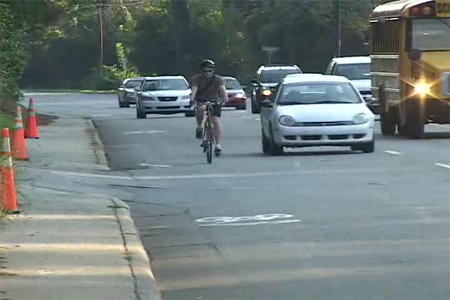
Figure 13. Photo. Motor vehicle passing a bicycle after sharrow placement with traffic in the adjacent lane.
Table 18 presents data showing whether the motor vehicle overtaking event was considered safe (no sudden slowing or abrupt changes in trajectory). In the before period, 94 percent of the motor vehicle overtaking events were considered to be performed safely, 3 percent not safely, and a determination could not be made for 3 percent. In the after period, 96 percent of the motor vehicle overtaking events were considered to be performed safely, 1 percent not safely, and a determination could not be made for 3 percent. The differences were statistically significant (p = 0.0372).
Table 18. Safety of the overtaking motor vehicle, Chapel Hill, NC.
Safe Overtaking |
Before Period |
After Period |
Total |
Yes |
488
(94.0)1 |
404
(96.2) |
892
(95.0) |
No |
16
(3.1) |
3
(0.7) |
19
(2.0) |
Unsure |
15
(2.9) |
13
(3.1) |
28
(3.0) |
Total |
519
(55.3)2 |
420
(44.7) |
939
(100.0) |
For the downhill direction from the before period to the after period, there were also significant differences (p = 0.0233) as follows:
- The percentage of motor vehicles safely overtaking bicyclists increased slightly from
93 to 94 percent.
- The percentage of motor vehicles not overtaking safely decreased from 5 to 1 percent.
- The percentage of motor vehicles where overtaking was unsure increased from 2 to 5 percent.
The uphill direction differences from the before to the after period were not statistically significant, as follows:
- The percentage of motor vehicles safely overtaking bicyclists increased slightly from
96 to 98 percent.
- The percentage of motor vehicles not overtaking safely remained constant at less than
1 percent.
- The percentage of motor vehicles where overtaking was unsure decreased from 4 to
2 percent.
Bicycle Data
In the after period, 91 percent of the bicyclists rode over the sharrow, and 9 percent did not (see figure 14). The percentage of bicyclists who rode over the sharrow was 88 percent in the uphill direction and 97 percent in the downhill direction. In the uphill direction, the grade was such that the speed of the bicycle was relatively slow, and many bicyclists rode relatively close to the curb (see figure 15).
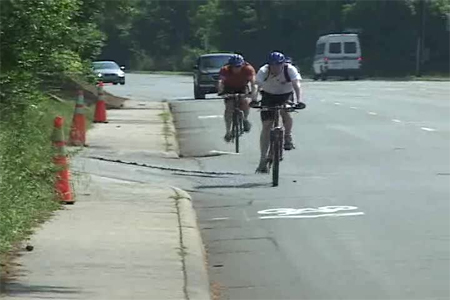
Figure 14. Photo. Bicyclists riding over the sharrow in the outbound (downhill) direction.
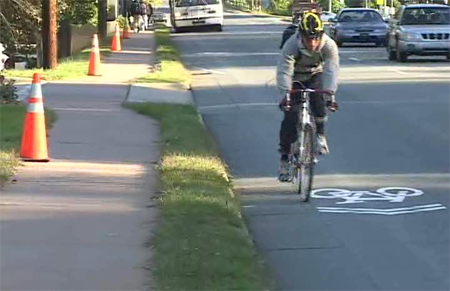
Figure 15. Photo. Bicyclist riding next to the sharrow in the inbound (uphill) direction.
In the before period, 98 percent of the bicyclists rode proximate to the curb (approximately 3 to 4 ft from the spacing data results to follow), and 2 percent rode near the center of the lane. In the after period, 99 percent of the bicyclists rode proximate to the curb, and 1 percent rode near the center of the lane. The differences were not significant. In the before period, 2 percent of the bicyclists were considered to have taken the lane (i.e., rode near the center of the lane in such a position where motor vehicles would most likely have to change lanes in order to pass), and in the after period, 1 percent of the bicyclists were considered to have taken the lane. The differences were not significant. Neither of these variables was affected by direction of travel.
Interactions Between Bicycles and Motor Vehicles
Table 19 shows the distributions of avoidance maneuvers and conflicts by period. In the before period, 81 percent of the bicycle/motor vehicle interactions resulted in avoidance maneuvers, and there were no conflicts. In the after period, 71 percent of the bicycle/motor vehicle interactions resulted in avoidance maneuvers, and there were no conflicts. The "None" category (no avoidance maneuvers or conflicts) increased from 19 percent in the before period to 29 percent in the after period. The differences were statistically significant (p < 0.001). These changes were consistent by direction of travel.
Table 19. Avoidance maneuvers, Chapel Hill, NC.
Interaction |
Before Period |
After Period |
Total |
Avoidance maneuver |
419
(80.7)1 |
297
(70.7) |
716
(76.3) |
None |
100
(19.3) |
123
(29.3) |
223
(23.8) |
Total |
519
(55.3)2 |
420
(44.7) |
939
(100.0) |
Table 20 shows the number of times bicyclists and motorists yielded (changed direction or speed to give way to the other) in the before and after periods while interacting with each other. Bicyclists yielded only once in the before period and none in the after period. Motorist yielding decreased from 4 percent in the before period to 3 percent in the after period. Neither party yielded in 95 percent of the interactions in the before period and in 97 percent in the after period. Removing the single instance of bicyclist yielding indicated that the differences were not statistically significant (p = 0.2034). There were more instances of motorist yielding in the downhill direction, but there were no significant differences by direction.
Table 20. Bicyclist and motorist yielding behavior, Chapel Hill, NC.
Yielding Behavior |
Before Period |
After Period |
Total |
Bicyclist |
1
(0.2)1 |
0
(0.0) |
1
(0.1) |
Motorist |
23
(4.4) |
12
(2.9) |
35
3.7) |
Neither |
495
(95.4) |
408
(97.1) |
903
(96.2) |
Total |
519
(55.3)2 |
420
(55.3) |
939
(100.0) |
Bicyclists rarely made any changes in riding behavior when interacting with motor vehicles. When riding in the downhill direction, bicyclists generally traveled at a reasonably fast speed and tracked in a consistent position in the roadway. In the uphill direction, the grade was such that many on-street bicyclists rode about 2 ft from the curb (just outside the drainage grate). Perhaps they did this to give them more space from overtaking motorists when they were traveling slowly. Thus, in virtually all interactions with motorists, bicyclists were coded as "kept moving safely." There were no differences between the before or after periods or the direction of travel.
Table 21 shows the full distribution of motorist responses during their interaction with bicyclists by period. Motorists completely changed lanes in 18 percent of the interactions in the before period and 17 percent in the after period. Motorists had slight direction changes in 58 percent of the interactions in the before period and 51 percent in the after period. Motorists had no changes in 20 percent of the interactions in the before period and 29 percent in the after period. Motorists slowed in 4 percent of the interactions in the before period and 3 percent in the after period. The differences between the before and after periods were statistically significant (p < 0.0110).
Table 21. Motorist responses during interactions with bicyclists, Chapel Hill, NC.
Motorist Response |
Before Period |
After Period |
Total |
Changed lanes |
94
(18.1)1 |
71
(16.9) |
165
(17.6) |
Slight direction change |
299
(57.6) |
214
(51.0) |
513
(54.6) |
Brakes |
0
(0.0) |
1
(0.2) |
1
(0.1) |
Slows |
23
(4.4) |
12
(2.9) |
35
(3.7) |
No change |
103
(19.9) |
122
(29.1) |
225
(24.0) |
Total |
519
(55.3)2 |
420
(44.7) |
939
(100.0) |
Examining this variable further by direction of travel showed significant differences (p = 0.0350) for the uphill direction as follows:
- Motorists changing lanes decreased from 20 to 14 percent.
- Motorists making slight direction changes (slight lateral movement) decreased from 57 to 56 percent.
- Motorists making no changes increased from 21 to 30 percent.
- Motorists slowing down decreased from 2 to 1 percent.
The differences from the before to the after period for the downhill direction were also statistically significant (p = 0.0365) as follows:
- Motorists changing lanes increased from 17 to 22 percent.
- Motorists making slight direction changes decreased from 58 to 44 percent.
- Motorists making no changes increased from 19 to 28 percent.
- Motorists slowing down remained unchanged at 6 percent.
There were occasions in these bicycle/motor vehicle interactions where a subsequent interaction occurred. All of these interactions involved a motorist in an adjacent lane reacting to a motor vehicle in the act of passing a bicycle encroaching, or tending to encroach, into the adjacent lane. There were 15 of these events in the before period and 3 in the after period. All but two of these were in the downhill direction. During these events, the motorist in the adjacent lane tended to slow down or make a direction change. These counts are likely conservative in that the videotape perspective did not always provide a clear view of interactions in adjacent lanes.
Spacing Measures
Bicycle to Curb
Table 22 shows the results from the analysis of the distance between bicycles and curbs when motor vehicles were not present. Overall, bicyclists rode closer to the curb after the sharrow was implemented. The reduction in spacing between the bicycle and curb was the highest in the downhill direction, with a decrease of 4.6 inches (from 47.1 to 42.5 inches), and this reduction was statistically significant (p = 0.049). This may reflect the large proportion of bicyclists who tracked over the sharrows. The reduction in spacing between the bicycle and the curb was 2.9 inches (from 35.2 to 32.3 inches) in the uphill direction.
When the percentage of bicyclists within 30 inches of the curb was examined, the combined uphill and downhill directions experienced a small and insignificant decrease in percentage in the after period that was due to an uneven number of values by direction. In the downhill direction, the percentage increased from 13 to 15 percent, and in the uphill direction, the percentage increased from 47 to 51 percent. None of these changes were statistically significant. In the uphill direction, the percentage riding within 24 inches of the curb, and thus within the spacing of the drain grates, decreased from 27 to 24 percent, while the proportion riding within 24 inches of the curb in the downhill direction increased from 4 to 5 percent (not shown in table and no significance tests). When the percentage within 40 inches was investigated, all three values experienced an increase, but only the percentage increase in the uphill direction approached statistical significance (p = 0.057). These results confirm the videotape coding that showed a lower percentage of bicyclists riding over the sharrow in the uphill direction.
Bicycle to Passing Motor Vehicle
Table 23 shows the results from the analysis of the average distance between bicycles and passing motor vehicles. The combined directions showed a small decrease in passing distance. However, after the introduction of the sharrow, the distance between bicycles and motor vehicles decreased 7 inches in the downhill direction, and the difference was significant (p = 0.012). There was no significant change in the uphill direction. The percentage within 50 inches showed only small and insignificant differences. The percentage within 60 inches increased from 8 to about 18 percent in the downhill direction in the after period. Again, there was essentially no difference in the uphill direction.
Table 22. Distance between bicycle and curb (motor vehicle not present), Chapel Hill, NC.
Direction |
Analysis of Average Spacing |
Analysis of the Percentage Within 30 inches |
Analysis of the Percentage Within 40 inches |
Number of Observations |
Average Spacing (inches) |
Results of ANOVA Test |
Percent |
Results of Chi-Square Test |
Percent |
Results of Chi-Square Test |
Before |
After |
F(df1,df2) |
p- Value |
Before |
After |
Chi-Square |
p- Value |
Before |
After |
Chi-Square |
p- Value |
Before |
After |
Downhill and uphill |
40.1 |
37.7 |
1.94(1,344) |
0.165 |
32.9 |
31.9 |
0.04 |
0.850 |
60.0 |
65.4 |
1.09 |
0.297 |
155 |
191 |
Downhill |
47.1 |
42.5 |
3.95(1,162) |
0.049 |
12.5 |
15.0 |
0.20 |
0.653 |
37.5 |
46.0 |
1.15 |
0.283 |
64 |
100 |
Uphill |
35.2 |
32.3 |
1.43(1,180) |
0.233 |
47.3 |
50.5 |
0.20 |
0.656 |
75.8 |
86.8 |
3.62 |
0.057 |
91 |
91 |
Table 23. Distance between bicycle and passing motor vehicle, Chapel Hill, NC.
Direction |
Analysis of Average Spacing |
Analysis of the Percentage Within 50 inches |
Analysis of the Percentage Within 60 inches |
Number of Observations |
Average Spacing (inches) |
Results of ANOVA Test |
Percent |
Results of Chi-Square Test |
Percent |
Results of Chi-Square Test |
Before |
After |
F(df1,df2) |
p- Value |
Before |
After |
Chi-Square |
p- Value |
Before |
After |
Chi-Square |
p- Value |
Before |
After |
Downhill and uphill |
82.3 |
79.4 |
2.33(1,393) |
0.128 |
2.0 |
2.6 |
0.00 |
0.975 |
9.5 |
13.8 |
1.81 |
0.178 |
200 |
195 |
Downhill |
84.7 |
77.7 |
6.48(1,193) |
0.012 |
2.0 |
5.3 |
0.70 |
0.401 |
8.0 |
17.9 |
4.27 |
0.039 |
100 |
95 |
Uphill |
80.0 |
81.1 |
0.19(1,198) |
0.661 |
2.0 |
0.0 |
0.51 |
0.477 |
11.0 |
10.0 |
0.05 |
0.818 |
100 |
100 |
Motor Vehicle in Travel Lane to Curb
Table 24 shows the results from the analysis of the distance of a motor vehicle in the travel
lane and the curb. This distance increased about 7 inches when both directions were combined
(p < 0.001). The more prominent increase was 8.3 inches in the uphill direction (p < 0.001). There was an increase of approximately 5 inches in the downhill direction (p = 0.017). The percentages within 50 and 60 inches were also significantly lower in the after period. The
effect was most pronounced in the uphill direction. Figure 16 shows a typical view for the
uphill direction.
Figure 16. Photo. Motor vehicle position in the uphill direction after the sharrow.
Table 24. Distance between motor vehicles in the travel lane and the curb, Chapel Hill, NC.
Direction |
Analysis of Average Spacing |
Analysis of the Percentage Within 50 inches |
Analysis of the Percentage Within 60 inches |
Number of Observations |
Average Spacing (inches) |
Results of ANOVA Test |
Percent |
Results of Chi-Square Test |
Percent |
Results of Chi-Square Test |
Before |
After |
F(df1,df2) |
p- Value |
Before |
After |
Chi-Square |
p- Value |
Before |
After |
Chi-Square |
p- Value |
Before |
After |
Downhill
and uphill |
70.5 |
77.0 |
19.25(1,398) |
<0.001 |
9.5 |
2.0 |
9.04 |
0.003 |
30.0 |
13.0 |
17.12 |
<0.001 |
200 |
200 |
Downhill |
76.6 |
81.3 |
5.83(1,198) |
0.017 |
3.0 |
0.0 |
1.35 |
0.245 |
14.0 |
9.0 |
1.23 |
0.268 |
100 |
100 |
Uphill |
64.4 |
72.7 |
17.57(1,198) |
<0.001 |
16.0 |
4.0 |
6.72 |
0.010 |
46.0 |
17.0 |
19.49 |
<0.001 |
100 |
100 |
Analysis of Bicycle Riding on the Sidewalk
A possible effect of the sharrow is to shift bicyclists' riding on the sidewalk to riding on the roadway. In this corridor, sidewalk riding is particularly dangerous due to the large number of driveways (see figure 17).
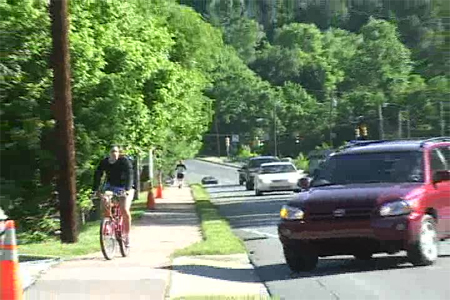
Figure 17. Photo. Bicyclist interaction with motor vehicle at driveway.
Before the sharrow was installed, observations of bicyclists riding on sidewalks were made on seven different days in July and August 2008, with four morning observation periods and three afternoon observation periods. Bicyclists on both sides of the corridor were observed. After period observations were made on eight different days from September to November 2008 shortly after sharrow installation and on four additional days from October to November 2009 for a total of four morning and eight afternoon observation periods.
Table 25 shows that out of 290 observations for the entire study 33.8 percent of observed bicyclists were riding on the sidewalk while 66.2 percent were riding on the roadway in a travel lane. Most bicyclists, 90.3 percent, were observed to ride in the correct direction of traffic, while 9.7 percent rode against traffic. Of the 28 bicyclists riding against traffic, only 2 were observed to be in a travel lane at the time, and the remainder were on the sidewalk. Bicyclists are allowed to ride on the sidewalks along this corridor. There is at least one regulatory sign and markings posted on the shared walkway in some areas prohibiting wrong-direction riding, but they have not been well-maintained and seem to be largely ignored. The researchers were not aware that this prohibition had been enforced.
Table 25. Bicyclist position and direction observations for entire study period, Chapel Hill, NC.
Wrong Way |
Number of Observations
and Bicycle Position |
Sidewalk |
No |
Yes |
Total |
No |
Number of observations |
190 |
72 |
262 |
Percentage within wrong way |
72.5 |
27.5 |
100.0 |
Percentage within sidewalk |
99.0 |
73.5 |
90.31 |
Yes |
Number of observations |
2 |
26 |
28 |
Percentage within wrong way |
7.1 |
92.9 |
100.0 |
Percentage within sidewalk |
0.7 |
26.5 |
9.7 |
Total |
Number of observations |
192 |
98 |
290 |
Percentage of total |
66.2 |
33.8 |
100.0 |
From the sample of observed bicyclists, 43 percent were riding on the sidewalk before the sharrows were installed compared with 23 percent who were riding on the sidewalk after sharrow installation (see table 26). A chi-square test of independence suggests that the sharrows had a significant influence on where bicyclists chose to ride. The difference in proportions was significant (chi square or Cochran's test of conditional independence = 12.495, df1, p < 0.001)
Table 26. Sidewalk riding before and after sharrow installation (both directions), Chapel Hill, NC.
On Sidewalk |
Before Period |
After Period |
Total |
No |
90
(57.0)1 |
97
(77.0) |
187
(65.8) |
Yes |
68
(43.0) |
29
(23.0) |
97
(34.2) |
Total |
158
(55.6)2 |
126
(44.4) |
284
(100.0) |
While the number of downhill observations was equal, there were 35 percent less uphill observations in the after period than in the before period, Since there were an unequal number of observations and unequal proportions of sidewalk riders by direction, further analysis controlled for direction of travel. It was necessary to ensure that any apparent shifts in sidewalk and wrong-way riding were not associated only with this potential confounder.
Researchers examined whether there was an effect of travel direction on the risk factors of bicycle sidewalk and wrong-way riding. The percentages (before and after combined) and the proportions of riders in different locations (on the sidewalk versus street) are shown below. Riding with or against traffic were both significantly different than expected depending on whether the bicyclists were riding uphill or downhill.
Overall, before and after bicycle riding directions and positions were as follows:
Downhill (total number of observations, n = 166):
- In street in correct direction with traffic: n = 125 (75.3 percent).
- In street in wrong direction against traffic: n = 1 (0.6 percent).
- On sidewalk in correct direction with traffic: n = 36 (21.7 percent).
- On sidewalk in wrong direction against traffic, n = 4 (2.4 percent).
Uphill (total n = 124):
- In street in correct direction with traffic: n = 65 (52.4 percent).
- In street in wrong direction against traffic: n = 1 (0.8 percent).
- On sidewalk, in correct direction with traffic: n = 36 (29.0 percent).
- On sidewalk in wrong direction against traffic: n = 22 (17.7 percent).
Researchers analyzed the effects on sidewalk riding before and after sharrow installation within the direction of travel. Table 27 shows sidewalk bicyclists in the uphill and downhill directions for the before and after periods.
Table 27. Sidewalk riding before and after sharrow within travel direction, Chapel Hill, NC.
Direction |
On Sidewalk |
Before Period |
After Period |
Total |
Downhill/ outbound |
No |
51
(61.4)1 |
75
(90.4) |
126
(75.9) |
Yes |
32
(38.6) |
8
(9.6) |
40
(24.1) |
Total |
83
(50.0) |
83
(50.0) |
166
(100.0) |
Uphill/
inbound |
No |
39
(52.0) |
27
(55.1) |
66
(52.9) |
Yes |
36
(48.0) |
22
(44.9) |
58
(47.1) |
Total |
75
(60.5)2 |
49
(39.5) |
121
(100.0) |
The overall difference in the proportions of sidewalk riding versus on-street riding was due to a significant decrease in the proportion of bicyclists riding on the sidewalk in the downhill direction from 39 percent in the before period to less than 10 percent in the after period. In the uphill direction, the proportion riding on the sidewalk declined from 48 to 45 percent following sharrow implementation, but the change was not statistically significant. (The most recent observations in 2009 showed even lower percentages riding on the sidewalk than in the after period as a whole, but the number of observations was small.)
The difference in proportions in the downhill direction was significant (chi-square = 18.971, p = 0.000). The difference in proportions in the uphill direction was not significant (chi-square = 0.115, df1, p = 0.854). (Cochran's test of conditional independence = 11.151, df1, p = 0.001.)
While all but two cases or 93 percent of wrong-way bicyclist riding occurred on sidewalks, it is conceivable that wrong-way riding could also have been affected by the sharrow treatment (e.g., if the directional arrows somehow influenced those riding on adjacent sidewalks to avoid wrong-direction riding). Table 28 illustrates overall results for wrong-direction riding in the before and after periods. The difference in proportions was not significant (chi-square or Cochran's test of conditional independence = 0.649, df1, p = 0.420).
Table 28. Wrong-way riding before and after sharrow installation (both directions), Chapel Hill, NC.
Wrong Way |
Before |
After |
Total |
No |
141
(89.2)1 |
121
(91.7) |
262
(90.3) |
Yes |
17
(10.8) |
11
(8.3) |
28
(9.7) |
Total |
158
(54.5)2 |
126
(45.5) |
284
(100.0) |
Wrong-way bicycle riding occurred 8 percent of the time in the after period compared to 11 percent in the before period, but the differences were not significant. Thus, the null hypothesis that there is no association or effect of the sharrow on the proportions of wrong-way riding overall cannot be rejected.
Proportions of wrong-direction bicycling by the inbound versus outbound direction were also examined to ascertain whether there were differences in effect by direction. Table 29 shows that the number of wrong-direction bicyclists in both periods was small in the downhill direction. In the uphill direction, the proportion of wrong-direction riding was essentially the same for both periods, around 19–20 percent. Thus, the sharrows were not associated with a reduction in wrong-direction riding that occurred predominantly on the east sidewalk and uphill (results confirmed by Fisher's exact test).
Table 29. Wrong-way riding within travel direction, Chapel Hill, NC.
Direction |
Wrong Way |
Before Period |
After Period |
Total |
Downhill/ Outbound |
No |
80
(96.4)2 |
81
(97.6) |
161
(97.0) |
Yes |
3
(3.6) |
2
(2.4) |
4
(3.0) |
Total |
83
(50.9)1 |
80
(49.1) |
163
(100.0) |
Uphill/ Inbound |
No |
61
(81.3)2 |
37
(80.4) |
98
(81.0) |
Yes |
14
(18.7) |
9
(19.6) |
23
(19.0) |
Total |
75
(62.0)1 |
46
(38.0) |
121
(100.0) |
Analysis of Speed Data
Analyses of speed data were conducted from the before and after periods at two sharrow implementation locations (test sites) and at two locations along the same corridor where sharrows were not implemented (comparison sites). Data were collected at the same sites and directions in the before and after periods and at the same morning or afternoon time periods for each site. Although the sites did not match perfectly in terms of before-implementation speeds or geometric characteristics, comparison sites were used to control for unexpected time-related trends and for seasonality since before data were all collected in late winter (February to March 2008), and after data were collected in September 2009, which was nearly 1 year after sharrow implementation. Speeds were measured with laser radar for approximately 100 free-flowing vehicles (vehicles that were not part of a platoon or closely following other vehicles) at each location and study period except near Weaver Dairy Road, where two before period and one after period speed studies were conducted (see table 30).
Table 30. Results of laser speed studies (mi/h) before and after sharrow implementation, Chapel Hill, NC.
Type of Site |
Street Locations |
Period |
Mean |
n |
Standard Deviation |
Median |
Minimum |
Maximum |
Sharrow sites |
Hillsborough |
Before |
41.63 |
101 |
3.939 |
41.00 |
34 |
54 |
After |
42.29 |
105 |
4.028 |
43.00 |
32 |
51 |
Total |
41.97 |
206 |
3.988 |
42.00 |
32 |
54 |
Longview |
Before |
41.82 |
98 |
5.010 |
41.00 |
30 |
61 |
After |
39.76 |
108 |
3.884 |
40.00 |
32 |
48 |
Total |
40.74 |
206 |
4.562 |
40.00 |
30 |
61 |
Comparison sites |
Weaver Dairy |
Before |
43.41 |
205 |
4.551 |
43.00 |
34 |
55 |
After |
42.62 |
106 |
3.907 |
42.00 |
33 |
53 |
Total |
43.14 |
311 |
4.352 |
43.00 |
33 |
55 |
Estes |
Before |
42.14 |
99 |
4.753 |
42.00 |
31 |
58 |
After |
44.24 |
103 |
4.541 |
44.00 |
34 |
56 |
Total |
43.21 |
202 |
4.753 |
43.00 |
31 |
58 |
Total |
Before |
42.50 |
503 |
4.624 |
42.00 |
30 |
61 |
After |
42.20 |
422 |
4.386 |
42.00 |
32 |
56 |
Total |
42.36 |
925 |
4.517 |
42.00 |
30 |
61 |
The Weaver Dairy comparison site had a raised median and bicycle lanes, while the Estes site was geometrically more similar to the sharrow implementation locations with a two-way center turn lane and wide outside lane configuration in one direction and a paved shoulder in the other. Although both comparison sites had higher initial speeds, the Estes site mean and median speeds were more similar to the sharrow implementation locations in the before period.
As the results from table 30 suggest, the speeds did not change by a large amount from the before to the after period. A univariate analysis of variance of speed was conducted to determine whether a significant speed reduction corresponding to the sharrow implementation occurred. Two models were examined: one included data from both comparable locations and the second included data only from the most similar location. The models incorporated an intercept term and dummy variables to indicate whether the location was a test location or a non-test location and for before and after periods. The interaction term of test location by before versus after periods is the primary term used to detect whether there was a significant change from the before to the after period for the sharrow locations versus the comparison groups.
There was a slight reduction of less than 1 mi/h in the locations where the sharrow was implemented and a slight overall increase of less than 1 mi/h at nonsharrow sites (see table 31). The reduction was not significant at the 95 percent confidence level when tested against both comparison sites (results shown in table 31). The reduction was significant at the 95 percent confidence level when compared with only the closer, more similar site (results not shown). The 0.7-mi/h reduction was attributable to a reduction at one location/direction (see Longview results in table 30), since mean speeds increased at the other site/direction.
Table 31. Comparison of before and after speeds (mi/h) at sharrow and comparison sites, Chapel Hill, NC.
Test |
Period |
Mean |
Change in Mean |
95 Percent Confidence Interval |
Standard Deviation |
n |
Sharrow |
Before |
41.72 |
-0.72 |
41.108, 42.339 |
4.488 |
199 |
After |
41.00 |
40.410, 41.599 |
4.144 |
213 |
Comparison |
Before |
43.00 |
+0.42 |
42.502, 43.498 |
4.649 |
304 |
After |
43.42 |
42.821, 44.022 |
4.298 |
209 |
Total |
Before |
42.50 |
-0.16 |
41.97, 42.76
41.79, 42.64 |
4.624 |
503 |
After |
42.20 |
4.386 |
422 |
SUMMARY
Results from the data analysis of bicycles interacting with motor vehicles in the after period as compared to the before period are highlighted as follows:
- There was no difference in the percentage of motorists following or passing bicyclists (about 92 percent passing for both the before and after periods).
- The percentage of motorists who made no movement to change lanes when overtaking a bicyclist increased from 24 to 32 percent.
- The percentage of safe overtaking movements by motorists (approached and passed the bicyclist without difficulty) increased slightly from 94 to 96 percent, and the percentage of overtaking movements considered unsafe decreased from 3 to 0.7 percent.
- A total of 91 percent of bicyclists rode over the sharrow, distributed as 97 percent in the downhill direction and 88 percent in the uphill direction.
- There was no difference in the proportion of bicyclists riding near the curb (approximately 98 percent) or taking the lane (approximately 2 percent).
- The percentage of avoidance maneuvers decreased from 81 to 71 percent.
- The percentage of motor vehicles staying in the lane when following bicycles increased from 20 to 29 percent.
- There was no change in the percentage of bicyclists or motorists who yielded (neither user yielded 96 percent of the time).
- The percentage of motorists who made slight lateral direction changes decreased from
58 to 51 percent with more effect in the downhill direction, which decreased from 58 to 44 percent.
- The percentage of motorists who changed lanes decreased from 20 to 14 percent in the uphill direction and increased from 17 to 22 percent in the downhill direction.
Results from the spacing analysis in the absence of motor vehicles included the following:
- Bicyclists rode closer to the curb after the sharrow by about 2.5 inches, a decrease from 40.1 to 37.7 inches. The effect was more pronounced downhill (4.6 inches closer) versus uphill (2.9 inches closer). As in the Cambridge, MA, experiment, this probably is a reflection of a high percentage of bicyclists tracking over the sharrow.
- There were slight increases in the percentage of bicyclists riding within 30 and 40 inches of the curb. Within 30 inches, the increase was from 12.5 to 15 percent in the downhill direction and from 47 to 50.5 percent in the uphill direction.
Results for when motor vehicles passed bicyclists in the after period were as follows:
- There was a small decrease in the passing distance overall from 82 to 79 inches. In the downhill direction, the motor vehicles passed 7 inches closer to bicycles (from 84.7 to 77.7 inches). In the uphill direction, there was very little change (from 80.0 to 81.1 inches).
- The percentage of passing motor vehicles within 50 inches showed only small and insignificant differences (from 2.0 to 2.6 percent).
Results for when the distance of motor vehicles from the curb in the absence of bicycles was examined in the after period were as follows:
- The spacing increased 8.3 inches (from 64.4 to 72.7 inches) in the uphill direction, almost 5 inches in the downhill direction (from 76.6 to 81.3 inches), and 7 inches overall (from 70.5 to 77.0 inches).
- The percentages of motor vehicle right front tires within 50 and 60 inches of the curb were also significantly lower in the after period. The effect was most pronounced in the uphill direction with reductions from 16 to 4 percent within 50 inches and from 46 to 17 percent within 60 inches.
- Sidewalk riding significantly decreased from 43 percent in the before period to 23 percent in the after period. In the downhill direction, the reduction was from 39 to 10 percent. There was no significant change in the uphill direction.
- Wrong-way riding by bicyclists occurred 11 percent of the time in the before period and 8 percent of the time in the after period, and the change was not statistically significant.
Results from the motor vehicle speed data showed a slight reduction of less than 1 mi/h in the locations where the sharrow was implemented and a slight overall increase of less than 1 mi/h in the nonsharrow sites. Thus, the sharrows may have had a slight influence on motorist speeds, although it is debatable whether this is practically significant.
By examining the findings listed above, it is evident that the percent grade of the roadway had an effect on a variety of the outcomes. The downgrade resulted in bicyclists traveling closer to the speed of motor vehicles and riding in a location somewhat further from the curb. The uphill grade resulted in slower moving bicyclists riding closer to the curb and an increase in passing motor vehicles.
In the downhill direction, more motorists changed lanes completely (an increase from 17 to 21 percent) or remained in position and tracked in the outside lane (an increase from 26 to 34 percent) when overtaking bicyclists in the after period. The proportion of motorists making slight directional shifts decreased from 58 to 44 percent. A lower percentage of motorists changed lanes completely in the uphill direction (a decrease from 19 to 14 percent). The percentage of motorists staying in the lane behind bicyclists increased from 23 to 30 percent, and the percentage moving partway decreased slightly from 58 to 56 percent.
Mean bicyclist position (in the absence of motor vehicles) shifted toward the curb by about 5 inches in the downhill direction and by about 3 inches in the uphill direction. The grade of the street seemed to make a difference in bicyclist positioning. About 97 percent of bicyclists rode over the sharrow in the downhill direction compared to 88 percent in the uphill direction. The mean spacing to the curb in the downhill direction is almost identical to the distance of the center of the sharrow from the curb. Going uphill, there was a tendency for bicyclists to ride closer to the curb, with about 20 percent riding within 24 inches of the curb in the after period. The latter result suggests that these bicyclists would need to shift around the drain grates as they climbed the hill, a factor that could influence interactions with overtaking motorists; however, there was little indication of this being a factor when interactions were coded, probably because motorists were, on average, tracking further from the curb.
Although bicyclists overall rode closer to the curb, the motorist lateral passing distance (using only those motorists at least partly in the adjacent lane) to bicyclists decreased by 7 inches in the downhill direction but remained essentially the same with an increase of 1 inch in the uphill direction. This is a function of changes in motorist tracking and maneuvering near bicyclists in the after period. The difference by direction is probably due to the smaller decrease in proportion of motorists shifting partway to the adjacent lane and the closer positioning of bicyclists to the curb in the uphill direction. Thus, bicyclists may have been passed more frequently by motor vehicles remaining in the outside lane in the uphill direction but were passed at a similar spacing as before, whereas motorists may have passed bicyclists less frequently (in the same lane) in the downhill direction but passed somewhat more closely when doing so.
The percentage of bicyclists riding on the sidewalk decreased from 39 percent to less than 10 percent in the downhill direction but did not change appreciably in the uphill direction (45 to 48 percent from the before period to the after period). The shift of more bicyclists riding on the roadway as well as the placement of the sharrow could have contributed to the overall bicyclist shift toward the curb, with perhaps less experienced bicyclists being less likely to ride further out. Bicyclists riding uphill tended to ride more frequently near or within the drain grate area, and there was little shift in this tendency from the before period to the after period. Likewise, the proportion of riders traveling on the sidewalk in the uphill direction did not change significantly.
Thus, results suggest that the sharrows provided some possible enhancement to the safety of bicyclists in several ways. Sharrow installation increased the percentage of bicyclists who rode on the roadway, which would place the bicyclists in a more expected position with respect to motor vehicles entering and exiting the corridor. The sharrows also enhanced recognition of riding space for bicyclists. Motorists drove 7 inches farther from the curb overall after the sharrows, and there was a decrease in the proportion of motorists driving within 50 inches of the curb in both directions (3 percent change downhill and 12 percent change uphill). However, due to shifts in the observed percentage of motorists shifting laterally (excluding those changing lanes entirely), motorists passed bicyclists 3 inches closer on average in the after period and 7 inches closer in the downhill direction. Again, this measure excludes motor vehicles that changed lanes completely, which increased somewhat in the after period. These results may indicate a smoother operating traffic stream, particularly from a motor vehicle perspective, with more motorists feeling comfortable passing bicyclists within the outside lane if they did not opt to change lanes completely. However, the comfort level of bicyclists being passed may have decreased as a result of this. Data are not available on bicyclists' perceptions of the passing distance used by motorists to verify this conjecture. As noted, only about 5 percent of motorists passed within 50 inches of bicyclists downhill, where bicyclists were about 10 inches further from the curb on average when compared to the uphill direction. No motorists were observed passing within 50 inches in the uphill direction.
Operations and safety appear to have improved in the downhill direction. The impact for bicyclists commuting uphill along this corridor is less clear, because they tended to travel closer to the curb. The result of this would be less operating space when interacting with motor vehicles. On the other hand, motorists traveling uphill tended to travel further from the curb after sharrow placement, which would increase operating space for bicyclists.
|


