U.S. Department of Transportation
Federal Highway Administration
1200 New Jersey Avenue, SE
Washington, DC 20590
202-366-4000
Federal Highway Administration Research and Technology
Coordinating, Developing, and Delivering Highway Transportation Innovations
 |
| This report is an archived publication and may contain dated technical, contact, and link information |
|
Publication Number: FHWA-HRT-10-068
Date:November 2010 |
Crosswalk Marking Field Visibility Study
CHAPTER 4. DATA COLLECTION
CANDIDATE ROADWAY SELECTIONPRELIMINARY SITE SELECTIONPHOTOMETRIC READINGSSTUDY SITES AND CROSSWALK MARKINGSADDITIONAL CROSSWALKS ENCOUNTERED DURING DRIVEMARKING INSTALLATIONRETROREFLECTIVITY READINGSSTUDY PERIODSPARTICIPANTSTASKSPARTICIPANT TRAININGRESPONSE TIMEINSTRUMENTED VEHICLESSTUDY ROUTEPROCEDURE
CANDIDATE ROADWAY SELECTIONInitial efforts for this study began with identifying potential candidate roads or areas within the community. Potential study sites within TAMU west campus were determined. The main campus was eliminated due to challenges with developing a logical route as several roads have been closed to discourage vehicle traffic. TAMU west campus includes several miles of roadways, so a reasonable study route was possible. Another benefit to restricting the study location to the TAMU campus is that coordination regarding marking installation would be with only one agency.
PRELIMINARY SITE SELECTIONThe goal was to identify study sites with similar characteristics such as posted speed limit, cross section width, cross section type, presence of crosswalks, etc. Each study site had to be greater than 600 ft from another site, from a signal or all–way stop–controlled intersection, and from the turn onto the road. The 600–ft dimension was selected based on the review of the findings from the Knoblauch et al. study that found crosswalks were detected at about 400–500 ft.(2) The potential sites could easily be divided into the following three groups:
Each group had at least three feasible sites. The sites on F&B and Agronomy had similar characteristics such as pavement width, number of lanes, and presence of TWLTL. For the third group, sites had to be selected along several different roads. Divided roads were eliminated from the candidate list of sites, which resulted in the third group having potential sites on two roads. These sites had the same posted speed limits (30 mi/h) but with greater differences in cross section width (43–50 ft) than desired.
PHOTOMETRIC READINGSPhotometric readings were taken as part of the site selection process. Once the streets were determined, illuminance readings were taken at potential sites using a T–10 M Illuminance meter. The plan was to have half of the participants drive in a clockwise direction and the other half drive in a counterclockwise direction. Therefore, the readings were taken on both sides of the street during nighttime conditions for each of the potential sites. The receptors were arranged such that there was one receptor facing each direction of travel and one straight up. Each receptor head was given an identification number, and the three receptor head adapters were connected in series to the main body adapter to record readings simultaneously. An in–house portable setup was built to hold the equipment arrangement for convenience and safety in the field. The sensors were placed such that they did not interfere with each other, were within inches of the pavement surface, and were approximately 4 ft from the curb. Two technicians were involved in the reading. One person operated the instrument and called out the readings while the other watched traffic and recorded the readings. The readings were taken when there was no traffic on the street. The readings from the sensor facing straight up were considered in site selection. For each of the three groups or roads being considered, the research team identified those sites with similar crosswalk width and illuminance readings. Three sites that had the most similar nighttime light level and that would result in the greatest distance between the study sites were then selected within each group. Table 2 summarizes the characteristics of the sites selected within the three groups. While the characteristics are not the same, they are the most similar of the sites available for this study. Table 2. Site characteristics.
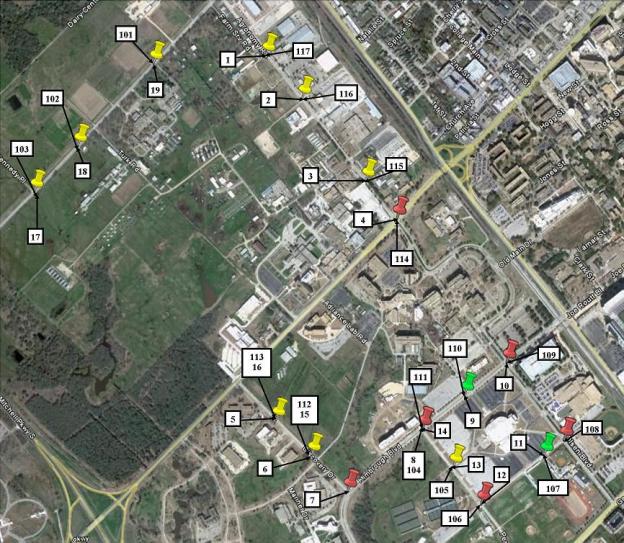
STUDY SITES AND CROSSWALK MARKINGSThe route taken through the TAMU west campus included a number of intersections and midblock locations with crosswalks. Some of the locations had pre-existing crosswalks while others had experimental crosswalk markings added as part of this study. Figure 8 shows the location of the study sites along with the number assigned to the crosswalk for each direction. The distances between the sites are shown in figure 9 . Within each group, the test marking patterns were installed so that a participant did not encounter the marking pattern in the same order across roadway segments. In figure 8 and figure 9 , the sites are depicted as follows:
Table 3 lists the sites included in the driving route in the order the participant would encounter them when driving the clockwise route. The site characteristics for the counterclockwise route are listed in table 4. The tables also include the nighttime light level along with the retroreflective measurement of the newly installed markings.
Figure 8. Map. Location of crosswalk study sites.
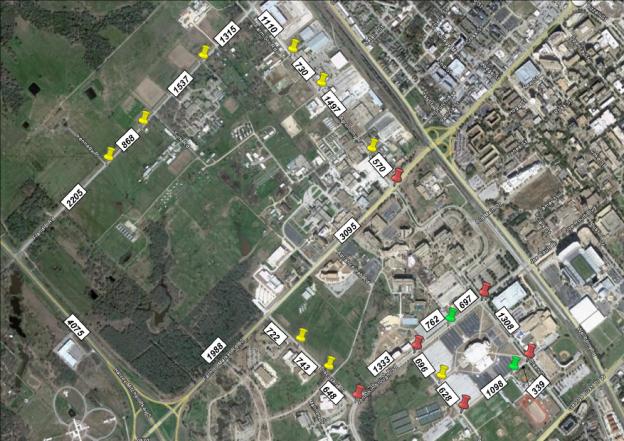
Figure 9. Map. Distances between crosswalk study sites.
Table 3. Crosswalk number and characteristics for clockwise route.
Table 4. Crosswalk number and characteristics for counterclockwise route.
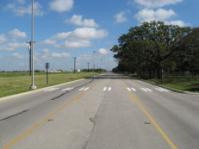
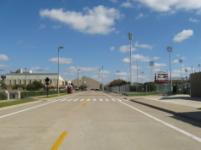
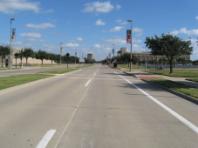
The sites at study locations (see table 3 and table 4 ) were the sites of primary interest in this research. Markings were newly installed at each of these sites. Each of the sites is located on non-stop-controlled approaches. The following figures show the nine study sites:
Figure 10. Photo. Installed bar pairs on F&B.
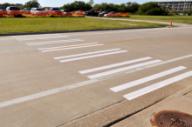
Figure 11. Photo. Installed continental on F&B.
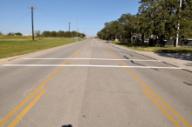
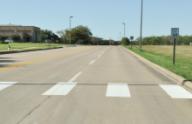
Figure 12. Photo. Installed transverse on F&B.
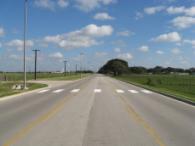
Figure 13. Photo. Installed bar pairs on Agronomy.
Figure 14. Photo. Installed continental on Agronomy.
Figure 15. Photo. Installed transverse on Agronomy.
Figure 16. Photo. Installed bar pairs on Penberthy.
Figure 17. Photo. Installed continental on Discovery.
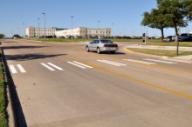
Figure 18. Photo. Installed transverse on Discovery. The markings are 10 ft long. This length was selected to reflect the typical length used for a midblock crossing. The continental and bar pairs stripes were spaced to avoid the wheel path of the vehicles. Figure 19 shows a schematic of the marking dimensions for bar pairs. Figure 20 shows a schematic of the marking dimensions for continental, and figure 21 shows a schematic of the marking dimensions for transverse markings. Each of the three marking patterns was installed at three locations along the driving route for a total of nine study sites.
Figure 19. Graphic. Dimensions used for installed bar pair markings.
Figure 20. Graphic. Dimensions used for installed continental markings.
Figure 21. Graphic. Dimensions used for installed transverse markings.
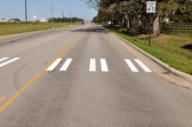
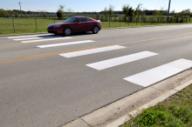
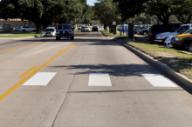
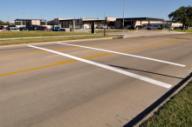
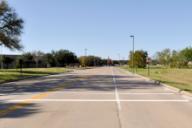
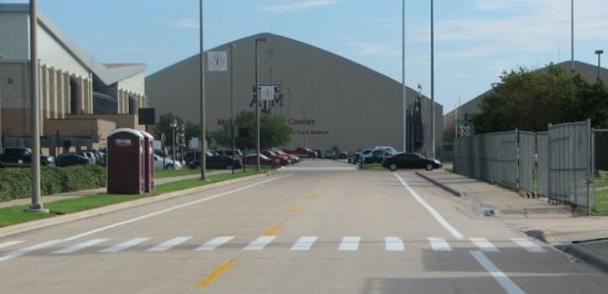
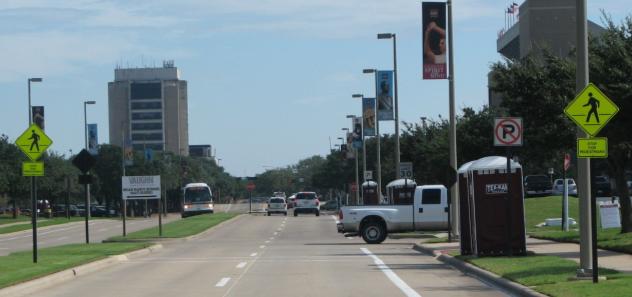
ADDITIONAL CROSSWALKS ENCOUNTERED DURING DRIVEAlong the proposed driving routes, the participants crossed several existing crosswalks located at intersections or at midblock. The sites with existing crosswalk markings located at stop-controlled intersections or at signals are identified in table 3 and table 4 as E–intersection. These crosswalks were included in the study because they were along the driving route. The driving routes also included two existing midblock locations, identified as E–midblock in table 3 and table 4 . Figure 22 shows a photo of the midblock location with a continental pattern, and figure 23 shows the midblock location with transverse markings. The site with continental markings was located approximately 300 ft from an intersection. A pedestrian warning sign (W11–2) was not present on this approach but was present on the opposite approach. Because the available viewing distance following the turn was only 300 ft, data for the approach to the existing continental site were removed during data analysis. The transverse marking site had pedestrian warning signs (W11–2) in advance of the crossing on both approaches. Because the midblock transverse marking site was worn, those markings were repainted at the same time the new markings were installed at the nine study sites. The existing midblock markings were painted rather than being made with marking tape and had warning signs on their approaches. Therefore, comparison between these existing sites and the sites where markings were installed for this study is limited.
Figure 22. Photo. Existing midblock site with continental markings (closeup of markings; pedestrian warning sign on approach not visible in this photo).
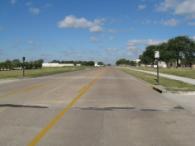
Figure 23. Photo. Existing midblock site with transverse marking (distance view before repainting to show pedestrian crossing warning sign).
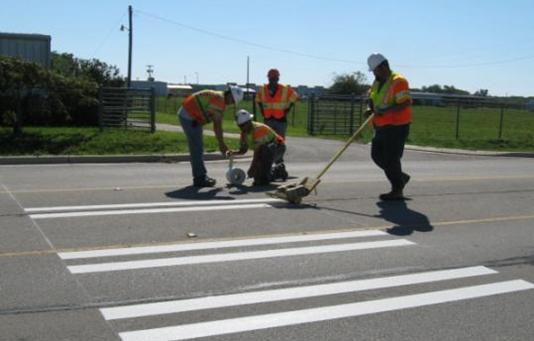
MARKING INSTALLATIONNew crosswalk markings were installed at each of nine study sites using temporary marking tape (see figure 24 for example). The marking material used was Brite–Line® Series 100 white removable pavement marking tape. At a few of the sites during the study, parts of the markings peeled away from the pavement, usually because of standing water from a rainstorm. Markings were replaced as soon as the issue was identified. For one day, the transverse markings on Agronomy were not present, and viewing distances were not available for that site for that day. Additional participants were added to the study to offset this situation.
Figure 24. Photo. Example of marking installation.
RETROREFLECTIVITY READINGSOnce sites were selected and pavement markings installed, retroreflectivity readings were taken at all sites. The retroreflected luminance (RL) readings were taken using an LTL 2000SRetroreflectometer. The instrument uses an illumination angle of 1.24 degrees and an observation angle of 2.29 degrees to simulate a driver's viewing distance of 98 ft and an eye height of 47 inches. Readings were recorded at a number of positions along the marking, and the average of these readings was used. Table 3 and table 4 list the average reading for each site. The ATSSA recommended minimum RL value is 100 mcd/m2/lx.(8) As expected, the new markings greatly exceeded the recommended minimum, and no noticeable difference was observed among the markings at the study sites.
STUDY PERIODSThe study was conducted under both daytime and nighttime conditions over two weeks in November 2009. The actual dates for the study were as follows:
For November 2009, the sunset occurred about 5:25 p.m. The study took approximately 1 h from meeting the participant to the close of debriefing (see table 5 ). Half of the participants drove during daylight hours and half during nighttime conditions. The following time blocks were used:
The study was not conducted when it rained on Sunday evening, November 15. Table 5. Participant time in study.
PARTICIPANTSThe initial intent was to recruit a group of participants composed of one–quarter males over 55 years, one–quarter females over 55 years, one–quarter males under 55 years, and one–quarter females under 55 years. Within each of those demographic groups, the goal was to have an even distribution between those who drove at day and those who drove at night; those who drove the clockwise route and those who drove the counterclockwise route; and those who drove the SUV and those who drove the sedan. Therefore, the following divisions were used in structuring participant recruitment:
The research goal was to have 2 participants in each category for a total of 64 participants. A total of 78 participants were included in the study. Participants were added to: (1) replace a participant who did not take the study seriously and provided questionable results and (2) add additional data to offset the study site that had missing markings for a selection of participants. Also, if a time group (e.g., daytime or nighttime) was opened, the goal was to fill the entire group. Six participants could run within a time group (three 1–h blocks with two vehicles). The final participant pool is shown in table 6. Table 6. Distribution of participants.
Participants were at least 18 years old and possessed a valid driver's license with no restrictions. Participants were recruited by word of mouth, flyer distribution, and communication with people who participated in past studies and indicated an interest in future studies. Flyers with information about the study, location, contact information, dates, and compensation were distributed among friends and acquaintances and were posted in public places. After the driving portion of the study, participants returned to the meeting location and were debriefed regarding their experience. Upon completion of the debriefing, participants received monetary compensation of $40.
TASKSThe main task for the participants was to indicate when a crosswalk was detected. Detection distance was measured on the first lap of the route and was the primary measure of effectiveness of the marking patterns. In order to encourage normal driving and eye glance patterns, additional detection tasks were imposed on the participants. These distracter tasks were selected carefully to include items that participants would normally be looking for both on the roadway surface and alongside the road. The two items selected were pavement marking TWLTL arrows and speed–limit signs. The second measure of effectiveness of the marking patterns was a subjective rating of appearance given by the participants on the second lap of the route. Each of these tasks is described in more detail in the Procedure section of this chapter. A final task asked participants to rank photographs of selected marking patterns on the basis of overall appearance and preference.
PARTICIPANT TRAININGTo ensure consistency, the research team used checklists and slide shows to aid in providing instructions to each participant. The slide show was advanced with a space bar so that the participant could proceed at any pace. The slide show opened with the following instructions: "Welcome to the driving study. Today while you drive we're going to ask you to be looking for some particular items along the route and then saying out loud when you notice these items. The items are:
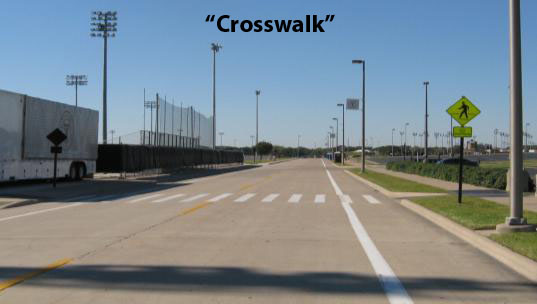
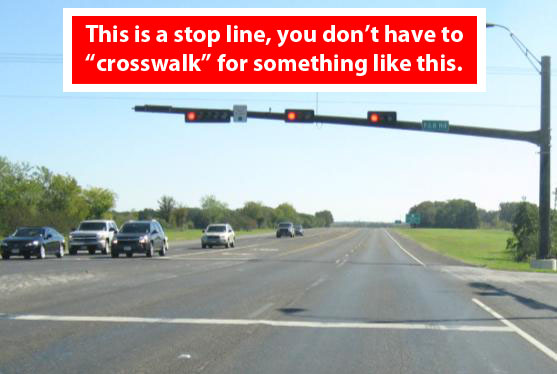
Following the introduction slide was a series of slides that provided example pictures of the crosswalks, speed–limit signs, and TWLTL arrows the participant would see. Figure 25 shows an example of a slide used in the show. The slide show also included examples of situations that would not require a response by the participant (see figure 26 ).
Figure 25. Graphic. Example of a crosswalk photograph included in training slide show.
Figure 26. Graphic. Example of a situation not requiring action included in training slide show.
RESPONSE TIMEAs part of the intake, the participant's and experimenter's response times were measured using a computer test to develop a correction factor for each participant. In the vehicle, the experimenter had to press a button when the participant said "crosswalk." There is a small lag between the participant speaking the word "crosswalk" and the experimenter pressing the button. The lag could vary between the experimenters collecting the data. To address this concern, a pretest was developed to measure the lag time between when the participant sees a symbol on the computer screen and speaks the symbol's name and when the experimenter presses the button. Figure 27 shows the instruction page for the start of the response time test. The following four images were used in the exercise: down arrow, up arrow, plus sign, and black circle (or dot). Each symbol was repeated five times for a total of 20 random images. The task required the participant to identify which stimulus was present and say the correct word, a task analogous to the in-vehicle task of saying "crosswalk" or "arrow." For the experimenters, the task was a simple reaction time test. They pressed a single button regardless of what the participant said, again analogous to the in-vehicle task.
Figure 27. Graphic. Instruction page for response time test. The participant was instructed to say the name of the shape as quickly as possible once the image appeared on the computer screen. The experimenter had a button that would be pressed upon hearing the participant say the shape name. The software recorded the time difference between the shape appearing on the screen and when the button was pushed. The participant faced the computer screen, and the experimenter's back was to the participant to avoid any anticipation on the part of the experimenter. An average of the pretest reaction time was used along with the vehicle's speed to estimate actual detection distance.
INSTRUMENTED VEHICLESThe following instrumented vehicles were used as subject cars for this experiment:
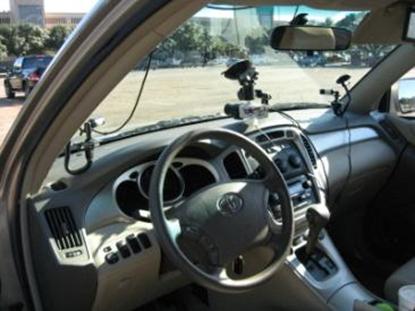
The Toyota Highlander was called the SUV in the study, and the Ford Taurus was called the sedan. 2006 Toyota Highlander (SUV) One of the instrumented vehicles used for this experiment was a 2006 Toyota Highlander. The instrumented vehicle has a larger alternator, radiator, and fan coupling than a normal vehicle and has a greater alternator capacity to power instruments in the vehicle. The vehicle also has an eight–way power seat in order to best accommodate test participants. The SUV headlamp is 33 inches high and 28 inches offset from center. The principal system within the instrumented vehicle was the Dewetron DEWE–5000. Essentially a large portable computer, the DEWE–5000 serves as the data acquisition device for all the peripheral systems in the vehicle. The DEWE–5000 is capable of sampling at 5000 Hz. For this experiment, data were collected at 100 Hz. The DEWE–5000 is mounted in a wooden equipment cabinet, which is located in the place of the driver's–side rear seat. A Trimble® DSM 232 global positioning system (GPS) receiver was used to track the position of the subject vehicle during a study. It employs a differential GPS antenna, which is mounted on the roof of the vehicle directly over the driver's seat. The GPS samples data at 10 Hz, and the receiver is mounted inside the equipment cabinet. The accuracy of the GPS unit is ±3.28 ft. Video data of the experiment were collected by several black–and–white cameras. Two of the cameras recorded the forward roadway scene, with one filming a telephoto view and the other filming a wide angle. The other two cameras were used to expand the side views. Figure 28 shows an example of the camera placement.
Figure 28. Photo. Interior of Toyota Highlander.
2003 Ford Taurus (Sedan) A similar portable onboard data acquisition system (DAS), DEWE–3100, was installed in the 2003 Ford Taurus. For this experiment, data were collected at 100 Hz. The DEWE–3100 was placed in the driver's–side rear seat. A portable inverter using the car battery was used to provide power for the system. The sedan headlamp was 27 inches high and 24 inches offset from center. An off–the–shelf BU–353 GPS receiver was used to track the position of the subject vehicle during the study. The GPS receiver samples data at 1 Hz and can be directly connected to the DAS. It employs an active patch antenna, which was mounted on the roof of the vehicle directly over the DAS set up. Video data of the experiment was collected by three black–and–white cameras and one color camera fitted with fisheye lens. Two of the cameras recorded the forward roadway scene, with one filming a telephoto view and the other filming a wide angle. The other two cameras were used to expand the side views. The software of the DAS can merge different data streams so that the information is visible at the same time. The DAS synchronized the vehicle speed and location coordinates (GPS data) along with video feed from all the cameras. The software can time–stamp any keyboard event onto the video frame so that when the experimenter marked a verbal response with a keystroke, it was time–stamped in the data file.
STUDY ROUTEThe driving route consisted of three parts, as follows:
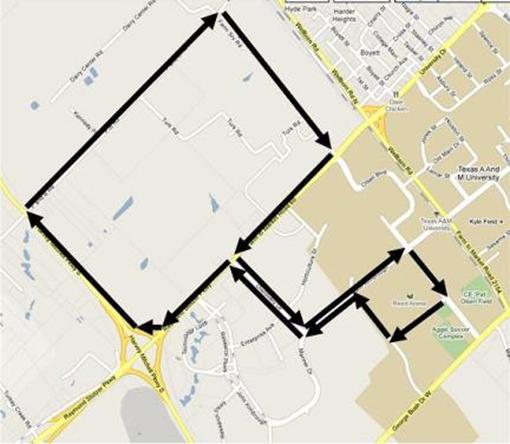
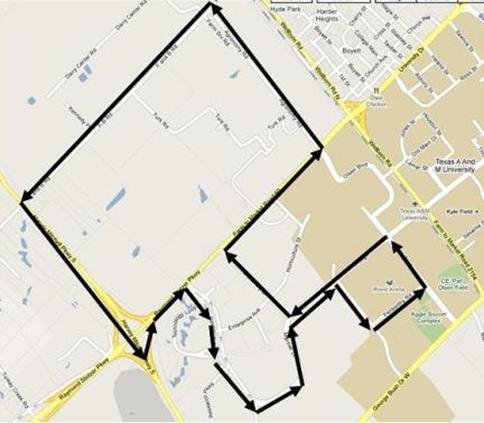
Participant intake was headquartered at the meeting house for a community service group in Bryan, TX, which was rented for the study. This location was chosen so participants should not need to pass any test markings on their way to the meeting location. The location was also selected because it was near the driving route, had public parking available, included restroom facilities, and was available to rent for a reasonable rate. The route on the TAMU west campus was driven in both clockwise and counterclockwise directions. Figure 29 shows the proposed route when driven in a clockwise direction (5.9 mi), and figure 30 shows the route when driven in a counterclockwise direction (7.2 mi).
Figure 29. Map. Clockwise route (5.9 mi).
Figure 30. Map. Counterclockwise route (7.2 mi).
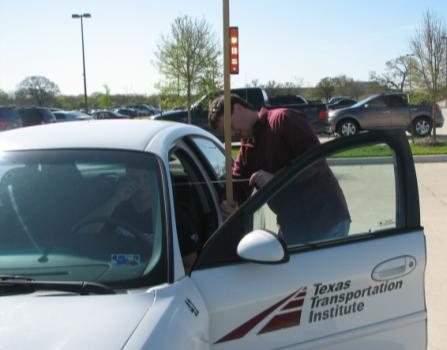
PROCEDUREParticipant Intake After meeting with a member of the research team to review the informed consent documentation and complete the demographic questionnaire, participants were given an overview of the study and how the data were to be collected. They were also given a Snellen visual acuity test and the Dvorine color vision test. The participants then reviewed the instructions for their task using a prepared slide show. After the slide show, the experimenter's and the participant's response times were measured. The participants were shown a map of the proposed route for the practice and TAMU west campus portions of the study. Participants were informed that they would be driving the Texas Transportation Institute (TTI) instrumented vehicle on public roads and were instructed not to exceed the posted speed limit. They were asked to drive the road system as they normally would and were reminded that they had complete control of the vehicle at all times. Two researchers accompanied the participant: one in the back seat controlling the equipment and the other in the front seat providing direction and acting as a safety observer. Participants were told not to use the radio or cruise control. Conversation between the participant, the experimenter, and the safety observer was permitted; however, the intention was to keep conversation light and at a pace implicitly determined by the participant. Vehicle Review The participant was escorted to the instrumented vehicle and given a walk–through of the vehicle's features. The participant was shown the video camera on the dash but was not told specifically what data were being collected. The participant was provided the opportunity to adjust the seat and mirrors and to become accustomed to the controls of the vehicle. A member of the research team then measured driver eye height. The participant held a piece of cord with a string level attached to the bridge of his or her nose while the experimenter held the other end of the cord to a measurement stick. The experimenter adjusted the string until it was being held level. Figure 31 shows an example of measuring a driver's eye height.
Figure 31. Photo. Measuring driver eye height. Lap 1: Crosswalk Detection Task The participant drove the initial portion of the route to become familiar with the vehicle. Once the participant was comfortable in the instrumented vehicle and had arrived in the parking lot of the TAMU General Services Building, the participant was reminded to indicate when he or she passed one of the following items:
The participant was instructed to say a preselected word to indicate detection of a crosswalk, TWLTL arrows, or a speed–limit sign. The experimenter recorded the response on the DAS computer. The following instructions were given to the participants: When you see crosswalk markings, I'd like you to indicate so by saying "crosswalk." When you see double turn arrows, I'd like you to indicate so by saying "arrows" or "turn arrows." When you see a speed–limit sign, I'd like you to indicate so by saying "speed limit." As soon as the participant said "crosswalk," the rear seat experimenter pressed the appropriate button on the DAS, which placed a mark in the file to indicate detection. When the participant said "turn arrows" or "speed limit," the rear seat experimenter checked the item on a checklist of all crosswalks, TWLTL arrows, and speed–limit signs present along the route. The locations of these other targets were not marked in the computer file in order to keep the data files clean so crosswalk detection could be clearly determined. Lap 2: Appearance Ratings After completing the initial route, the participant was told to pull into one of the parking spaces in front of the TAMU General Services Building. In the parking lot, the participant was given additional instructions and asked to drive the same route again to rate each crosswalk marking on how easy it was to see. The instructions given to the participant were as follows: "For the next part of the study, we'll be driving the same route. This time, when you approach a crosswalk, please rate it on how easy it was to see, according to the following scale (show the card): A: Excellent: Very easy to see. B: Very Good: Easy to see. C: Acceptable: Okay. D: Not Acceptable: Not easy to see. F: Completely unacceptable: I would have missed it, if I wasn't looking for it. I'll be telling you when we're approaching one of the crosswalks I'd like you to grade." The participant was then shown the scale illustrated in figure 32 . The participant's answers were recorded by the experimenter on a predeveloped checklist of all crosswalks along the route. When provided, participant comments were recorded for explanation of the response.
Postdrive Preference Ratings After completion of the driving tasks, participants drove back to the starting location and were asked to complete a final task before receiving payment. The participant was shown pictures of five of the crosswalk markings located along the route and asked to rank order them from 1 to 5, where 1 was the favorite in terms of ability to see as a driver. These pictures are shown in figure 33 through figure 37.
Figure 33. Photo. Postdriving ranking task, image I.
Figure 34. Photo. Postdriving ranking task, image II.
Figure 35. Photo. Postdriving ranking task, image III.
Figure 36. Photo. Postdriving ranking task, image IV.
Figure 37. Photo. Postdriving ranking task, image V.
FHWA-HRT-10-068
|
||||||||||||||||||||||||||||||||||||||||||||||||||||||||||||||||||||||||||||||||||||||||||||||||||||||||||||||||||||||||||||||||||||||||||||||||||||||||||||||||||||||||||||||||||||||||||||||||||||||||||||||||||||||||||||||||||||||||||||||||||||||||||||||||||||||||||||||||||||||||||||||||||||||||||||||||||||||||||||||||||||||||||||||||||||||||||||||||||||||||||||||||||||||||||||||||||||||||||||||||||||||||||||||||||||||||||||||||||||||